Panda Display Spread
- インディケータ
- Brian P Cusack
- バージョン: 2.50
- アップデート済み: 4 3月 2023
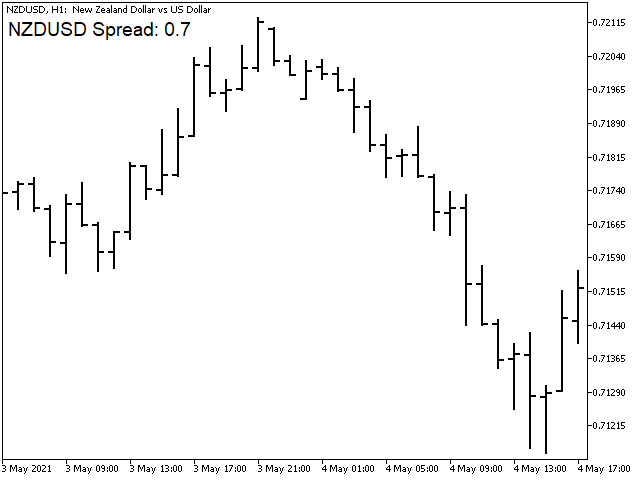
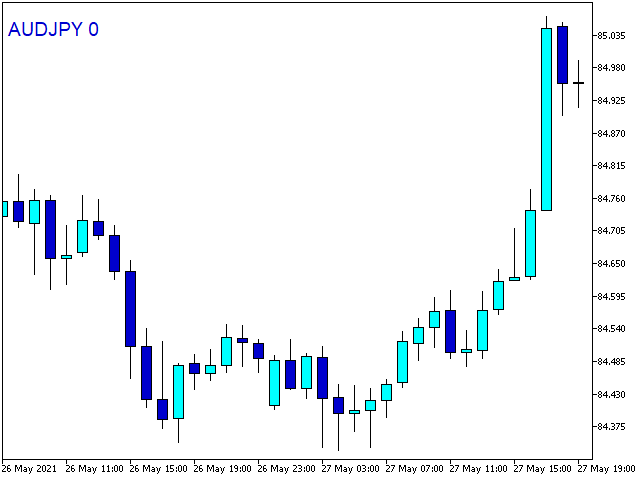
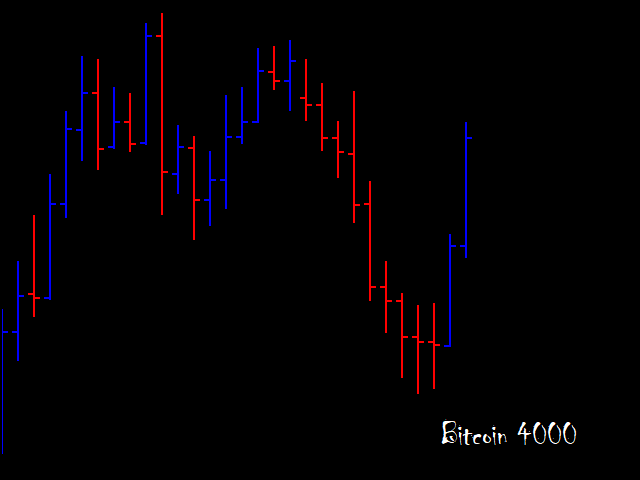
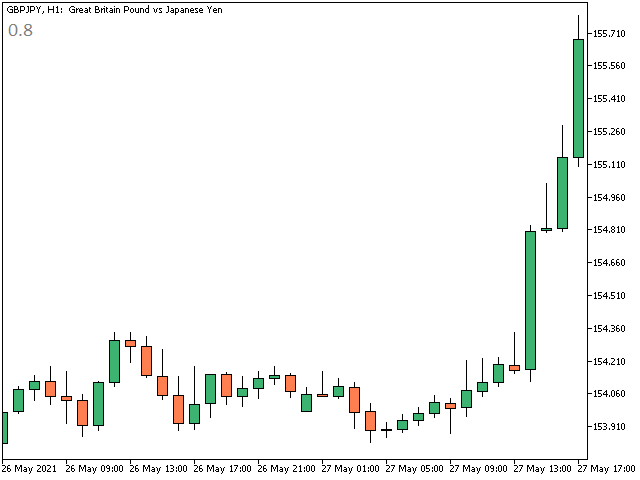
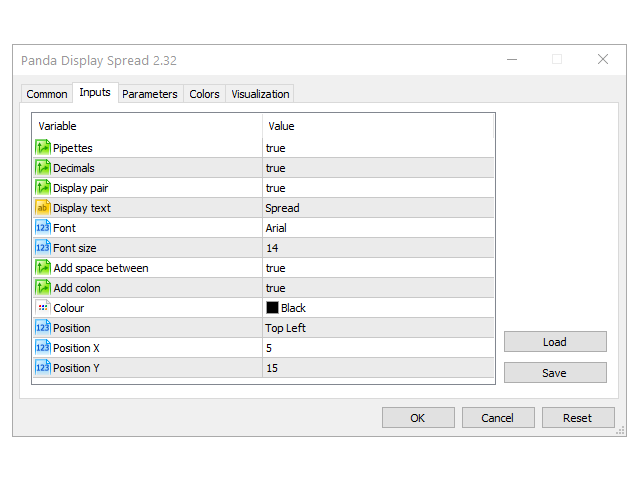
This indicator displays the spread
Simple and easy to use and fully customisable:
-
View as Pips or Pipettes
-
Chart symbol can be hidden
-
Text display can be changed
-
Change color and text styles
-
Add or hide a decimal point
-
Spacing options between inputs
-
Default screen positions
-
Screen position inputs
How to use
1. Simply use the default settings; or
2. Choose to show pips or pipettes;
3. Choose to display symbol, text or decimal;
4. Choose where to place it on the screen;
5. Save settings or save on a template.
Panda Pro Spread version with even more options is available now.
| Join our Telegram @PandaTradingGroup for suggestions and feedback: https://t.me/PandaTradingGroup Telegram me @BrianCusack for support and special requests: https://t.me/BCusack Panda toolbox: https://www.mql5.com/en/users/briancus/seller |


Very good indicator!