• 概要
  • レビュー
  • コメント
  • 最新情報

TheStrat FTFC MT5

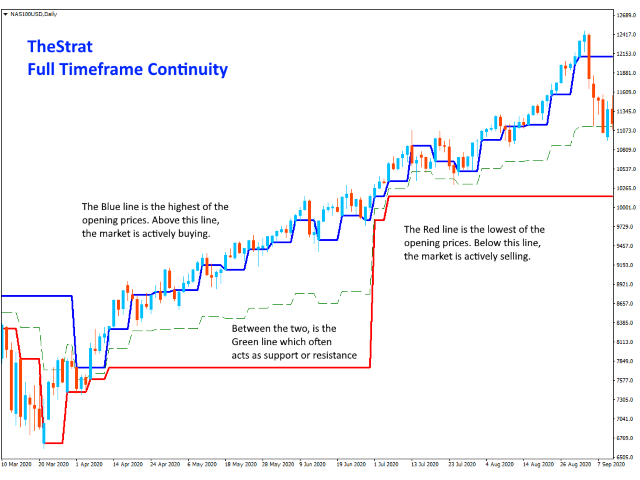
FTFC は、Rob Smith のThe Stratで定義されている Full Timeframe Continuity を指します。

このインジケーターはチャートに 2 本の線を引きます。四半期、月次、週次、日次、または時間次の開始レベルの最高値の 1 つと、これらの値の最低値の 2 つ目です。これにより、取引が一方向に非常に強くなる可能性が高いチャネルより上または下のチャネルが得られます。ライン間では、価格アクションが途切れ途切れになり、より広いストップを使用する必要がある場合があります.

高値と安値の中間点を示すために、3 番目の破線も描画されます。これは、市場が価格を特定の方向に押し上げようとするため、サポートまたはレジスタンスを見つけるのに適した場所です。色を NONE に設定して選択すると、この行をオフにすることができます。


設定

四半期ごとのレベルを含める

一部の人々はそれを無視することを好むため、四半期の始値を計算に含めることを選択できます。

IncludeCurrentTimeframeOpen

true の場合、現在表示されている時間枠が H1、D1、W1、または MN1 の場合、インジケーターはその期間が開いていることを計算に含めます。これは、インジケーターの最新バージョンの新しい設定です。以前は、計算には現在のオープン期間が含まれていませんでした。これは TheStrat と一致しません。

この設定はデフォルトで false であるため、既存のユーザーは有効にしない限り影響を受けません。

MaxMilliSecondsToCalculate

多くのヒストリーがロードされたチャート (10,000 バー以上) の場合、これによりインジケーターの初期化に必要な時間が制限されます。デフォルトでは、設定は 1500 ミリ秒 (1.5 秒) です。その期間の後にインディケータがヒストリカル バーのすべての計算を実行できなかった場合、試行を停止します。これは、常に重要な履歴を取得できることを意味しますが、チャートが停止することはありません。


おすすめのプロダクト
The Smooth Price technical indicator is used for plotting a smoothed line as close to the price of the financial instrument as possible, and serves to eliminate its noise components. The indicator is part of the Monarch trading system, but here it is presented as an independent technical analysis tool. The indicator is based on the cluster digital filter , which, unlike the ClusterSMA , is applied directly to the price time series. Smooth Price does not redraw (except the very last, zero bar) an
MSnR Lines
Pierre Paul Amoussou
MSnR Lines は、サポートとレジスタンスの水準をチャート上に表示するカスタムインジケーターです。これらの水準は、マレーシアのSNR理論に基づいています。この理論では、水準は特定の価格水準を指し、エリアではありません。これらの価格水準は、ラインチャートのピークと谷に基づいています。 特徴: A-Level、V-Level、ギャップレベルの3つの種類の水準。 水準の新鮮さインジケータ:新鮮な水準は、未テストの水準や取引された水準よりも重要です。 新鮮な水準と新鮮でない水準の色とスタイルをカスタマイズ可能。 新鮮な水準のみを表示するか、すべての水準を表示するかを選択できます。 バックテスト期間と現在の価格上下の水準の数を調整可能。 複数のタイムフレームをサポート。 用途: トレーダーは、MSnR Linesを使用して潜在的なサポートとレジスタンスの水準を識別し、取引の意思決定を行うことができます。新鮮な水準はより重要であり、より良い取引機会を提供する可能性があります。また、異なるタイムフレームの水準を使用してマルチタイムフレーム分析を行い、取引の精度と信頼性を向上させることがで
インディケータは現在のクオートを作成し、これを過去のものと比較して、これに基づいて価格変動予測を行います。インジケータには、目的の日付にすばやく移動するためのテキスト フィールドがあります。 オプション: シンボル - インジケーターが表示するシンボルの選択; SymbolPeriod - 指標がデータを取る期間の選択; IndicatorColor - インジケータの色; HorisontalShift - 指定されたバー数だけインディケータによって描画されたクオートのシフト; Inverse - true は引用符を逆にします。false - 元のビュー。 ChartVerticalShiftStep - チャートを垂直方向にシフトします (キーボードの上下矢印)。 次は日付を入力できるテキストフィールドの設定で、「Enter」を押すとすぐにジャンプできます。
A scalping indicator based on mathematical patterns, which on average gives signals with relatively small SL, and also occasionally helps to catch big moves in the markets (more information in the video) This indicator has three main types of notifications: The first type warns of a possible/upcoming signal on the next bar The second type indicates the presence of a ready signal to enter the market/open a position The third type is for SL and TP levels - you will be notified every time price r
MarketMagnet
Kelly Adediran Raymond
Are you ready to take your trading journey to new heights? Look no further than MarketMagnet, this groundbreaking indicator designed to propel your trading success with excitement and accuracy. Powered by the convergence of Momentum and CCI (Commodity Channel Index), MarketMagnet equips traders with the ultimate tool to determine direction and entry prices for a wide range of recommended currency pairs and instruments. It is designed for traders seeking to scalp for a few pips on lower timeframe
Limitless MT5 is a universal indicator suitable for every beginner and experienced trader. works on all currency pairs, cryptocurrencies, raw stocks Limitless MT5 - already configured and does not require additional configuration And now the main thing Why Limitless MT5? 1 complete lack of redrawing 2 two years of testing by the best specialists in trading 3 the accuracy of correct signals exceeds 80% 4 performed well in trading during news releases Trading rules 1 buy signa
Naked Forex Kangaroo Tail Indicator Kangaroo Tail Indicator is a pattern recognition indicator for Forex, Stocks, Indices, Futures, Commodities and Cryptos. The Kangaroo Tail is a multi-bar pattern. The Kangaroo Tail pattern is very effective and is very simple to trade. The strategy that comes with the Kangaroo Tail is based on price action. The indicator does what it was designed for: displaying Kangaroo Tail patterns.   Don't expect to follow the up and down arrows and make money . Tr
プレミアムレベルは、正しい予測の精度が80%を超える独自の指標です。 この指標は、最高のトレーディングスペシャリストによって2か月以上テストされています。 あなたが他のどこにも見つけられない作者の指標! スクリーンショットから、このツールの正確さを自分で確認できます。 1は、1キャンドルの有効期限を持つバイナリーオプションの取引に最適です。 2はすべての通貨ペア、株式、商品、暗号通貨で機能します 手順: 赤い矢印が表示されたらすぐにダウントレードを開き、青い矢印が表示されたら閉じます。青い矢印の後に開くこともできます。 試してテストしてください!推奨設定はデフォルトです! 日足チャートで最高の精度を示します! インディケータは、2600 Pipsの収益性に対して、約10Pipsという非常に小さなマージンを使用します。
This indicator uses support and resistance, volume and some special formula to calculate the volume to filter the candles. If the volume reaches a specific value, And at the same time, Candle breaks the support/resistance line, There would be a signal and we can enter the market. Signals appear when the current candle closes. then you can enter the trade when a new candle appears. Please don't forget to follow your money management plan. MT4 Version Support/Resistance Breakout MT4 :   https
Fibonacci retracement is a method of technical analysis for determining support and resistance levels. The TSO Fibonacci Chains Indicator is different from a simple Fibonacci Retracements indicator in that it provides the targets for each retracement level. In other words, there is an Extension Level (D) for every Retracement Level (C). In addition, if an Extension Level is reached, then a new Fibonacci setup is created automatically. These consecutive Fibonacci setups create a chain that reveal
トレンドキャッチャー: アラートインジケーター付きのトレンドキャッチャーストラテジーは、市場トレンドやポテンシャルなエントリーポイントやエグジットポイントを特定するのに役立つ多目的な技術分析ツールです。動的なトレンドキャッチャーストラテジーを備えており、市場状況に適応してトレンドの方向を明確に視覚化します。トレーダーは、自身の好みやリスク許容度に合わせてパラメーターをカスタマイズできます。このインジケーターはトレンドの識別を支援し、ポテンシャルなリバーサルをシグナルし、トレイリングストップのメカニズムとして機能し、市場への迅速な対応のためのリアルタイムアラートを提供します。 特徴: - トレンドの識別:上昇トレンドと下降トレンドをシグナルします。 - トレンドのリバーサル:ローソク足の色が上昇から下降に変わった場合やその逆の場合に、ポテンシャルなリバーサルを警告します。 - リアルタイムアラート:新しいトレンドの識別に対するアラートを生成します。 推奨事項: - 通貨ペア:EURUSD、AUDUSD、XAUUSDなど... - タイムフレーム:H1。 - アカウン
FREE
Create Unlimited Dashboards Each dashboard can be upto 28 Symbols x 24 Indicators. Mix and match from 31 leading indicators and all timeframes, to create unlimited unique dashboards. Create Group Alerts to be alerted when your chosen indicators are all aligned. 33 customizable trading strategy alerts (Trend, Breakout, Overbought, Oversold, Thresholds, Saucers etc). Scalper, Day or Long Term Trader?  Mega Dash has you covered, design your unique dashboard to suit your trading style. Mega Dash is
Win43 Scalper
Eadvisors Software Inc.
O novo s43 Scalper para Mini-Índice (WIN-IND) faz operações de curto prazo no timeframe 1min buscando pequenas variações do mercado, utiliza nova tecnologia de trade, os resultados no intraday são íncríveis, confira:      Após a instalação adicione no gráfico dos instrumentos win para visualizar os resultados no backteste. Recomendamos o timeframe de 1min.
Welcome to the world of SMC (Smart Money Concepts) Trading, where we empower traders with the tools and knowledge to make smarter trading decisions. Our latest addition to our suite of trading tools is the SMC Trading Pro indicator, version 1.0. Key Features: Major Market Structure Identification with BODY break. Order Block must be in Major Swing ( not Small Swing ). Order Block with Fair Value Gap Detection. Order Block in Discount | Premium zone. Filter for only Bullish, Bearish or All Order
Chart Sync MT5
Dragos Mihai Ofrim
5 (3)
# 33% off - limited time only # ChartSync Pro MT5 is an indicator, designed for the MetaTrader 5 trading terminals. It enables the trader to perform better multi-timeframe technical analysis, by synchronizing symbols and objects into virtually unlimited charts.  Built by traders for traders!   Telegram Premium Support - Dd you purchase the Chart Sync indicator and need a bit of help? Send us a screenshot with your purchase and your Telegram ID so we can add you to our premium support Telegram g
Hello I Want to introduce The Forex Buy Sell Arrow Premium MT5 i recently release this premium indicator! its 1000% Non Repaint Indicator, It Work Perfectly Well,, i tested it day by day, Just mind blowing Result,  Including Powerful trend Algorithm! How It Work? well, it work market trend formula, when trend Bullish Or when trend Bearish,  Recommend Timeframe M30, H1 it work all timeframe, and all currency pair, 100% non repaint, How to take signal From Forex Buy Sell Arr
まず第一に、この取引インジケーターは再描画されず、再描画されず、遅延しないことを強調する価値があります。これにより、手動取引とロボット取引の両方に理想的なものになります。 ユーザーマニュアル:設定、入力、戦略。 アトミックアナリストは、価格の強さとモメンタムを利用して市場でより良いエッジを見つけるためのPA価格アクションインジケーターです。ノイズや誤ったシグナルを除去し、取引ポテンシャルを高めるための高度なフィルターを備えています。複雑なインジケーターの複数のレイヤーを使用して、アトミックアナリストはチャートをスキャンし、複雑な数学的計算をシンプルなシグナルと色に変換します。これにより、どのような初心者トレーダーでも理解して使用し、一貫した取引の決定を行うことができます。 「アトミックアナリスト」は、新規および経験豊富なトレーダー向けにカスタマイズされた包括的な取引ソリューションです。プレミアムインジケーターとトップノッチの機能を1つの取引戦略に組み合わせ、すべてのタイプのトレーダーにとって汎用性のある選択肢にします。 デイリートレーディングとスキャルピング戦略:高速で正確な
Trend and Signals MT5  indicator scans  30 trading Instruments (Forex, Metals and Indices).     It uses special algorithm on the  current market   based on   Pure Price Action   and display the overall trend and signal on the dashboard. When signals are produced the indicator sends alert and notification. Strategy for Signals This indicator uses the daily timeframe to determine the direction of the trend. The hourly timeframe is used to identify possible entries. Main trend and is determined by
The SmartTrendMt5 trend indicator generates signals based on the principle of combined analysis of calculated reference points within the Keltner channel. The indicator plots the Keltner channel in a separate window (by default, red lines and a blue line - the middle of the channel), and also draws the histogram of calculated reference points for each candle (by default, the histogram bars are yellow). The should be attached to a chart of any timeframe and any trading symbol in the usual way.
Magnetic levels for MT5 is a great addition to your trading strategy if you use support and resistance levels, supply and demand zones. The price very often gives good entry points to the position exactly at the round levels and near them. The indicator is fully customizable and easy to use: -Choose the number of levels to be displayed -Choose the distance Between The levels -Choose the color of the levels. Can be added to your trading system for more confluence. Works very well when combin
Unlike many other indicators including the moving average indicator, Pivot Point can be a leading indicator. In these systems, the price levels of the previous period are used to determine the critical points instead of relying on the current price performance. Such an approach provides a clear framework for traders to plan their trades in the best possible way. You can use this method and its combination with the methods you want to build and use a powerful trading setup. MT4 version Let us k
Introducing the Power Trade Plus indicator designed by a small group of traders with a few years of experience trading the market profitably.  The Power Trade Plus is derived from the Power Trade indicator,  the indicator strive in powerful sniper entries and take profit levels,  with an algorithm that's can determine the markets volatility and Provides entries based on the current market volatility. This indicator is much more effective in stock ,currencies and indices.
The "No Reversal Accumatrix AI" is a cutting-edge MetaTrader 5 indicator designed to assist traders in confirming trends without the inconvenience of repainting. Built upon advanced artificial intelligence algorithms, this indicator offers a reliable tool for identifying and validating trends in financial markets. Key Features: Non-Repainting Technology : Unlike traditional indicators prone to repainting, the "No Reversal Accumatrix AI" utilizes innovative algorithms to provide accurate trend co
Gann 9+ Indicator Introduction The "Gann Matrix Chart" is the most simple and clear technical analysis in Gann theory, which is the calculation tool that Gann has always been committed to using. It is the essence of Gann's whole life. The Gann 9+ indicator uses the matrix chart to find the future high or low points of stocks or futures. Indicator Input: The base and step size can be set as 1 by default; When the multiple is -1, the multiple will be automatically obtained, or it can be filled in
Engulfing Candlestick Bulkowski The engulfing candlestick is a well-known candle pattern composed of two candles. This indicator for showing engulfing candlestick that describe by Thomas Bulkowski. If you need for MetaTrader 4 version, please visit here: https://www.mql5.com/en/market/product/34193 Feature Highlights Show bullish engulfing and bearish engulfing. Customizable "Up Symbol". Customizable "Down Symbol". Customizable symbol distance from candlestick. Customizable "Down Color". Cus
インジケーターは、可能な限り最小のラグで 再描画せず にチャートに高調波パターンを表示します。インディケータトップの検索は、価格分析の波動原理に基づいています。 詳細設定では、取引スタイルのパラメータを選択できます。ろうそく(バー)のオープニングで、新しいパターンが形成されると、価格変動の可能性のある方向の矢印が固定され、変更されません。 インジケーターは、次のパターンとその種類を認識します:ABCD、Gartley(Butterfly、Crab、Bat)、3Drives、5-0、Batman、SHS、One2One、Camel、Triangles、WXY、Fibo、Vibrations。デフォルトでは、ABCDとGartleyの数字のみが設定に表示されます。多くの追加の構成可能なパラメーター。 主なパラメータ: ShowUpDnArrows-予想される方向矢印を表示/非表示 ArrowUpCode-上矢印コード ArrowDnCode-下矢印コード Show old history patterns-古いパターンの表示を有効/無効にします Enable alert messages,
Fibonacci sequence is defined by integer sequence: 0, 1, 1, 2, 3, 5, 8, 13, 21, 34, 55, 89, 144, ... By definition, it starts from 0 and 1, the next number is calculated as a sum of two previous numbers. Instead of the standard moving average, the indicator uses the following calculation of average price: Bar0 + Bar1 + Bar2 + Bar3 + Bar5 + Bar8 + Bar13 + Bar21 + ... This indicator shows 2 moving Fibonacci lines and arrows when 2 these lines crossing each other. If an Aqua line is crossing a Yell
Trend change > Arrows (' Up ' and ' Down ') When the icon appears in the indicator buffer ('Up' or 'Down'), Alerts are triggered. You can use 200 EMA to reduce false signals. Enter trade when the arrow appears but wait until the candle closes Close trade when the line's color changes or use your own closing strategy. Works on all timeframes Works on all currencies Note works better with other indicators or an existing strategy
Fibonacci and RSI. Demo versión only works with GBPUSD. For full version, please, visit visit https://www.mql5.com/en/market/product/52101 The indicator is a combination of the Fibonacci and RSI indicators. Every time the price touches one of the fibonacci levels and the rsi condition is met, an audible alert and a text alert are generated. Parameters number_of_candles : It is the number of candles that will be calculated. If you put 100, the indicator will give you the maximum and min
FREE
How to use Pair Trading Station Pair Trading Station is recommended for H1 time frame and you can use it for any currency pairs. To generate buy and sell signal, follow few steps below to apply Pair Trading Station to your MetaTrader terminal. When you load Pair Trading Station on your chart, Pair Trading station will assess available historical data in your MetaTrader platforms for each currency pair. On your chart, the amount of historical data available will be displayed for each currency pai
このプロダクトを購入した人は以下も購入しています
まず第一に、このトレーディングシステムがノンリペイント、ノンリドロー、ノンラグのインジケーターであることを強調する価値がある。これにより、手動取引とロボット取引の両方に理想的なものになっています。 オンラインコース、マニュアル、プリセットのダウンロード。 「スマートトレンドトレーディングシステム MT5」は、新規および経験豊富なトレーダー向けにカスタマイズされた包括的なトレーディングソリューションです。10以上のプレミアムインジケーターを組み合わせ、7つ以上の堅実なトレーディング戦略を備えており、多様な市場状況に対応する多目的な選択肢となっています。 トレンドフォロー戦略:トレンドを効果的に乗り越えるための正確なエントリーとストップロス管理を提供します。 リバーサル戦略:潜在的なトレンドの反転を特定し、トレーダーがレンジ相場を活用できるようにします。 スキャルピング戦略:高速で正確なデイトレードおよび短期取引のために設計されています。 安定性:すべてのインジケーターはノンリペイント、ノンリドロー、ノンラグであり、信頼性の高いシグナルを保証します。 カスタマイズ:個々の取引の嗜好に合わせ
ご紹介   クォンタム トレンド スナイパー インジケーターは 、トレンド反転を特定して取引する方法を変革する画期的な MQL5 インジケーターです。 13年以上の取引経験を持つ経験豊富なトレーダーのチームによって開発されました。     クォンタムトレンドスナイパーインジケーター   は、非常に高い精度でトレンドの反転を識別する革新的な方法で、あなたのトレーディングの旅を新たな高みに押し上げるように設計されています。 ***Quantum Trend Sniper Indicatorを購入すると、Quantum Breakout Indicatorを無料で入手できます!*** クォンタム ブレイクアウト インジケーターは、トレンドの反転を特定するとアラートを発し、矢印を示し、3 つのテイクプロフィットレベルを提案します。 初心者トレーダーにもプロのトレーダーにも適しています。 量子EAチャネル:       ここをクリック MT4のバージョン:       ここをクリック 推奨事項: 期間:すべての時間枠。最良の結果を得るには、M
これはMT5のインジケーターで、再描画なしで取引に参入するための正確なシグナルを提供します。 外国為替、暗号通貨、金属、株式、インデックスなど、あらゆる金融資産に適用できます。かなり正確な見積もりを提供し、取引を開始して終了するのに最適な時期を教えてくれます。1つのシグナルを処理しただけでインジケーターの元が取れた例の 動画 (6:22)をご覧ください。Entry PointsPro インジケーターの助けを借りたほとんどのトレーダーの最初の1週間の結果が改善しています。 Telegramグループ に登録してください。Entry Points Proインジケーターのメリットは次の通りです。 再描画のないエントリーシグナル 再描画されるインジケーターでは一度表示されたシグナルが削除されて大きな金銭的損失につながることがありますが、これと異なり、表示されて確認されたシグナルは消えることがありません。 エラーなしの取引開始 インジケーターアルゴリズムによって取引を開始する(資産を売買する)理想的な瞬間を見つけることができます。それを使用するすべてのトレーダーの成功率が向上します。
The AT Forex Indicator MT5 is a sophisticated trading tool designed to provide traders with a comprehensive analysis of multiple currency pairs. This powerful indicator simplifies the complex nature of the forex market, making it accessible for both novice and experienced traders. AT Forex Indicator uses advanced algorithms to detect trends, patterns and is an essential tool for traders aiming to enhance their forex trading performance. With its robust features, ease of use, and reliable signal
Reversal First Impulse levels (RFI)      INSTRUCTIONS        RUS       -       ENG              R ecommended to use with an indicator   -   TPSpro  TREND PRO -  Version MT4                 A key element in trading is zones or levels from which decisions to buy or sell a trading instrument are made. Despite attempts by major players to conceal their presence in the market, they inevitably leave traces. Our task was to learn how to identify these traces and interpret them correctly. Main functi
mql5と Telegramの モーニング・ブリーフィングで、詳細とスクリーンショットを含む毎日のマーケット・アップデートをご覧 ください! FX Power MT5 NGは 、長年の人気を誇る通貨強度計FX Powerの次世代モデルです。 この次世代ストレングスメーターは何を提供するのでしょうか?初代FXパワーの魅力すべて プラス GOLD/XAUの強さ分析 より正確な計算結果 個別に設定可能な分析期間 カスタマイズ可能な計算上限値により、さらに優れたパフォーマンスを実現 もっと見たい人のための特別なマルチインスタンス設定 すべてのチャートでお好みの色を無限に設定可能 数え切れないほどの通知オプションにより、重要なことを見逃すことはありません。 Windows 11とmacOSのスタイルで角を丸くした新しいデザイン 魔法のように動くインジケーターパネル FXパワーの主な機能 すべての主要通貨の強さの完全な履歴 すべての時間枠における通貨の強さの履歴 すべてのブローカーとチャートで同一の計算結果 100%信頼できるリアルタイム計算 -> リペイントなし ドロップダウン・リストから
FX Volume MT5
Daniel Stein
4.94 (17)
mql5と Telegramの モーニング・ブリーフィングで、詳細とスクリーンショットを含む毎日のマーケット・アップデートをご覧 ください! FX Volumeは、ブローカーの視点から市場のセンチメントをリアルに洞察する、最初で唯一の出来高インジケーターです。 ブローカーのような機関投資家が外国為替市場でどのようなポジションをとっているか、COTレポートよりもはるかに速く、素晴らしい洞察を提供します。 この情報をチャート上で直接見ることは、あなたの取引にとって真のゲームチェンジャーであり、画期的なソリューションです。 以下のようなユニークなマーケットデータ洞察から利益を得てください。 比率は 、通貨のロングポジションとショートポジションの比率をパーセントで表示します。 比率の変化は 、選択した期間内のロング比率とその変化率を表示します。 Volumes Totalは 、通貨の取引量(ロングとショート)の合計をロット単位で表示します。 Volumes Long :全通貨のロングポジションの取引量を表示します。 Volumes(ショート )は、全通貨のショートポジションの取引量を表示
TPSpro TRENDPRO  - is a trend indicator that automatically analyzes the market and provides information about the trend and each of its changes, as well as giving signals for entering trades without redrawing! The indicator uses each candle, analyzing them separately. referring to different impulses - up or down impulse. Exact entry points into transactions for currencies, crypto, metals, stocks, indices!  -  Version MT4               DETAILED DESCRIPTION               R ecommended to use with
Step into the realm of Forex trading with confidence and precision using XQ, a cutting-edge Forex indicator designed to elevate your trading game to unprecedented heights. Whether you're a seasoned trader or just stepping into the world of currency exchange, XQ Forex Indicator empowers you with the insights and signals needed to make informed trading decisions. The signal conditions are a combination of three indicators, and XQ Forex Indicator only display  medium and long-term trends . The ind
まず第一に、この取引ツールはノンリペイント、ノンリドロー、ノンラグの指標であり、プロの取引に理想的ですことを強調する価値があります。 オンラインコース、ユーザーマニュアル、デモ。 スマートプライスアクションコンセプトインジケーターは、新米から経験豊富なトレーダーまで、非常 に強力なツールです。Inner Circle Trader AnalysisやSmart Money Concepts Trading Strategiesなど、20以上の有用な指標を1つに組み合わせています。このインジケーターはスマートマネーコンセプトに焦点を当て、大手機関の取引方法を提供し、彼らの動きを予測するのに役立ちます。 特に、流動性分析に優れており、機関がどのように取引しているかを理解しやすくしています。市場のトレンドを予測し、価格の動きを慎重に分析するのに優れています。機関の戦略とトレードを合わせることで、市場の動向についてより正確な予測ができます。このインジケーターは多目的であり、市場構造を分析し、重要な注文ブロックを特定し、さまざまなパターンを認識するのに優れています。 このインジ
ご紹介     Quantum Breakout PRO は 、ブレイクアウト ゾーンの取引方法を変革する画期的な MQL5 インジケーターです。 13年以上の取引経験を持つ経験豊富なトレーダーのチームによって開発されました。     クォンタム ブレイクアウト プロ   は、革新的でダイナミックなブレイクアウト ゾーン戦略により、あなたのトレーディングの旅を新たな高みに押し上げるように設計されています。 クォンタム ブレイクアウト インジケーターは、5 つの利益ターゲット ゾーンを備えたブレイクアウト ゾーン上のシグナル矢印と、ブレイクアウト ボックスに基づいたストップロスの提案を提供します。 初心者トレーダーにもプロのトレーダーにも適しています。 量子EAチャネル:       ここをクリック 重要!購入後、インストールマニュアルを受け取るためにプライベートメッセージを送ってください。 推奨事項: 時間枠: M15 通貨ペア: GBPJPY、EURJPY、USDJPY、NZDUSD、XAUUSD アカウントの種類: ECN、Raw、またはス
TPA True Price Action indicator reveals the true price action of the market makers through 100% non-repainting signals strictly at the close of a candle! TPA shows entries and re-entries, every time the bulls are definitely stronger than the bears and vice versa. Not to confuse with red/green candles. The shift of power gets confirmed at the earliest stage and is ONE exit strategy of several. There are available now two free parts of the TPA User Guide for our customers. The first "The Basics"
現在33%オフ 初心者にもエキスパートトレーダーにも最適なソリューション このインジケーターは独自の機能と新しい公式を多数内蔵しており、ユニークで高品質かつ手頃な取引ツールです。このアップデートでは、2つの時間枠ゾーンを表示できるようになります。より長いTFだけでなく、チャートTFとより長いTF(ネストゾーンを表示)の両方を表示できます。すべてのSupply Demandトレーダーの皆さんのお気に召すはずです。:) 重要情報の公開 Advanced Supply Demandの可能性を最大化するには、 https://www.mql5.com/ja/blogs/post/720245 にアクセスしてください。   エントリーまたはターゲットの正確なトリガーポイントを正確に特定できれば取引がどのように改善されるか想像してみてください。新しい基盤となるアルゴリズムに基づいて構築されているため、買い手と売り手の間の潜在的な不均衡をさらに簡単に特定できます。これは、最も強い需要と供給のゾーンと、過去のパフォーマンス(古いゾーンを表示)がグラフィカルに表現されるためです。これらの機能は、最適
Was: $249  Now: $99   Market Profile defines a number of day types that can help the trader to determine market behaviour. A key feature is the Value Area, representing the range of price action where 70% of trading took place. Understanding the Value Area can give traders valuable insight into market direction and establish the higher odds trade. It is an excellent addition to any system you may be using. Inspired by Jim Dalton’s book “Mind Over Markets”, this indicator is designed to suit the
ICT, SMC, SMART MONEY CONCEPTS, SMART MONEY, Smart Money Concept, Support and Resistance, Trend Analysis, Price Action, Market Structure, Order Blocks, BOS/CHoCH,   Breaker Blocks ,  Momentum Shift,   Supply&Demand Zone/Order Blocks , Strong Imbalance,   HH/LL/HL/LH,    Fair Value Gap, FVG,  Premium  &   Discount   Zones, Fibonacci Retracement, OTE, Buy Side Liquidity, Sell Side Liquidity, BSL/SSL Taken, Equal Highs & Lows, MTF Dashboard, Multiple Time Frame, BigBar, HTF OB, HTF Market Structure
Matrix Arrow Indicator MT5
Juvenille Emperor Limited
5 (14)
マトリックスアローインジケーターMT5は、すべてのシンボル/商品(外国為替、商品、暗号通貨、インデックス、株式)で使用できる100%再描画されていないマルチタイムフレームインジケーターに続くユニークな10in1トレンドです。マトリックスアローインジケーターMT5は、初期段階で現在のトレンドを判断し、最大10の標準インジケーターから情報とデータを収集します。 平均方向移動指数(ADX) 商品チャネルインデックス(CCI) クラシック平研アシキャンドル 移動平均 移動平均収束発散(MACD) 相対活力指数(RVI) 相対力指数(RSI) 放物線SAR ストキャスティクス ウィリアムズのパーセント範囲 すべてのインジケーターが有効な買いまたは売りシグナルを与えると、対応する矢印がチャートに印刷され、次のろうそく/バーの開始時に強い上昇トレンド/下降トレンドを示します。ユーザーは、使用するインジケーターを選択し、各インジケーターのパラメーターを個別に調整できます。マトリックスアローインジケーターMT5は選択されたインディケーターからのみ情報を収集し、それらのデータのみに基づいてアローを印
Was: $299  Now: $99   Supply Demand uses previous price action to identify potential imbalances between buyers and sellers. The key is to identify the better odds zones, not just the untouched ones. Blahtech Supply Demand indicator delivers functionality previously unavailable on any trading platform. This 4-in-1 indicator not only highlights the higher probability zones using a multi-criteria strength engine, but also combines it with multi-timeframe trend analysis, previously confirmed swings
Quantum平均足PRO のご紹介 市場のトレンドに対する明確な洞察を提供するように設計された平均足キャンドルは、ノイズを除去し、誤ったシグナルを排除する能力で知られています。混乱を招く価格変動に別れを告げ、よりスムーズで信頼性の高いチャート表現を導入しましょう。 Quantum Heiken Ashi PRO を真にユニークなものにしているのは、従来のローソク足データを読みやすい色のバーに変換する革新的なフォーミュラです。赤と緑のバーはそれぞれ弱気トレンドと強気トレンドをエレガントに強調し、潜在的なエントリーポイントとエグジットポイントを驚くほど正確に見つけることができます。 量子EAチャネル:       ここをクリック MT4のバージョン:       ここをクリック この注目すべき指標には、いくつかの重要な利点があります。 明確性の向上: 価格変動を平滑化することで、平均足バーは市場トレンドをより明確に表現し、有利な取引機会を特定しやすくします。 ノイズの削減: 誤ったシグナルを引き起こすことが多い不安定な価格変動に別れを告げます。 Quantum Heik
Gartley Hunter Multi - An indicator for searching for harmonic patterns simultaneously on dozens of trading instruments and on all possible timeframes. Manual (Be sure to read before purchasing) | Version for MT4 Advantages 1. Patterns: Gartley, Butterfly, Shark, Crab. Bat, Alternate Bat, Deep Crab, Cypher 2. Simultaneous search for patterns on dozens of trading instruments and on all possible timeframes 3. Search for patterns of all possible sizes. From the smallest to the largest 4. A
Auto Order Block with break of structure based on ICT and Smart Money Concepts (SMC) Futures Break of Structure ( BoS )             Order block ( OB )            Higher time frame Order block / Point of Interest ( POI )    shown on current chart           Fair value Gap ( FVG ) / Imbalance   -  MTF      ( Multi Time Frame )    HH/LL/HL/LH  -  MTF      ( Multi Time Frame )  Choch  MTF      ( Multi Time Frame )  Volume Imbalance     ,  MTF          vIMB Gap’s Power of 3 Equal High
プレシジョン・インデックス・オシレーター(Pi-Osc)は、Precision Trading SystemsのRoger Medcalfによるものです。 バージョン2は、チャートにスーパーファストでロードされるように注意深く再コードされ、その他の技術的な改良も組み込まれて、エクスペリエンスを向上させています。 Pi-Oscは、市場が強制的に行かなければならない、すべての人のストップを取り除くためのポイントである、極限のエクソースト・ポイントを見つけるために設計された正確な取引タイミング信号を提供するために作成されました。 この製品は、極限のポイントがどこにあるかを知るという古代の問題を解決し、トレーダーの生活をはるかにシンプルにします。 これは、業界標準のオシレーターとは異なる強力な要素を持つ高度なコンセンサス・インジケーターです。 使用されている一部の機能には、需要指数、マネーフロー、RSI、スティリング、パターン認識、出来高分析、標準偏差の極値などがあり、異なる長さでこれらのバリエーションが多く含まれています。 初めて見ると、訓練されていない目には、他の
The indicator very accurately determines the levels of the possible end of the trend and profit fixing. The method of determining levels is based on the ideas of W.D.Gann, using an algorithm developed by his follower Kirill Borovsky. Extremely high reliability of reaching levels (according to K. Borovsky  - 80-90%) Indispensable for any trading strategy – every trader needs to determine the exit point from the market! Precisely determines targets on any timeframes and any instruments (forex, met
Bill Williams Advanced is designed for automatic chart analysis using Bill Williams' "Profitunity" system. The indicator analyzes four timeframes at once. Manual (Be sure to read before purchasing) Advantages 1. Automatically analyzes the chart using the "Profitunity" system of Bill Williams. The found signals are placed in a table in the corner of the screen. 2. Equipped with a trend filter based on the Alligator indicator. Most of the system signals are recommended to be used only accordi
Currently Price  20% OFF  ( for unlimited use ) Indicator   USER MANUAL , trade setups, solving issues, etc :  Direct Download Here     (  for users only  ) Hello World! Introducing.. SMCpro tool and Indicator for  MetaTrader 5 , a cutting-edge feature designed to revolutionize your trading experience. With innovative ICT Smart Money Concept, you gain unparalleled insight into market dynamics, empowering you to make informed trading decisions like never before. SMC Indicator built on th
AW Trend Predictor MT5
AW Trading Software Limited
4.78 (58)
1 つのシステムでのトレンド レベルとブレイクダウン レベルの組み合わせ。高度なインジケーター アルゴリズムは、市場のノイズをフィルター処理し、トレンド、エントリー ポイント、および可能なエグジット レベルを決定します。インジケーターシグナルは統計モジュールに記録されるため、最適なツールを選択してシグナル履歴の有効性を示すことができます。この指標は、テイクプロフィットとストップロスのマークを計算します。 マニュアルと説明書 ->   ここ / MT4 バージョン ->   ここ インジケーターで取引する方法: Trend Predictor での取引は、たった 3 つの簡単なステップです。 ステップ 1 - ポジションを開く 70% 以上の成功率で買いシグナルが受信されました ステップ 2 - ストップロスの決定 逆信号でトランクを選択 ステップ 3 - テイクプロフィット戦略の定義 戦略 1: TP1 に到達したらポジション全体をクローズする 戦略 2: TP1 に達した時点でポジションの 50% をクローズし、TP2 に達した時点で残りの 50% をクローズします。 戦略 3:
MT4版  |  FAQ Owl Smart Levels Indicator は、 Bill Williams の高度なフラクタル、市場の正しい波構造を構築する Valable ZigZag、エントリの正確なレベルをマークする Fibonacci レベルなどの一般的な市場分析ツールを含む 1 つのインジケーター内の完全な取引システムです。 利益を得るために市場と場所に。 戦略の詳細な説明 インジケータを操作するための指示 顧問-取引助手 プライベートユーザーチャット ->購入後に私に書いて、私はプライベートチャットにあなたを追加し、あなたはそこにすべてのボーナスをダウンロードすることができます 力はシンプルさにあります! Owl Smart Levels 取引システムは非常に使いやすいので、専門家にも、市場を勉強し始めて自分で取引戦略を選択し始めたばかりの人にも適しています。 戦略と指標に秘密の数式や計算方法が隠されているわけではなく、すべての戦略指標は公開されています。 Owl Smart Levels を使用すると、取引を開始するためのシグナルをすばやく確認し、注文を出すため
これはほぼ間違いなく、MetaTraderプラットフォームで見つけることができる最も完全な調和価格形成自動認識インジケーターです。 19種類のパターンを検出し、フィボナッチプロジェクションをあなたと同じように真剣に受け止め、潜在的逆転ゾーン(PRZ)を表示し、適切なストップロスとテイクプロフィットレベルを見つけます。 [ インストールガイド | 更新ガイド | トラブルシューティング | よくある質問 | すべての製品 ] 19の異なる調和価格形成を検出します プライマリ、派生および補完フィボナッチ投影(PRZ)をプロットします 過去の価格行動を評価し、過去のすべてのパターンを表示します この指標は、独自の品質とパフォーマンスを分析します 適切なストップロスとテイクプロフィットのレベルを表示します ブレイクアウトを使用して適切な取引を通知します すべてのパターン比をグラフにプロットします 電子メール/音声/視覚アラートを実装します スコット・M・カーニーの本に着想を得て、この指標は最も純粋で急を要するトレーダーのニーズを満たすように設計されています。ただし、トレードを
トレンドに乗りましょう。 はい、買いでも売りでもエントリーシグナルを待ち、価格でエントリーし、描画ラインが変化したとき、利益が確定したとき、または反対のシグナルが現れたときに利益を確定します。非常にシンプルで、すべてに機能します。通貨、金属、指数、そしてすべてのフレームに。   入力方法は? 買いまたは売りのシグナルを待ち、描画ラインに変化が現れた後、または反対のシグナルが現れたら、利益を確定または留保することができます。トレンドに乗りましょう。 はい、買いでも売りでもエントリーシグナルを待ち、価格でエントリーし、描画ラインが変化したとき、利益が確定したとき、または反対のシグナルが現れたときに利益を確定します。非常にシンプルで、すべてに機能します。通貨、金属、指数、そしてすべてのフレームに。   入力方法は? 買いまたは売りのシグナルを待ち、描画ラインに変化が現れた後、または反対のシグナルが現れたら、利益を確定または留保することができます。
IVISTscalp5
Vadym Zhukovskyi
5 (5)
iVISTscalp5インジケーターをご紹介します。このインジケーターは、トレーディングにおいて独自でありながら効果的です。時間データに基づくこのインジケーターは、多年にわたる経験と金融市場の深い分析の結果です。iVISTscalp5インジケーターは、手動トレーディングにとって優れたツールです。便利さ、簡単さ、可視化 - すべての複雑さが内部に隠されています。私たちは、iVISTscalp5インジケーターの設定と使用を最大限に簡素化しました。このインジケーターは、MT5ターミナルにあるすべての金融商品に適しています。 稼働時間は、4時から20時(UTC+3)です。 iVISTscalp5インジケーターメニュー(スクリーンショット1を参照): History - 引用を計算する週数 dT_min - 時間間隔の選択(分) TFline - 水平ボリュームの作成(時間枠) BARSline - 水平ボリュームの作成(バー数) TFtrend1 - デイリーチャンネルの作成(時間枠) BARStrend1 - デイリーチャンネルの作成(バー数) TFtrend2 - 週次チャンネルの作成(時
The Volumebyprice.com Indicator for MetaTrader 5 features Volume Profile and Market Profile TPO (Time Price Opportunity). Volume and TPO histogram bar and line charts. Volume Footprint charts. TPO letter and block marker collapsed and split structure charts. Static, dynamic and flexible range segmentation and compositing methods with relative and absolute visualizations. Session hours filtering and segment concatenation with Market Watch and custom user specifications. Graphical layering, posit
作者のその他のプロダクト
このインジケーターは、さまざまなタイムスケールでの多くのチャートのレビューをより迅速かつ簡単に行えるように設計されています。 複数のチャートで時間と価格を追跡 1 つのチャートでシンボルを変更すると、同じシンボルの他のすべてのチャートも変更されます。 使いやすく、すぐにマスターできます このインジケーターを使用すると、同じシンボルで開いている他のすべてのチャートで、マウス ポインターが現在のチャートにある価格と時間を特定できます。これにより、複数のチャートで情報をすばやく確認できますが、通常は同じ場所を特定するのに時間がかかります。 開いているすべてのチャートで時間だけを追跡することもできます。これにより、発散ハンティング時に簡単にナビゲートできます。 1 つのチャートでシンボルを変更すると、同じシンボルの他のすべてのチャートが新しいシンボルに切り替わり、時間枠の設定が維持されます。 使い方 チャートを確認するとき、傾向と取引レベルを特定するために、いくつかの時間枠を見るのが好きです。このツールを作成したのは、それを支援するためであり、長期にわたっていくつかのチャートを見渡すビジュア
This indicator will draw patterns based on   Rob Smith's   The Strat   as they emerge in real time on your chart. As price evolves,   TheStrat   offers 18 distinct price action patterns that can help you get good entries in the market. Each pattern involves two or three candles, and this indicator will draw a bounding box around the candles and name the pattern. The indicator also shows when a potential setup is forming, known by stratters as an Actionable signal. Candles Each candle is de
This indicator is designed to make reviews of many charts on different timescales quicker, and easier to do. Track Time and Price across multiple charts Change Symbol on one chart and all other charts of the same symbol will be changed too. Easy to use, quick to master The indicator allows you to identify the price and time where the mouse pointer is on the current chart, across all other charts open on the same Symbol. This allows you to quickly see information on multiple charts whereas normal
範囲の枯渇は、価格が現在の期間の予想される範囲を満たすか超えると発生します。これらのレベルでは、価格は期間の初期に比べて勢いを失い始めるため、新しいポジションをとっていないことを確認するのに良いポイントです. このインジケーターは、チャート上でこれが発生する可能性が高い場所を示し、日次、週次、月次の期間のレベルを示します。 価格がこれらの枯渇レベルを超えている場合は、動きの背後にある勢いが非常に強く、より高い時間枠レベルに向かっている可能性が高いことを示しています. インジケーターは、好みに応じて、Average True Range (ATR) または Average Range (ADR) 計算を使用できます。デフォルトでは、外国為替チャートでよりうまく機能することがわかっているため、ATR を使用しますが、ADR は株式ベースのインデックスとシンボルで優位に立っています。 インジケーターには、以下で説明するいくつかの描画モードがあり、ニーズに合わせて調整できます。 設定 計算モード レベルの計算には、AverageTrueRange (ATR) または AverageDai
ピボット レベルは、すべての市場で認められている確立された技術レベルです。 このインジケーターは、任意のシンボルについて、現在の四半期ごと、月ごと、週ごと、日ごと、および 4 時間ごとのピボットをチャートに描画します。また、各期間のサポート レベルとレジスタンス レベルを表示し、レベル 1 ~ 4 から表示するものを選択することもできます。     次の中からピボットのタイプを選択します。 標準 カマリリャ デマーク ウッディ フィボナッチ 元の仕様に従って、DeMark ピボットには単一のサポート レベルとレジスタンス レベルがあることに注意してください。 インジケーター ウォールは、ラインが価格に触れた場合、ラインの描画方法を変更します。これは非常に役立ち、ラインのサポートまたは抵抗の強さは、一度触れると大幅に減少します. 期間ごとに、予測されたピボット レベルを表示するように選択できます。これは通常のピボットと同じ計算を使用しますが、現在不完全な時間枠で機能します。そのため、価格がその範囲の大部分をすでにカバーしている、その期間の終わりに向かって使用するのが最適です。 設定
このスクリプトを使用すると、トレンド ライン、フィボナッチ リトレースメントなど、あらゆる種類の描画オブジェクトを 1 つ以上の他のチャートにコピーできます。 デフォルトでは、スクリプトは現在のチャート (スクリプトが適用されたチャート) のすべてのオブジェクトを、現在ロードされている同じシンボルの他のチャートにコピーします。 設定 目的地の時間枠 PERIOD_CURRENT 以外に設定すると、スクリプトが適用されたチャートと同じシンボルの開いているチャートにオブジェクトがコピーされます。 値を特定の時間枠、たとえば PERIOD_D1 に設定すると、同じ銘柄と期間のチャートのみが更新されます。 CopyObjectsOfType これをコピーしたい特定のタイプのオブジェクトに設定すると、そのタイプのオブジェクトのみが他のチャートにコピーされます。 CopyIndicatorWindowObjects True に設定すると、インジケータ ウィンドウのオブジェクトもコピーされます。これは、ソース チャートと同じ指標を同じ順序で持つ 2 番目のチャートに依存します。
FREE
The Strat を使用して取引する場合、複数の時間枠に注意することが重要です。 このインジケーターは、各時間枠の現在のローソク足の毎日、毎週、毎月、および四半期ごとの状態を示します。 円のアイコンは、その時間枠のろうそくが現在インサイド、または TheStrat 用語でタイプ 1 であることを示します。 Inside Day ローソク足が値動きを強化しており、レンジのブレイクアウトを探しています。 上向きまたは下向きの三角形のアイコンは、トレンド キャンドル、または TheStrat 用語ではタイプ 2 です。トレンドろうそくは強気または弱気のいずれかであり、以前のろうそくの範囲を突破し、現在一方向にトレンドになっていることを示します. 正方形のアイコンはアウトサイド キャンドル、またはストラト用語でタイプ 3 です。これは 2 つのことを示しています。1 つはその時間枠での方向性について価格が未定であり、おそらく非常に途切れ途切れであるということです。もう 1 つは、より短い時間枠では短い反転取引を行う良い機会がある可能性が高いということです。正方形は強気または弱気の色になり、ど
A simple script that can delete all the drawing objects on a chart, or just the objects of a specific type. Settings: DeleteObjectsOfType By default the value will be blank which means ALL drawing objects on the chart will be deleted. If you only wish to delete specific types of drawing object, change this setting to the type of object to delete. For example, Fibonacci Retracement, Text, Label or Trend Line. Please see the demonstration video for more information.
FREE
Rob Smith の TheStrat について学んでいるときにこの単純なインジケーターを作成しましたが、とても役立つと思いました。共有したいと思います。役に立つと思われる場合は、私が MQL5 で公開した他の指標を見てください。 このインジケーターは、より高い時間枠から選択した価格レベルを示す単一の線をチャートに描画するだけです。 設定を使用すると、表示される時間枠を完全に制御できますが、デフォルトでは 、スケールを 1 ステップ上げるだけで、より高い時間枠自体が計算されます。たとえば、H1 チャートを開くと、H4 チャートのデータが表示されます。 設定 トラックタイムフレーム 価格レベルが引き出される時間枠を選択します。現在のデフォルト設定のままにしておくと、適切な時間枠が選択されます。線は常に上向きに調整されるため、チャートを確認して時間枠を変更する場合、これは非常に役立ちます。 トラックバリュー 下記の標準価格からお選びいただけます。デフォルトは始値です。 PRICE_CLOSE 終値 PRICE_OPEN 始値 PRICE_HIGH 期間中の最高価格 PRICE_LO
FREE
This script allows you to toggle the "Show Trade Levels" option, but for the current chart only. Normally, you can only change the setting using the Options -> Chart menu for ALL charts, but this script allows you to do it for a SINGLE chart. I'm using it when I take screenshots, because most of the time I'm not trying to show the trades, just some functionality of one of my other tools. Iif you need that functionality, then this script is very helpful! If the script helps you, please let me
FREE
This indicator will draw patterns based on Rob Smith's The Strat as they emerge in real time on your chart. As price evolves, TheStrat offers 18 distinct price action patterns that can help you get good entries in the market. Each pattern involves two or three candles, and this indicator will draw a bounding box around the candles and name the pattern. The indicator also shows when a potential setup is forming, known by stratters as an Actionable signal. Candles Each candle is defined by i
This indicator draws the prior Highs and Lows for multiple timeframes, and can display potential Take Profit and Stop Loss levels. In Rob Smith's # The Strat   terms,   these are potential entry points, or alternatively potential targets for open positions. I like to use them in both ways. On a lower timeframe, say 5 minutes to get a good entry on a daily or weekly level, and then as a potential target. Very small stops required giving an excellent risk/reward ratio. Please watch the DEMO video
TheStrat Candles
Robert Gerald Wood
4.5 (2)
この指標は、以下に基づいて各ろうそくの上または下にラベルを描画します。     ロブ・スミス     ストラト   それらがチャート上で時間の経過とともに発展するにつれて。 価格が変化するにつれて、ろうそくは 3 つの状態を切り替えることができます。ローソク足が最初に開いたとき、それが前のローソク足の高値と安値の中に完全に収まっている場合、タイプ 1 として開始されます。タイプ 2 であり、値動きが不安定で方向性がない場合、前のローソク足の反対側を壊してタイプ 3 になる可能性があります。 キャンドル 各キャンドルは、前のキャンドルとの関係によって定義されます。 タイプ 1 - ろうそくの内側 - ろうそくは完全に前のろうそくの高値と安値の範囲内にあります。ろうそくの内側は、市場が優柔不断であることを示しています。 タイプ 2 - トレンド ローソク足 - ローソク足は、前のローソク足の高値または安値のいずれかの上または下に伸びますが、両方ではありません。 タイプ 3 - ろうそくの外側 - ろうそくは前のろうそくの高値と安値の両方を破っています。外側のローソク
FTFC は、Rob Smith の The Strat で定義されている Full Timeframe Continuity を指します。 このインジケーターはチャートに 2 本の線を引きます。四半期、月次、週次、日次、または時間次の開始レベルの最高値の 1 つと、これらの値の最低値の 2 つ目です。これにより、取引が一方向に非常に強くなる可能性が高いチャネルより上または下のチャネルが得られます。ライン間では、価格アクションが途切れ途切れになり、より広いストップを使用する必要がある場合があります. 高値と安値の中間点を示すために、3 番目の破線も描画されます。これは、市場が価格を特定の方向に押し上げようとするため、サポートまたはレジスタンスを見つけるのに適した場所です。色を NONE に設定して選択すると、この行をオフにすることができます。 設定 四半期ごとのレベルを含める 一部の人々はそれを無視することを好むため、四半期の始値を計算に含めることを選択できます。 IncludeCurrentTimeframeOpen true の場合、現在表示されている時間枠が H1、D1、W1
市場はラウンド数を非常に好み、下落市場ではサポートとして機能し、価格が上昇するとレジスタンスとして機能することがよくあります。 この指標は、ラウンド値で価格レベルを描画するように設計されています。これは自動的に行われますが、それをオーバーライドして表示するレベルを決定するオプションもあります。 ラウンド レベルは、10、20、30 などの 10 のステップと同じくらい単純にすることができます。また、外国為替を使用している場合は、0.1 または 0.01 での変化を見たいと思うかもしれません。 インジケーターは、メジャーとマイナーの 2 つのクラスの線をそれぞれ異なる形式で描画します。これにより、レベルの 2 つの異なる変化の間の変化を同時に見ることができます。 アラート このインジケーターには、価格が設定可能な距離内にある場合に、メジャー、マイナー、または両方の価格レベルでアラートを鳴らす機能が含まれています。 自動セットアップ デフォルトでは、指標はメジャー価格とマイナー価格の両方の適切なレベルを決定します。これは、いつでも画面に表示する行数を制御する構成可能な Densi
TheStrat Monitor
Robert Gerald Wood
3 (2)
If you've not already learnt about The Strat trading strategy , go google it now. I promise it won't be a waste of your time, and you will likely learn some new tricks whether you use it or not. OK, so now you know what TheStrat is, you will be able to understand what this indicator can do for you. Key Features In short, the Indicator will: Show Timeframe Continuity for all supported timeframes Supports two timeset views, Day trader and Swing trader Show when Full Timeframe Continuity is in pl
The Strat を使用して取引する場合、複数の時間枠に注意することが重要です。 このインジケーターは、各時間枠の現在のローソク足の毎日、毎週、毎月、および四半期ごとの状態を示します。 円のアイコンは、その時間枠のろうそくが現在インサイド、または TheStrat 用語でタイプ 1 であることを示します。 Inside Day ローソク足が値動きを強化しており、レンジのブレイクアウトを探しています。 上向きまたは下向きの三角形のアイコンは、トレンド キャンドル、または TheStrat 用語ではタイプ 2 です。トレンドろうそくは強気または弱気のいずれかであり、以前のろうそくの範囲を突破し、現在一方向にトレンドになっていることを示します. 正方形のアイコンはアウトサイド キャンドル、またはストラト用語でタイプ 3 です。これは 2 つのことを示しています。1 つはその時間枠での方向性について価格が未定であり、おそらく非常に途切れ途切れであるということです。もう 1 つは、より短い時間枠では短い反転取引を行う良い機会がある可能性が高いということです。正方形は強気または弱気の色になり、ど
平均真の範囲(ATR)は、設定された期間における価格の変動量を測定するために一般的に使用される指標です。しかし、それが与える値はいかなる種類の境界内でも定義されていないため、ストップロスや利益計算以外の目的で使用することはほとんど不可能です。 このインジケーターは標準のATRインジケーターですが、極端な値を確認できるようにパーセンタイル境界を導入しています。 パーセンタイルとスプリットメディアンと呼ばれるものから選択できます パーセンタイルレベル パーセンタイルレベルは1%、5%、20%、50%、80%、95%、99%で描画され、これらは価格が他のすべての値との関係である場所を示しています。たとえば、5%レベルは、境界線より下では、ATR読み取り値の5%のみが低くなり、99%は、そのレベルより上のATR値のうち、値の1%のみが高くなることを示します。 80%を超えると、新しい取引のためにポジションサイズを小さくすることを選択できます。また、95%を超えると、勢いが変わる前に利益を得る良い機会になる可能性があります。 分割中央値 Split Medians設
範囲の枯渇は、価格が現在の期間の予想される範囲を満たすか超えると発生します。これらのレベルでは、価格は期間の初期に比べて勢いを失い始めるため、新しいポジションをとっていないことを確認するのに良いポイントです. このインジケーターは、チャート上でこれが発生する可能性が高い場所を示し、日次、週次、月次の期間のレベルを示します。 価格がこれらの枯渇レベルを超えている場合は、動きの背後にある勢いが非常に強く、より高い時間枠レベルに向かっている可能性が高いことを示しています. インジケーターは、好みに応じて、Average True Range (ATR) または Average Range (ADR) 計算を使用できます。デフォルトでは、外国為替チャートでよりうまく機能することがわかっているため、ATR を使用しますが、ADR は株式ベースのインデックスとシンボルで優位に立っています。 インジケーターには、以下で説明するいくつかの描画モードがあり、ニーズに合わせて調整できます。 設定 計算モード レベルの計算には、AverageTrueRange (ATR) または AverageDai
This indicator will draw a label above or below each candle based on   Rob Smith's   The Strat   as they develop over time on your chart. As price evolves, a candle can switch between three states. When the candle first opens, if it sits completely within the previous candles high and low, then it will start as a Type 1. As time moves on, if it breaks either the high or low of the previous candle, it will be come a type 2, and should the price action be volatile and directionless, it may then
This indicator draws the prior Highs and Lows for multiple timeframes, and can display potential Take Profit and Stop Loss levels. In Rob Smith's # The Strat  terms, these are potential entry points, or alternatively potential targets for open positions. I like to use them in both ways. On a lower timeframe, say 5 minutes to get a good entry on a daily or weekly level, and then as a potential target. Very small stops required giving an excellent risk/reward ratio. Key Features  - Levels from Ho
ストラトの取引戦略 についてまだ学んでいない場合は、今すぐグーグルで検索してください。時間を無駄にしないことを約束します。使用するかどうかに関係なく、いくつかの新しいトリックを学ぶことができます。 OK、これで TheStrat とは何かがわかったので、このインジケーターが何をしてくれるかを理解できるようになります。 主な機能 つまり、インジケーターは次のことを行います。 サポートされているすべての時間枠の時間枠の連続性を表示 デイトレーダーとスイングトレーダーの2つのタイムセットビューをサポート 連続する 4 つの時間枠で完全な時間枠の継続性が適用されている場合に表示します 各時間枠の現在のろうそくの状態を表示します すべての時間枠で現在のパターンがあれば表示します 有効なパターンと実行可能なパターンの両方を表示 5 秒ごとに更新 (1 秒から設定可能) パネルをクリックして、選択した銘柄と時間枠のチャートを開くことができます チャートを開くために使用するチャート テンプレートを選択できます 表示するグループとそのグループ内のシンボルを選択します インジケーターは、ブローカーがサ
ピボット レベルは、すべての市場で認められている確立された技術レベルです。 このインジケーターは、任意のシンボルについて、現在の四半期ごと、月ごと、週ごと、日ごと、および 4 時間ごとのピボットをチャートに描画します。また、各期間のサポート レベルとレジスタンス レベルを表示し、レベル 1 ~ 4 から表示するものを選択することもできます。     次の中からピボットのタイプを選択します。 標準 カマリリャ デマーク ウッディー フィボナッチ 元の仕様に従って、DeMark ピボットには単一のサポート レベルとレジスタンス レベルがあることに注意してください。 インジケーター ウォールは、ラインが価格に触れた場合、ラインの描画方法を変更します。これは非常に役立ち、ラインのサポートまたは抵抗の強さは、一度触れると大幅に減少します. 期間ごとに、予測されたピボット レベルを表示するように選択できます。これは通常のピボットと同じ計算を使用しますが、現在不完全な時間枠で機能します。そのため、価格がその範囲の大部分をすでにカバーしている、その期間の終わりに向かって使用するのが最適です。 設定
市場はラウンド数を非常に好み、下落市場ではサポートとして機能し、価格が上昇するとレジスタンスとして機能することがよくあります。 この指標は、ラウンド値で価格レベルを描画するように設計されています。これは自動的に行われますが、それをオーバーライドして表示するレベルを決定するオプションもあります。 ラウンド レベルは、10、20、30 などの 10 のステップと同じくらい単純にすることができます。また、外国為替を使用している場合は、0.1 または 0.01 での変化を見たいと思うかもしれません。 インジケーターは、メジャーとマイナーの 2 つのクラスの線をそれぞれ異なる形式で描画します。これにより、レベルの 2 つの異なる変化の間の変化を同時に見ることができます。 アラート このインジケーターには、価格が設定可能な距離内にある場合に、メジャー、マイナー、または両方の価格レベルでアラートを鳴らす機能が含まれています。 自動セットアップ デフォルトでは、指標はメジャー価格とマイナー価格の両方の適切なレベルを決定します。これは、いつでも画面に表示する行数を制御する構成可能な DensityIn
Average True Range (ATR) は、設定された期間における価格の変動量を測定する一般的に使用される指標です。しかし、それが与える値はいかなる種類の境界内でも定義されていないため、ストップロスまたはテイクプロフィットの計算以外に使用することはほとんど不可能です. この指標は標準的な ATR 指標ですが、パーセンタイル境界を導入したので、極値を確認できます。 パーセンタイルと、分割中央値と呼ばれるものから選択できます パーセンタイル レベル パーセンタイル レベルは 1%、5%、20%、50%、80%、95%、99% で描かれ、これらは価格が他のすべての値に関連してどこにあるかを示します。たとえば、5% レベルは、ラインより下では ATR 読み取り値の 5% のみが低くなることを示し、99% は、そのレベルを超える ATR 値のうち、値の 1% のみが高くなることを示します。 80% を超えると、新しい取引のポジション サイズを下げ始めることを選択できます。また、95% を超えると、モメンタムが変化する前に利益を得るのに適した時期になる可能性があります。 分割中央値 Sp
フィルタ:
レビューなし
レビューに返信
バージョン 1.2 2021.06.16

New Setting - IncludeCurrentTimeframeOpen

When true, if the currently displayed timeframe is H1, D1, W1 or MN1, the indicator will include that periods open in its calculation. This is a new setting in the latest version of the indicator. Previously, the calculation did NOT include the current time period open, and this does not agree with TheStrat.

The setting is false by default, so existing users are unaffected unless they choose to turn it on.

New Setting - MaxMilliSecondsToCalculate

For charts with a lot of history loaded (over 10,000 bars), this will limit the amount of time the indicator has to initialise. By default, the setting is 1500 milliseconds, which is 1.5 seconds. If the indicator has not managed to perform all its calculations for historical bars after that period, it will stop trying. This means you will always get a significant history, but be guaranteed that it does not cause your chart to stop.