Multi Scanner MT5
- インディケータ
- Richard Osei
- バージョン: 3.0
- アクティベーション: 5
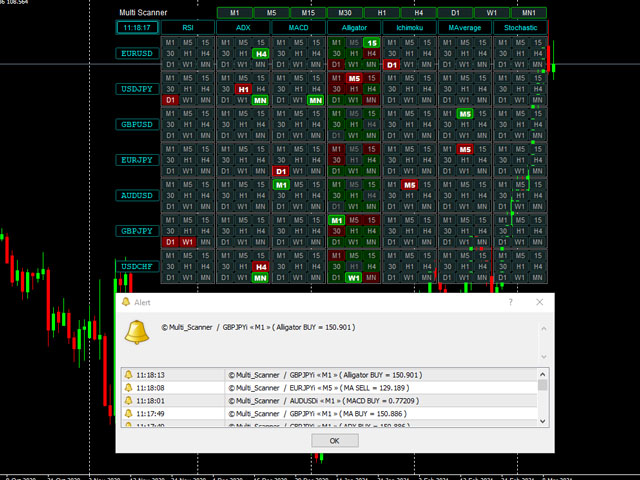
This indicator Allow you to get notification from 7 indicators.
Scan all your favorite pairs with your favorite technical indicator, and get notified on your preferred timeframes.
Settings are Customizable
(RSI, ADX, MACD, Alligator, Ichimoku, Double MA, and Stochastic)
Click to change the time frame or open new pairs
Notification: Phone/Popup/Email