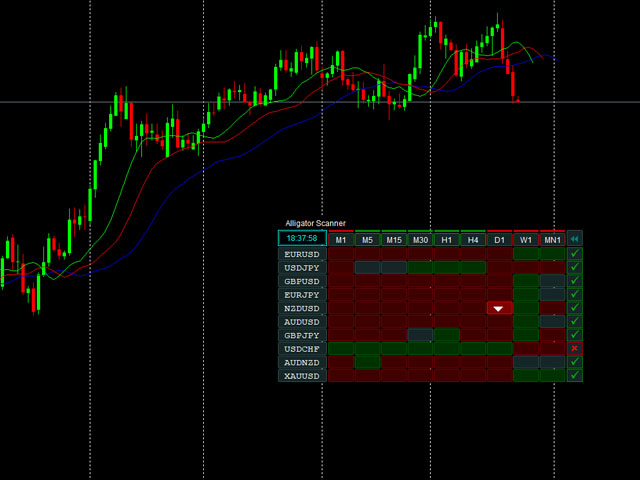
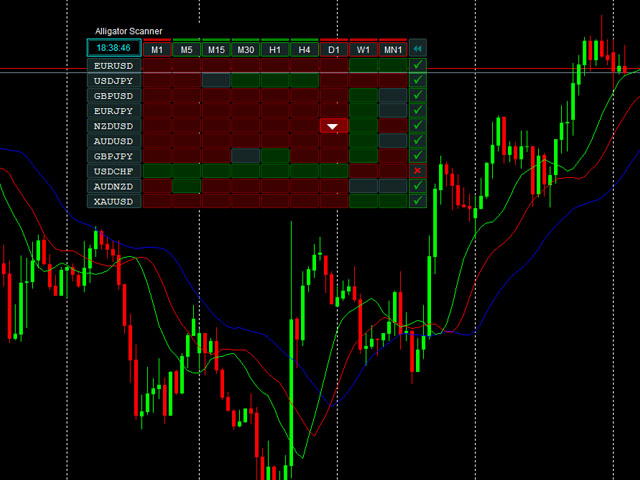
Alligator Scanner
- インディケータ
- Richard Osei
- バージョン: 3.0
- アクティベーション: 5
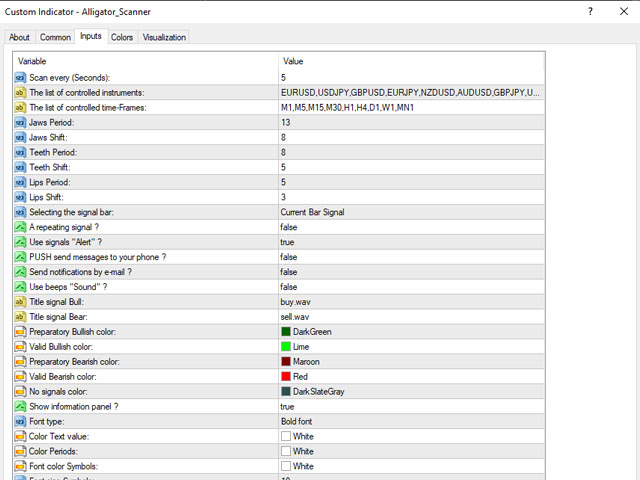
The Alligator indicator uses three smoothed moving averages, set at five, eight, and 13 periods, which are all Fibonacci numbers. The initial smoothed average is calculated with a simple moving average (SMA), adding additional smoothed averages that slow down indicator turns.
Scan all your favorite pairs with Alligator, and get notified on your preferred time frames.
Setting is Customizable
Click to change time frame or open new pairs
Notification: Phone/Popup/Email