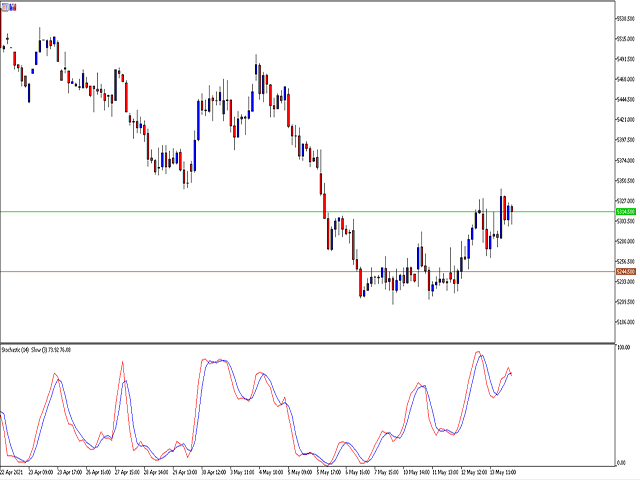
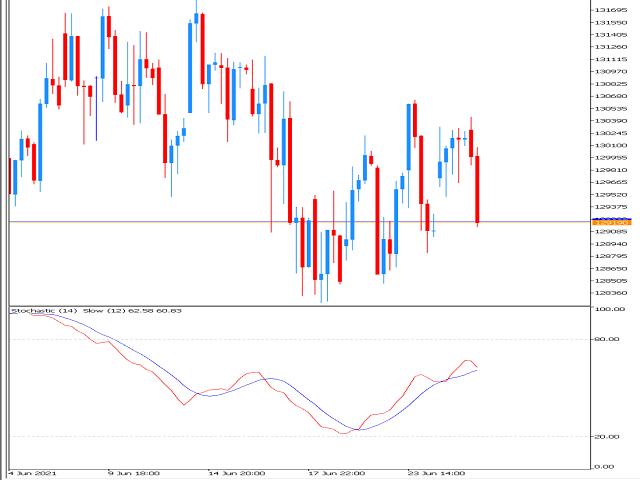
Stochastic Slow
- インディケータ
- Danrlei Hornke
- バージョン: 1.1
- アップデート済み: 25 6月 2021
- アクティベーション: 5
It was developed by George Lane in the early 1950s. It is based on the principle that the price closes close to the maximum if the asset is on an uptrend, and close to the minimum if it is on a downtrend. Following the idea of the inercial movement of prices.
This indicator can generate possible signals of overbought moments or about asset sales. In a usual way it can used according to some standards;
Slow Stochastic:
A moving average of 3 periods is calculated on the stochastic in order to smooth the values of the indicator. In this way, it avoids large fluctuations and can translates better market movements.
It has also been optimized to be and have the same values as the slow stochastic profit chart.

