Gapless Moving Average Lite
- インディケータ
- Eduardo Bortolotte
- バージョン: 1.0
Gapless Moving Average (GMA)
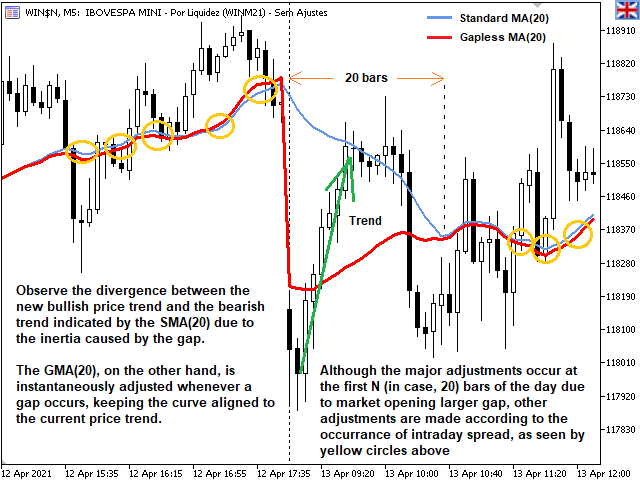
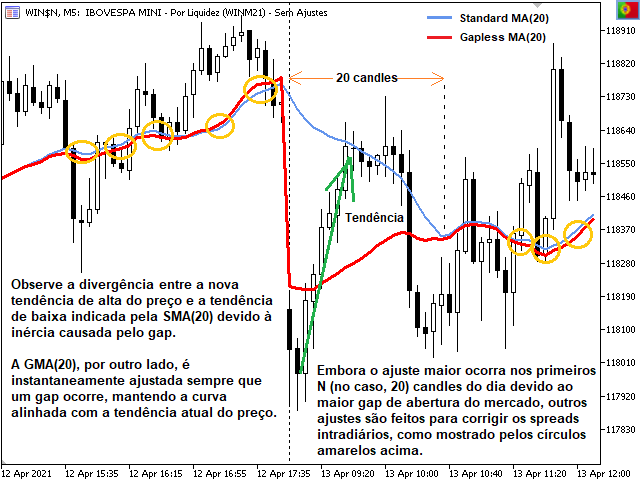
Improved version of standard Moving Average (MA) from MetaTrader library which provides the possibility to eliminate the 'gaps' between candle sticks which distort the average values mainly during the N ('period') initial candles after market opens due to the spread ('gap') between closing price from previous day and opening price from the next day.
The greater these 'gaps' are, the more divergent the standard MA is in order to indicate the current price trend and Gapless Moving Average eliminates those divergences.
It is suitable for any asset (forex, stocks, indexes etc) and any timeframe (from M1 to MN).
If this is exactly what you were looking for, skip next topics which provide you more information about how it's done and go straight to Parameters to get started using it!
Conceptual Basis
Off course, there is nothing mathematically wrong with the standard indicator, because it correctly implements the widely used Moving Average statistical concept. However, when this concept is used as a TREND indicator in stock markets, the gaps may cause divergences between the current price movement and the indicator curve. This happens because during the time the market is closed, the political and economic news frequently influence the way the agents perceive the market stocks valuation and this is reflected in the price during the opening auction.
The most important types of gaps are Breakaway, Exhaustion and Continuation gaps and for each of these groups, the standard MA may present an inertial behavior and slowly and gradualy corrects until N='MA period' bars have passed in order to correctly reflects the new trend. Visual examples of these divergences are described by the attached screenshots.
How it is calculated
The formulas used by GMA to calculate the averages are exactly the same used by standard MA. The difference is that GMA applies an offset value to each of the N-1 candles older than the current one. The offset applied to each candle is the accumulated gap relatively to the current one, where the gap is the difference between the opening price of a candle and the closing price of the previous one.
Parameters
This Lite version only allows the customization of the first 'Period' parameter while the others are fixed with default values.
| Parameter | Origin | Description | Type | Valid Values |
|---|---|---|---|---|
| Period | Standard | How many bars are used to calculate the average | Integer | >0 |
| Shift | Standard | How many bars the curve is horizontally shifted in graph | Integer | -N(left)...+N(right) (Lite: 0) |
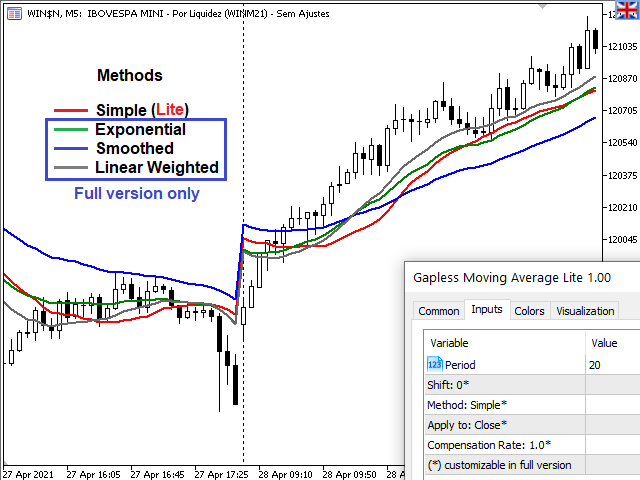
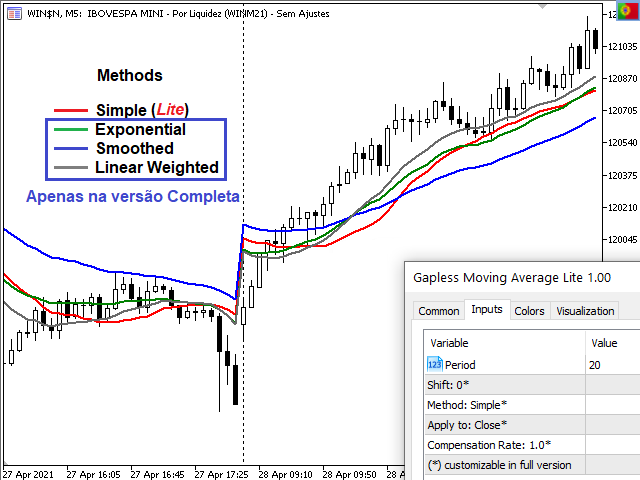
| Method | Standard | Type of smoothing the curve | Options | Simple (Lite), Exponential, Smoothed and Linear Weighted |
| Apply to | Standard | Type of price used to calculate | Options | Close (Lite), Open, High, Low, Median Price (HL/2), Typical Price (HLC/3) and Weighted Close (HLCC/4) |
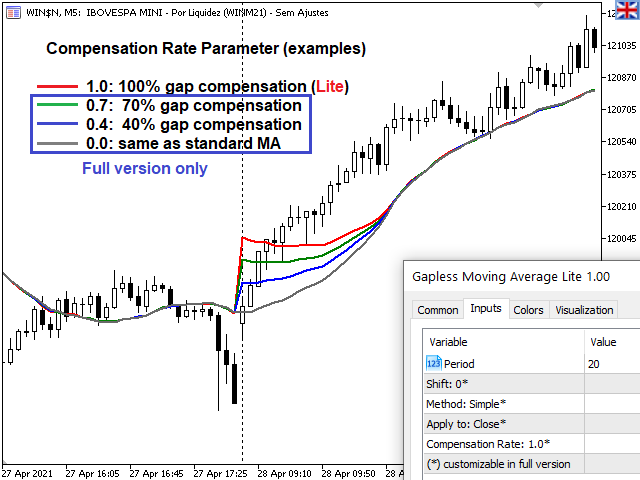
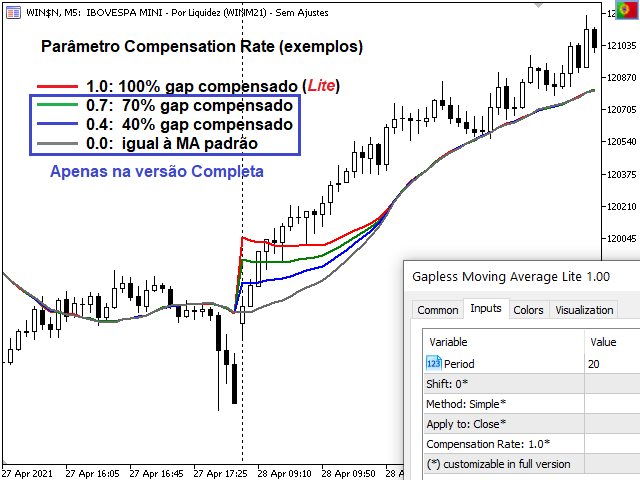
| Compensation Rate | Improvement | The rate the gap shall be compensated, where 0.0 means the indicator will behave exactly like standard indicator and 1.0 means the gaps will be 100% removed and all the possibilities between 0 and 1 (e.g. 0.2 = 20%, 0.5 = 50%, 0.87 = 87% etc) | Real (Double) | 0.0...1.0 (Lite) |
Support the Developer
Please, consider aquiring the Full version, give us your feedback writing a Review and share this tool to those who might be interested. Thank you!