NAM Order Blocks
- インディケータ
- NAM TECH GROUP, CORP.
- バージョン: 1.16
- アップデート済み: 11 1月 2022
- アクティベーション: 10
MT4マルチタイムフレームオーダーブロック検出インジケーター。
特徴
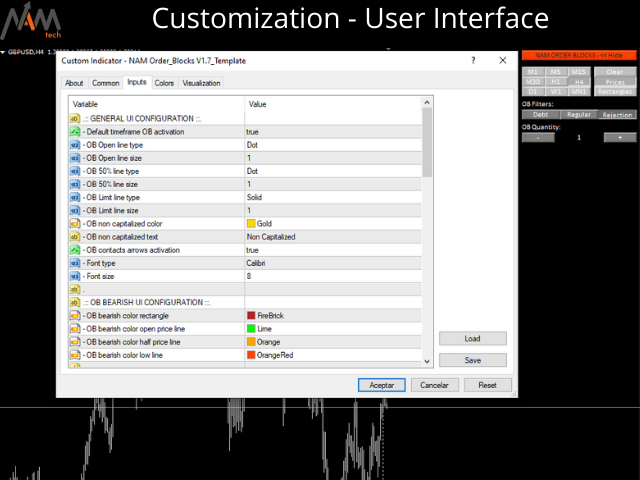
-チャートコントロールパネルで完全にカスタマイズ可能で、完全な相互作用を提供します。
-必要な場所でコントロールパネルを表示および非表示にします。
-複数の時間枠でOBを検出します。
-表示するOBの数量を選択します。
-さまざまなOBユーザーインターフェイス。
-OBのさまざまなフィルター。
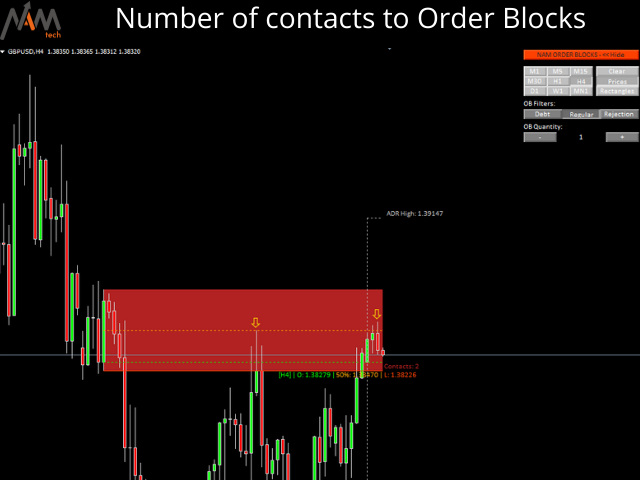
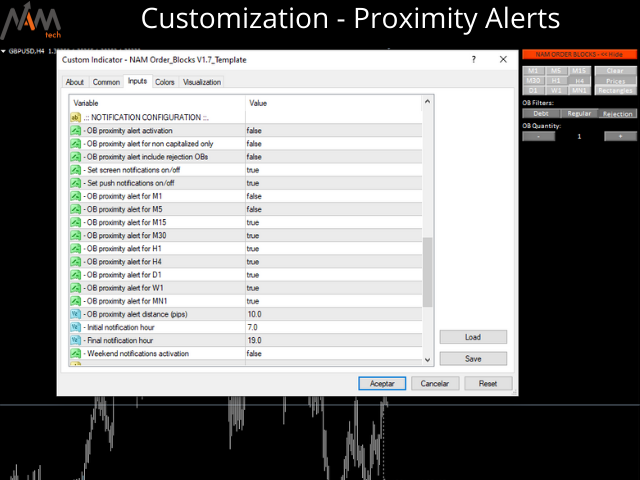
-OB近接アラート。
-ADRの高線と低線。
-通知サービス(画面アラート|プッシュ通知)。
概要
注文ブロックは、金融機関や銀行からの注文収集を示す市場行動です。著名な金融機関と中央銀行が外国為替市場を牽引しています。したがって、トレーダーは市場で何をしているのかを知る必要があります。市場が注文ブロックを構築するとき、それは投資決定のほとんどが行われる範囲のように動きます。
注文の構築が完了すると、市場は上向きと下向きの両方に向かって急激に動きます。注文ブロック取引戦略の重要な用語は、機関投資家が行っていることを含むことです。それらは主要な価格ドライバーであるため、機関投資家の取引を含むあらゆる戦略が可能性があります。
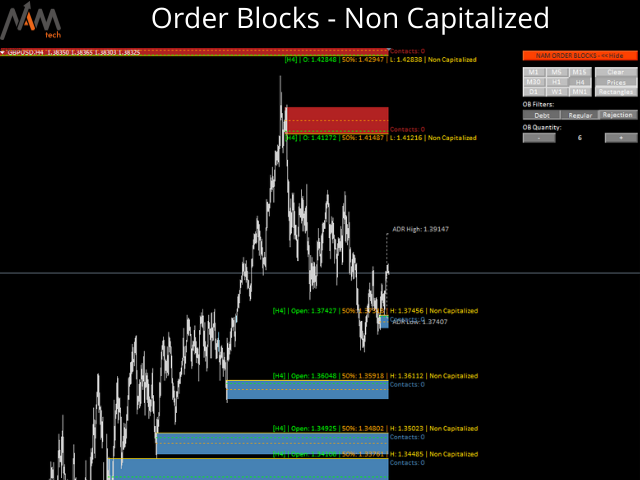
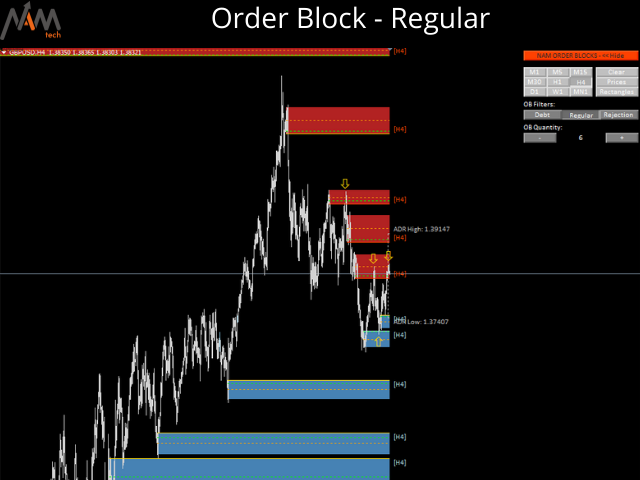
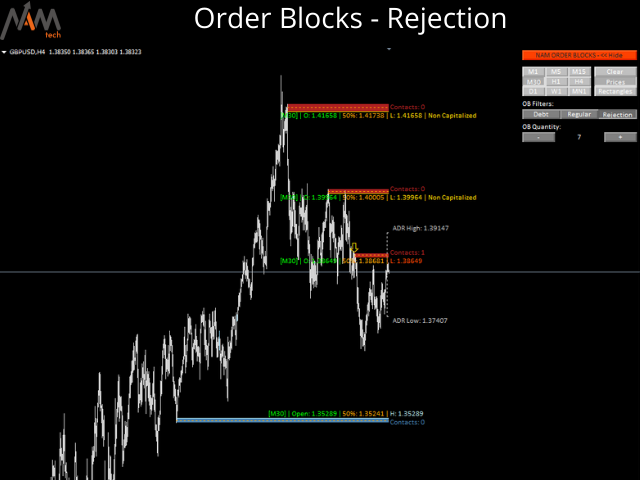
コントロールパネルを使用すると、選択した履歴期間で定期的、拒否、および大文字でない注文ブロックを検出できるため、任意の時間枠でリアルタイムの注文ブロックが表示されます。
注文ブロックの近接アラートを受信できるようになりました。MT4に画面上の通知があり、携帯電話にプッシュ通知があります。

Buen Indicador... buen soporte