TrendNote
- インディケータ
- Sivakumar Subbaiya
- バージョン: 1.0
Trend Note Indicator
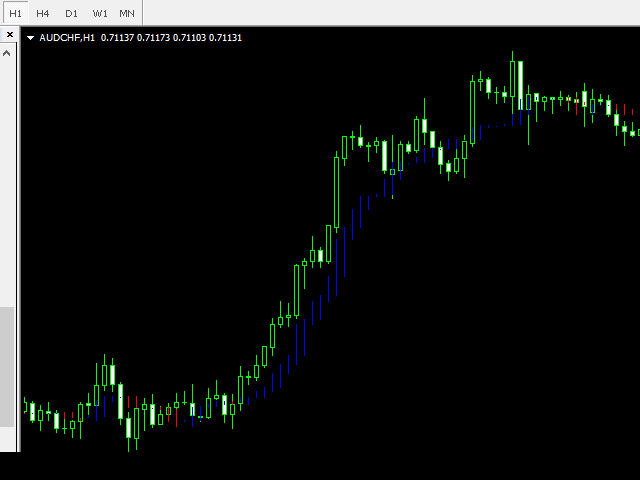
Suitable for multi time frame market direction prediction.
Blue and red color indicate the buy and sell call respectively.
Blue indicator is denote buy call and Red indicator denote the sell call.
Happy trade!!
this indicator is suitable for all time frame, but our recommended time frame to use 1hour and 4 hours, suitable for any chart.