Investment Castle Volatility Index MT4
- インディケータ
- Ahmed Alaaeldin Abdulrahman Ahmed Elherzawi
- バージョン: 1.1
- アップデート済み: 12 6月 2021
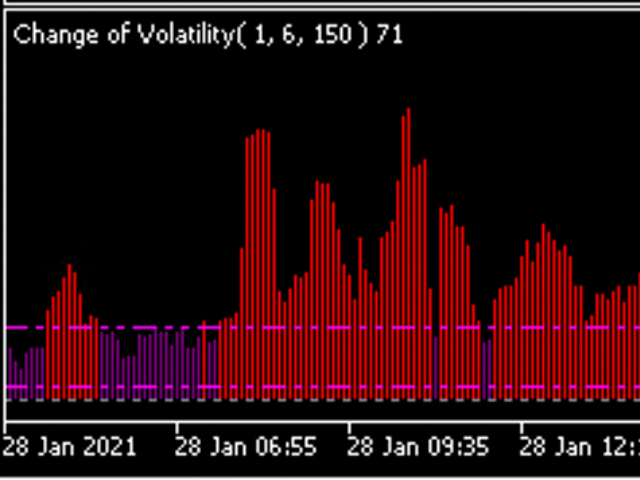
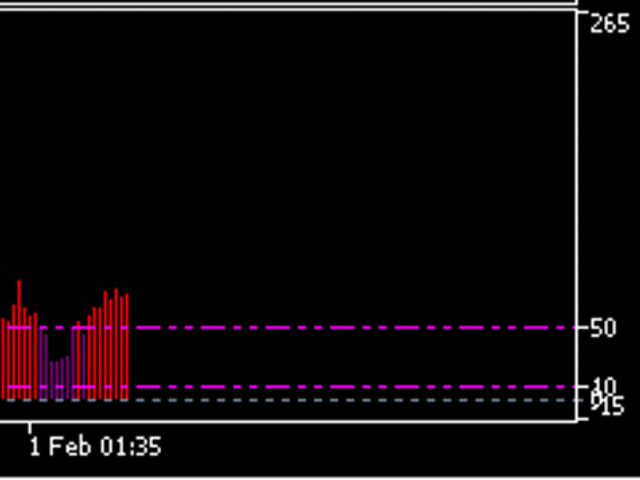
Investment Castle Volatility Index has the following features:
1. This indicator shows the volumes of the current symbol and the market volatility.
2. This indicator is built-in in the Investment Castle EA which works as volatility index for the EA dynamic distance and opposite start.
3. Parameters available for optimization for each pairs.
4. Works with any chart.


Great Indicator, well done! Also a very informative website and helpful Telegram channel. Thanks