RSChannel5
- インディケータ
- Tian Yu Li
- バージョン: 1.0
- アクティベーション: 5
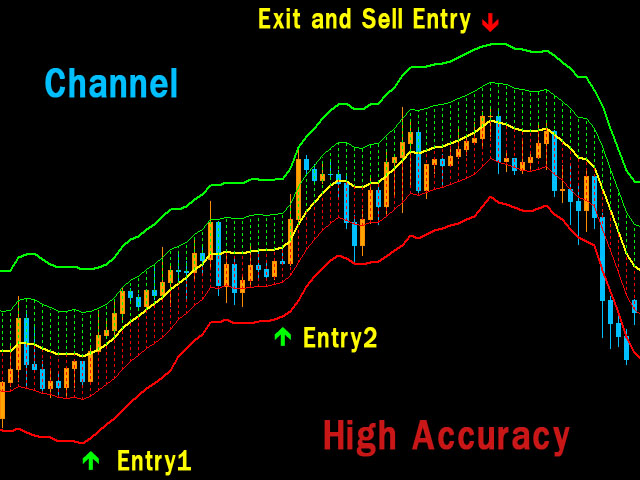
----< High Accuracy Trend Channel and Entry Signals >----
RSChannel could tell you the trend direction, resistance and support, when to open orders and where to set stoploss & takeprofit. this is a multifunctional indicator, can work well on all symbols and timeframes.
Features:
real-time analysis of trend direction
filter out all the minor waves
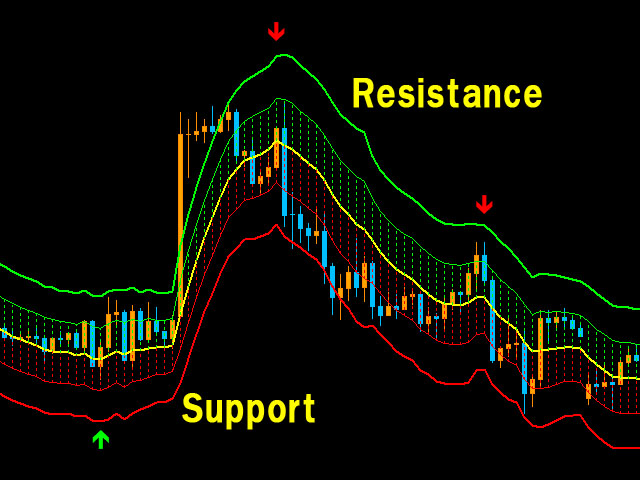
show resistance and support along as price goes
give highly accurate entry signals frequently
send alert in popup, email, notification way at every entry signal
all data output by standard buffer, easy to be implanted into an EA
all styles and colors customizable
no repainting
Usage:
trade with the obvious trend of the bands
upper bands are resistance while lower bands are support
simply open orders when arrow appear
stoploss at the outer edge of the bands
takeprofit at the opposite edge, or using tralingstop, let profit run.