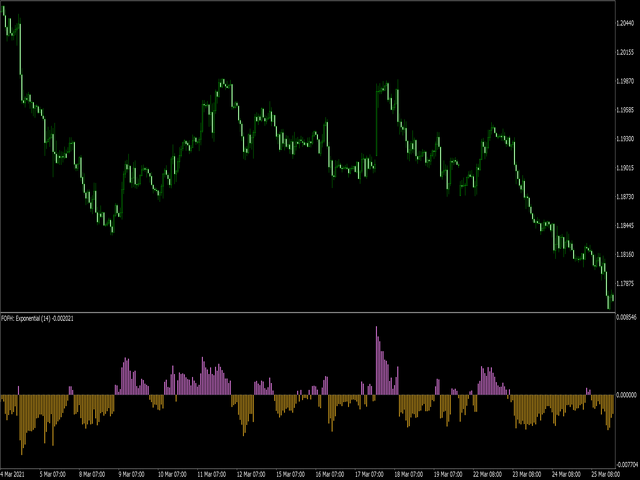
Fight of Forces Histogram
- インディケータ
- Nikolay Mitrofanov
- バージョン: 1.22
- アップデート済み: 1 2月 2022
The indicator draws a colored histogram from comparisons of the strengths of bulls and bears.
It works like this:
The values of two indicators Bears and Bulls are taken, who is stronger on the candlestick is compared, the column is filled in. It's all.
.
▄▄▄░░░░░░░░░░░░░░░░░░░░░░▄▄▄
░███░░░░░░░░▄▄▄▄░░░░░░░░███░
░░█▀█▄▄▄░░░██████░░░▄▄▄█▀█░░
░░▀█░░░▀▀██▄▄▄▄▄▄██▀▀░░░█▀░░
░░░░▀███▄██████████▄███▀░░░░
░░░▄█▀▄███▀██████▀███▄▀█░░░░
░░▄██▄██░██████████░██▄██▄░░
░░███████░████████░███████░░
░░████████░█▀▀▀▀█░████████░░
░░▀███████░█▄▄▄▄█░███████▀░░
░░░▀███████▄▄▄▄▄▄███████▀░░░
░░░░▀██████████████████▀░░░░
░░░░░▀████████████████▀░░░░░
░░░░░░████████████████░░░░░░
░░░░░░█████░░▀▀░░█████░░░░░░
░░░░░░▀███░░░░░░░░███▀░░░░░░
░░░░░░░███░░░░░░░░███░░░░░░░
░░░░░░░███░░░░░░░░███░░░░░░░
░░░░░░█████░░░░░░█████░░░░░░
░░░░░░░░░░░░░░░░░░░░░░░░░░░░


Good Morning! I liked the Fight of Forces Histogram indicator, congratulations for the excellent work. Could you give me the "index buffer". Thanks again!