• 概要
  • レビュー (2)
  • コメント (1)
  • 最新情報

Fight of Forces Histogram

5
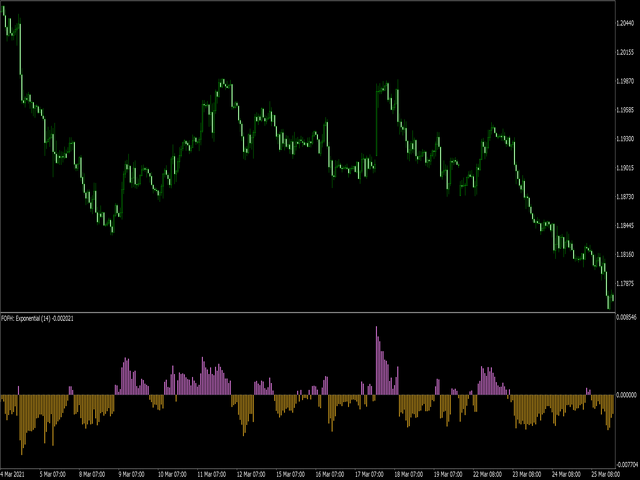
The indicator draws a colored histogram from comparisons of the strengths of bulls and bears.

It works like this:

The values ​​of two indicators Bears and Bulls are taken, who is stronger on the candlestick is compared, the column is filled in. It's all.


.
▄▄▄░░░░░░░░░░░░░░░░░░░░░░▄▄▄
░███░░░░░░░░▄▄▄▄░░░░░░░░███░
░░█▀█▄▄▄░░░██████░░░▄▄▄█▀█░░
░░▀█░░░▀▀██▄▄▄▄▄▄██▀▀░░░█▀░░
░░░░▀███▄██████████▄███▀░░░░
░░░▄█▀▄███▀██████▀███▄▀█░░░░
░░▄██▄██░██████████░██▄██▄░░
░░███████░████████░███████░░
░░████████░█▀▀▀▀█░████████░░
░░▀███████░█▄▄▄▄█░███████▀░░
░░░▀███████▄▄▄▄▄▄███████▀░░░
░░░░▀██████████████████▀░░░░
░░░░░▀████████████████▀░░░░░
░░░░░░████████████████░░░░░░
░░░░░░█████░░▀▀░░█████░░░░░░
░░░░░░▀███░░░░░░░░███▀░░░░░░
░░░░░░░███░░░░░░░░███░░░░░░░
░░░░░░░███░░░░░░░░███░░░░░░░
░░░░░░█████░░░░░░█████░░░░░░
░░░░░░░░░░░░░░░░░░░░░░░░░░░░


レビュー 2
Detleff Böhmer
2602
Detleff Böhmer 2021.03.30 10:22 
 

Gute Arbeit Nicolay, diesen Indikator habe ich auf jedem Chart. verlässliche Signale von H1 bis D1. Danke fürs teilen.

おすすめのプロダクト
Tired of information overload when analyzing forex currency strength? Introducing "All Currency Strength Live", the ultimate dashboard indicator for MetaTrader 5 that simplifies your trading life. This innovative tool provides a clear, concise overview of the strength of all major currencies, empowering you to make informed trading decisions with ease. With "All Currency Strength Live,"  you gain access to real-time insights into both price and volume strength across all major currencies. No mor
Project 1 RSI
Abdelrahman Ahmed Mahmoud Ahmed
5 (1)
Introducing Project 1 RSI, an expert advisor designed to simplify your trading experience. This powerful tool offers a user-friendly interface, making it easy to modify according to your specific trading strategies. With its lightning-fast backtesting capabilities, you can swiftly evaluate different scenarios and make informed decisions.  Whether you are a seasoned trader or just starting your journey, Project 1 RSI empowers you to make data-driven decisions with confidence. Experience the simpl
IX Powerは 、FX Powerの無敵の精度をついにFX以外のシンボルにも提供します。 お気に入りの指数、株式、コモディティ、ETF、さらには暗号通貨の短期、中期、長期のトレンドの強さを正確に判断します。 お使いの端末が提供する すべてを分析する ことができます。ぜひお試しいただき、取引 タイミングが大幅に改善 されることをご体験ください。 IXパワーの主な特徴 100%正確で再描画されない計算結果 - ターミナルで利用可能なすべての取引シンボルに対して 予め設定され、さらに個別に設定可能な強度分析期間のドロップダウン選択 Eメール、メッセージ、モバイル通知による無数の通知オプション EAリクエストのためのアクセス可能なバッファ カスタマイズ可能な計算制限により、さらに優れたパフォーマンスを実現 もっと見たい人のための特別なマルチインスタンス設定 すべてのチャートでお好みの色を無限に設定可能 Windows 11とmacOSのスタイルで角を丸くした新しいパネルデザイン サブ・ウィンドウとメイン・チャートの間をシームレスに移動する、魔法のように動くイン
The indicator compares quotes of a given symbol and a synthetic quote calculated from two specified referential symbols. The indicator is useful for checking Forex symbol behavior via corresponding stock indices and detecting their convergence/divergence which can forecast future price movements. The main idea is that all stock indices are quoted in particular currencies and therefore demonstrate correlation with Forex pairs where these currencies are used. When market makers decide to "buy" one
Micro Volume
Aleksandr Goryachev
4 (1)
Volumes  ******************* Volumes для платформы секундных графиков Micro . ********************* Секундный график на порядок увеличит точность ваших входов и выходов. Секундный период , в привычном формате,   позволит увидеть то, что ранее было скрыто. Бесплатные индикаторы, дополнят визуальную картину, что, в совокупности выведет вашу торговлю на новый уровень. Идеально подходит как скальперам, так и трейдерам торгующим внутри дня.  Индикатор Volumes  для платформы Micro. Входные парам
FREE
Delving deep into the sphere of finance and trading strategies, I decided to conduct a series of experiments, exploring approaches based on reinforcement learning as well as those operating without it. Applying these methods, I managed to formulate a nuanced conclusion, pivotal for understanding the significance of unique strategies in contemporary trading.  
FREE
Automatically detect bullish or bearish order blocks to optimize your trade entries with our powerful indicator. Ideal for traders following ICT (The Inner Circle Trader). Works with any asset type, including cryptocurrencies, stocks, and forex. Displays order blocks on multiple timeframes, from M2 to W1. Alerts you when an order block is detected, migrated, or a higher timeframe order block is created/migrated. Perfect for both scalping and swing trading. Enhanced by strong VSA (Volume Spread A
Didi Index
Flavio Javier Jarabeck
4.79 (24)
The famous brazilian trader and analyst Didi Aguiar created years ago a study with the crossing of 3 Simple Moving Averages called "Agulhada do Didi", then later was also named Didi Index, as a separate indicator. The period of those SMAs are 3, 8 and 20. As simple as that, this approach and vision bring an easy analysis of market momentum and trend reversal to those traders looking for objective (and visual) information on their charts. Of course, as always, no indicator alone could be used wit
FREE
Introducing AI Precision Trader: Unleash the Power of AI for Optimal Trading Performance! Embark on a revolutionary trading journey with AI Precision Trader, an Expert Advisor (EA) that stands at the forefront of innovation. Meticulously designed with cutting-edge Artificial Intelligence (AI) technologies, this EA redefines precision and profitability in algorithmic trading. Optimized Risk Management: Experience a new level of confidence with AI Precision Trader's advanced risk manage
News Catcher Pro MT5
Valeriia Mishchenko
4.75 (16)
News Catcher Pro is a mean-reversion strategy that uses intraday seasonal volatility patterns caused by high-impact news events. It enters the market at a certain time shortly before a high-impact news event occurs . It does not trade frequently! Supported currency pairs: GBPUSD, EURUSD, EURGBP Recommended timeframe: M5 MT4 version can be found here EA is   FIFO compatible To backtest the EA you should download the news events data file ' NewsEvents.txt ' and copy it to the common MT4/5 dir
KT Market Speed MT5
KEENBASE SOFTWARE SOLUTIONS
The KT Market Speed is a unique and straightforward oscillator-based technical analysis tool that helps traders visualize the speed at which the price of an instrument changes based on the preset length. The Market Speed representation helps correctly map the price momentum: is it moving fast, slowing down, or trapped in a range? These are the questions the indicator answers, giving traders more bandwidth to execute better-informed trade positions. Formula It's a simple technical analysis t
CAD Sniper MT5
Mr James Daniel Coe
4.67 (36)
CADスナイパーのアップデート版「 CAD SNIPER X 」がリリースされました! さらに数千の取引 |ブローカーの制限なし |より良い統計 |複数の戦略 ここでチェックしてください:   https://www.mql5.com/en/market/product/111918 CAD Sniperは、最も人気のあるブローカー専用に設計されています(画像を参照)。すべてでテストできますが、結果は異なります。 CAD Sniperを無料で使用できる製品としてお楽しみください;) ダウンロード後すぐに私にプライベートメッセージを送って、マニュアルと個人的なボーナスを受け取りましょう! まったく新しい「CADスナイパーX」をチェックしてください: ここをクリック 私のプレミアムボット「繁栄」をチェックしてください:   ここをクリック ライブシグナルの場合:   ここをクリック 顔立ち GBPCAD、CADCHF、AUDCAD、NZDCADで95%+の勝率 使いやすい 5%の最大DDから選択できる5つのリスク要因 ゆったりとしたペース あらゆるポートフォリオに最適 す
FREE
P Booster Pro is the developed version of P Booster.  Pro version allows adjusting 5 parameters: - RiskPerc: p ercent of the biggest lot that is available according to equity. - PriceFellPercent: difference between the choused candle ( WhichCandleM15From ) and the Candle 1 price in percent. - StopLossLevel: Stop loss level in percent point. For example: 30 = 99,7% of the Ask price. - WhichCandleM15From: M15 Candle ID from where the expert will check the PriceFellPercent level and compare it with
Night Hunter Pro MT5
Valeriia Mishchenko
4.35 (34)
EA has a live track record with many months of stable trading with  low drawdown: Best Pairs (default settings) High-risk   performance Night Hunter Pro is the advanced scalping system which utilizes smart entry/exit algorithms with sophisticated filtering methods to identify only the safest entry points during calm periods of the market. This system is focused on a long-term stable growth. It is a professional tool developed by me years ago that is constantly updated, incorporating all the late
算術平均または中央値を使用して、時系列の中心的な傾向の尺度を決定できます。どちらの方法にもいくつかの欠点があります。算術平均は、単純移動平均インジケーターによって計算されます。エミッションやノイズに敏感です。中央値はより安定して動作しますが、間隔の境界で情報が失われます。 これらの欠点を減らすために、疑似メディアン信号フィルタリングを使用できます。これを行うには、短い長さの中央値を取得し、調査中の財務時系列の期間のすべての値に再帰的に適用します。このアプローチのおかげで、インディケータを使用すると、定期的およびトレンドの価格変動をより正確に識別できます。 インジケーターの外部パラメーター: インジケーターを開始するとき、[パラメーター]タブで、計算に使用される価格定数を選択します(デフォルトでは閉じる)。 iPeriod-インジケーター期間。このパラメーターの値が高いほど、最新の価格変動に対するインジケーターの感度が低くなります。このパラメーターの最小値は3です。 MaxBars-計算の履歴の深さを制限します。インジケーターの起動に時間がかかる場合に便利です。 MaxBars = 0
MT5 Broker  Rates (OHLC, candles) HTTP Provider Description EA turns your MT5 terminal into   historical/realtime rates  data provider for your application.  There are many market data providers on the internet, but in practice, the data provided is not always of good quality. Moreover, these services are often more expensive and typically require monthly subscription fees per each symbol. With this EA, you can feed your application with exactly the same rates data that you see in the MT5 term
TSI Trend Analyzer
Joao Paulo Ferreira Fortes
4.5 (6)
In which direction should I trade today? For “TREND followers”, we need to determine the TREND . This indicator determines the Trend based on the price High, Low and Close of every bar, for a given period and timeframe. Calculating and plotting the Trend UP and Trend DOWN lines. If the:   “Trend UP” line (Green) is above the “Trend DOWN” line (Red), then it is a BULLISH Trend (see "Screenshots" tab). “Trend DOWN” line (Red) is above the “Trend UP” line (Green), then it is a BEARISH Trend (see "
FREE
E2C Lines
Eduardo Cristian De Carvalho
Descubra o poder do nosso indicador de alta precisão, projetado para identificar as regiões de alvo e exaustão de qualquer ativo. Testado e validado por mais de 3 anos nos mercados de mini dólar e mini índice, ele oferece confiabilidade e eficácia incomparáveis. Transforme sua estratégia de trading e alcance novos patamares de sucesso com nossa ferramenta inovadora.
OrderHelper script is super easy and trader friendly to use. It would boost your trading experience. Because it is designed to open one to multiple orders quickly with just one click. Besides using the OrderHelper script, traders can define various parameters for open orders such as the symbol, order type, lot size, stoploss, takeprofit and more. Basically, with this script traders can manage their open orders more efficiently and save their trading time. OrderHelper manages: Open the number o
The Signal Sunrise channel indicator automatically builds a trend movement support channel. The price is in its trend movement in a certain range, and not a chaotic spread of the price is unclear in which direction. And if the price deviates within a certain range, then this means that the boundaries of these ranges are support and resistance lines and form a channel. It is no secret that the wave theory, like many others, is based on observations, however, one of the most important patterns
TickChart Indicatorは、MetaTraderのメインウィンドウにティックチャートを表示します。 (無料のLite版、TickChart Indicator Liteでは、 表示するティック数を20に制限し、以下の説明にあるアラート機能を省いています。) ティックチャートは、市場の動きを最も詳細かつリアルタイムに示すティックラインを描画します。値が変わるたびに発生するティックの間隔は1分足のローソク幅より短いので、通常のチャート上には描けません。通常、数個のティック線分が、1分足のローソクが完成する間に発生しており、重要な指標の発表直後には、その数が100を超える事もあります。 このインディケーターは、ティックラインをメインウィンドウの通常のチャートの上に描きます。通常のチャートは、"時間-価格"空間に描きますが、ティックチャートは、"ティック-価格"空間に描かれます。すなわち、ティックチャートのX軸は時間ではなく、市場が活発だとX軸の進行は速く、閑散だと遅くなります。 TickChart indicatorは、いろいろな場面で役立ちます。例えば、 スキャルピングの道
FREE
Find out in real time which side, buy or sell, is putting the most pressure through a simple and efficient visualization of Depth of Market. The indicator calculates the amount of offers at the specified depths and displays the percentage on each side in relation to the total. PressureBook Indicator is fully customizable, in which you can: Select which symbol you want to track. By default, the selected symbol is the same as the graph in which the indicator was inserted; Define the amount of pri
The Onion Trend Indicator is a revolutionary trend trading and market data filtering solution that combines all the important features of a trend tool in one tool! It is great for any trader, be it Forex or binary options. No settings are required, everything is optimized by time and experience, it works effectively both in flat conditions and in trend conditions. The Onion Trend Indicator is a technical analysis tool for financial markets that reflects current deviations in the price of stoc
Displays a digital clock or a countdown (until new bar) in the chart in realtime. Benefits: Current time always in sight for market open/close, economic data, etc. Displays accurate time (server/broker time) Keep an eye on how much time is left until a new bar starts (countdown) Clearly visible (set color, size, font, position) Always runs/refreshes every second even without new price tick Hint: To display the most accurate time, use the server (broker) clock setting combined with the time (ho
FREE
DLMACD
Roman Sukhorukov
4 (1)
DLMACD - Divergence Local (Wave) MACD . The indicator displays divergences by changing the color of the MACD histogram. The indicator is easy to use and configure. It was created as an addition to the previously published DWMACD . For the calculation, a signal line or the values ​​of the standard MACD histogram can be used. You can change the calculation using the UsedLine parameter. It is advisable to use a signal line for calculation if the histogram often changes directions and has small val
FREE
Ind2tompson
Vasilii Luchnikov
5 (1)
2indtompsonインジケータは、MT4端末用のアナログバージョンから作成されたペア取引または裁定取引のバランスをとるために、ボリュームを決定するための二つの あなたは二つの楽器が重量を量るだろうどのくらい比較する必要があり、あなたがそれを行う方法がわからないのであれば、チャート上のインジケータ さらに、インジケータは、互いに対する楽器の状態を示します-発散/収束。 M5/M15/H1時間枠で使用することをお勧めします 通信のための連絡先777basil@mail.ru あなたの技術的なタスクに従って、expert Advisor/indicator/scriptの書き込み、製造、リワーク、修正を行います。 ありがとう!. https://youtu.be/kgbIgnujuAM
FREE
アップデート版の無料公開中です。 140ダウンロードありがとうございます。 動画は   Ver. 034.30   原資1, 000ドル/レバレッジ25倍 テストの一例です。 Ver. 034.33  リリース致しました。 継続して内部で調整していますが、 枚数の設定は外してエントリーできる維持率の限度を調整することで資金管理します。 以前に比較してエントリー数が増加すると共に一時的なドローダウンは増加することがあります。余剰資金を多めにするか、レバレッジを高く設定する必要があります。 エントリーできない不具合について このページの最後に まとめています。改善の都度アップデートします。 基本事項 プラットフォーム:MetaTrader 5 通貨ペア:EUR-USD チャート:5分足 EUR-USD  の5分足のチャートを表示して、セットします。 1分足と同等という認識になりましたので5分足とします。 ブローカーによって調整が必要な場合がございます。 MT5に慣れていらっしゃらない方向け MT4メインでお使いのために慣れていらっしゃらない方もおられるかと存じます。 最もメ
FREE
MT4 version -   https://www.mql5.com/ru/market/product/69932 Unlike other indicators of this type, this version has: The ability to display data from smaller timeframes on the current chart. For example, displaying data from the M1 period on the H1 chart. Calculation of values ​​using the Gaussian formula (normal distribution formula). Flexible system of settings. Settings: basePeriod   - base period. indicatorMode  - display mode. Sets the value of each interval:   by4h   (4 hours),   by6h  
このアドバイザーは、コース クリスタル インジケーターを使用して取引の意思決定を行います。重要なポイントは次のとおりです。 コースクリスタルインジケーター:このインジケーターは、市場のトレンドの方向を決定するのに役立ちます。価格変動を分析し、結果をチャート上に色付きの領域として表示します。青は買いの機会を示し、赤は売りの機会を示します。 取引システム: Expert Advisor は、現在および過去の価格データを分析して、トレンドの一般的な方向を決定します。データが価格の上昇を示している場合、インジケーターは青に変わります。データが価格の下落を示している場合、インジケーターが赤に変わります。 取引に参加するためのシグナル: インジケーターの色が赤から青に変わると、購入のサインになる可能性があります。 青から赤への色の変化は売りシグナルとなる可能性があります。 リスク管理: 取引ごとにストップロスと利益確定を常に設定することが重要です。ストップロスは、前回の高値または安値より上(買う場合)または下(売りの場合)のレベルに設定することをお勧めします。 取引の完了:
The best time to trade Using this Indicator is when the time reach exactly hour,half,45 minutes,15 minutes and sometimes 5 minutes.. This indicators is helpful to those who trade boom and crash indecies.How to read this indicator first you'll see Blue allow and Red allow all these allows used to indicate or to detect the spike which will happen so the allow happens soon before the spike happen.This indicator works properly only in boom and crash trading thing which you have to consider when
このプロダクトを購入した人は以下も購入しています
まず第一に、この取引インジケーターは再描画されず、再描画されず、遅延しないことを強調する価値があります。これにより、手動取引とロボット取引の両方に理想的なものになります。 ユーザーマニュアル:設定、入力、戦略。 アトミックアナリストは、価格の強さとモメンタムを利用して市場でより良いエッジを見つけるためのPA価格アクションインジケーターです。ノイズや誤ったシグナルを除去し、取引ポテンシャルを高めるための高度なフィルターを備えています。複雑なインジケーターの複数のレイヤーを使用して、アトミックアナリストはチャートをスキャンし、複雑な数学的計算をシンプルなシグナルと色に変換します。これにより、どのような初心者トレーダーでも理解して使用し、一貫した取引の決定を行うことができます。 「アトミックアナリスト」は、新規および経験豊富なトレーダー向けにカスタマイズされた包括的な取引ソリューションです。プレミアムインジケーターとトップノッチの機能を1つの取引戦略に組み合わせ、すべてのタイプのトレーダーにとって汎用性のある選択肢にします。 デイリートレーディングとスキャルピング戦略:高速で正確な
まず第一に、このトレーディングシステムがノンリペイント、ノンリドロー、ノンラグのインジケーターであることを強調する価値がある。これにより、手動取引とロボット取引の両方に理想的なものになっています。 オンラインコース、マニュアル、プリセットのダウンロード。 「スマートトレンドトレーディングシステム MT5」は、新規および経験豊富なトレーダー向けにカスタマイズされた包括的なトレーディングソリューションです。10以上のプレミアムインジケーターを組み合わせ、7つ以上の堅実なトレーディング戦略を備えており、多様な市場状況に対応する多目的な選択肢となっています。 トレンドフォロー戦略:トレンドを効果的に乗り越えるための正確なエントリーとストップロス管理を提供します。 リバーサル戦略:潜在的なトレンドの反転を特定し、トレーダーがレンジ相場を活用できるようにします。 スキャルピング戦略:高速で正確なデイトレードおよび短期取引のために設計されています。 安定性:すべてのインジケーターはノンリペイント、ノンリドロー、ノンラグであり、信頼性の高いシグナルを保証します。 カスタマイズ:個々の取引の嗜好に合わせ
Quantum Trend Sniper
Bogdan Ion Puscasu
4.91 (43)
ご紹介   クォンタム トレンド スナイパー インジケーターは 、トレンド反転を特定して取引する方法を変革する画期的な MQL5 インジケーターです。 13年以上の取引経験を持つ経験豊富なトレーダーのチームによって開発されました。     クォンタムトレンドスナイパーインジケーター   は、非常に高い精度でトレンドの反転を識別する革新的な方法で、あなたのトレーディングの旅を新たな高みに押し上げるように設計されています。 ***Quantum Trend Sniper Indicatorを購入すると、Quantum Breakout Indicatorを無料で入手できます!*** クォンタム ブレイクアウト インジケーターは、トレンドの反転を特定するとアラートを発し、矢印を示し、3 つのテイクプロフィットレベルを提案します。 初心者トレーダーにもプロのトレーダーにも適しています。 量子EAチャネル:       ここをクリック MT4のバージョン:       ここをクリック 推奨事項: 期間:すべての時間枠。最良の結果を得るには、M
mql5と Telegramの モーニング・ブリーフィングで、詳細とスクリーンショットを含む毎日のマーケット・アップデートをご覧 ください! FX Power MT5 NGは 、長年の人気を誇る通貨強度計FX Powerの次世代モデルです。 この次世代ストレングスメーターは何を提供するのでしょうか?初代FXパワーの魅力すべて プラス GOLD/XAUの強さ分析 より正確な計算結果 個別に設定可能な分析期間 カスタマイズ可能な計算上限値により、さらに優れたパフォーマンスを実現 もっと見たい人のための特別なマルチインスタンス設定 すべてのチャートでお好みの色を無限に設定可能 数え切れないほどの通知オプションにより、重要なことを見逃すことはありません。 Windows 11とmacOSのスタイルで角を丸くした新しいデザイン 魔法のように動くインジケーターパネル FXパワーの主な機能 すべての主要通貨の強さの完全な履歴 すべての時間枠における通貨の強さの履歴 すべてのブローカーとチャートで同一の計算結果 100%信頼できるリアルタイム計算 -> リペイントなし ドロップダウン・リストから
Gold Stuff mt5
Vasiliy Strukov
4.89 (178)
Gold Stuff mt5 は、金専用に設計されたトレンド指標であり、あらゆる金融商品にも使用できます。 インジケーターは再描画せず、遅れません。 推奨時間枠 H1. 設定と個人的なボーナスを得るために、購入後すぐに私に連絡してください!  トレンド スキャナーの強力なサポートを利用して、無料のインジケーターを入手し、プライバシーを守ります。あーみー!   設定 矢印を描く - オンオフ。 チャートに矢印を描く。 アラート - 可聴アラートのオンオフ。 メール通知 - オンオフ。 電子メール通知。 プチ通知 - オンオフ。 プッシュ通知。 次に、色域を調整します。 Gold Stuff mt5 は、金専用に設計されたトレンド指標であり、あらゆる金融商品にも使用できます。 インジケーターは再描画せず、遅れません。 推奨時間枠 H1. 設定と個人的なボーナスを得るために、購入後すぐに私に連絡してください!   設定 矢印を描く - オンオフ。 チャートに矢印を描く。 アラート - 可聴アラートのオンオフ。 メール通知 - オンオフ。 電子メール通知。 プチ通
Reversal First Impulse levels (RFI)      INSTRUCTIONS        RUS       -       ENG              R ecommended to use with an indicator   -   TREND PRO -  Version MT4                 A key element in trading is zones or levels from which decisions to buy or sell a trading instrument are made. Despite attempts by major players to conceal their presence in the market, they inevitably leave traces. Our task was to learn how to identify these traces and interpret them correctly. Main functions:: Di
トレンド スクリーナー インジケーターでトレンド取引の力を解き放ちます。ファジー ロジックと複数通貨システムを活用した究極のトレンド取引ソリューションです。 ファジー ロジックを活用した革新的なトレンド インジケーターである Trend Screener を使用して、トレンド取引を向上させます。 これは、13 を超えるプレミアム ツールと機能、および 3 つの取引戦略を組み合わせた強力なトレンド追跡インジケーターであり、Metatrader をトレンド アナライザーにする多用途の選択肢となります。 期間限定オファー : トレンド スクリーナー インジケーターは、わずか 50 ドルで生涯ご利用いただけます。 (元の価格 125$ ) (オファー延長) Trend Screener の 100% 非再描画精度の揺るぎない精度を体験して、取引の決定が過去の価格変動の影響を受けないようにしてください。 マルチタイムフレームおよびマルチ通貨機能の多用途性を解放し、比類のない自信を持って外国為替、商品、暗号通貨、インデックスの世界を取引できるようにします。 Trend Screener の包括的な
まず第一に、この取引ツールはノンリペイント、ノンリドロー、ノンラグの指標であり、プロの取引に理想的ですことを強調する価値があります。 オンラインコース、ユーザーマニュアル、デモ。 スマートプライスアクションコンセプトインジケーターは、新米から経験豊富なトレーダーまで、非常 に強力なツールです。Inner Circle Trader AnalysisやSmart Money Concepts Trading Strategiesなど、20以上の有用な指標を1つに組み合わせています。このインジケーターはスマートマネーコンセプトに焦点を当て、大手機関の取引方法を提供し、彼らの動きを予測するのに役立ちます。 特に、流動性分析に優れており、機関がどのように取引しているかを理解しやすくしています。市場のトレンドを予測し、価格の動きを慎重に分析するのに優れています。機関の戦略とトレードを合わせることで、市場の動向についてより正確な予測ができます。このインジケーターは多目的であり、市場構造を分析し、重要な注文ブロックを特定し、さまざまなパターンを認識するのに優れています。 このインジ
FX Volume MT5
Daniel Stein
4.94 (17)
mql5と Telegramの モーニング・ブリーフィングで、詳細とスクリーンショットを含む毎日のマーケット・アップデートをご覧 ください! FX Volumeは、ブローカーの視点から市場のセンチメントをリアルに洞察する、最初で唯一の出来高インジケーターです。 ブローカーのような機関投資家が外国為替市場でどのようなポジションをとっているか、COTレポートよりもはるかに速く、素晴らしい洞察を提供します。 この情報をチャート上で直接見ることは、あなたの取引にとって真のゲームチェンジャーであり、画期的なソリューションです。 以下のようなユニークなマーケットデータ洞察から利益を得てください。 比率は 、通貨のロングポジションとショートポジションの比率をパーセントで表示します。 比率の変化は 、選択した期間内のロング比率とその変化率を表示します。 Volumes Totalは 、通貨の取引量(ロングとショート)の合計をロット単位で表示します。 Volumes Long :全通貨のロングポジションの取引量を表示します。 Volumes(ショート )は、全通貨のショートポジションの取引量を表示
TPSpro TRENDPRO  - is a trend indicator that automatically analyzes the market and provides information about the trend and each of its changes, as well as giving signals for entering trades without redrawing! The indicator uses each candle, analyzing them separately. referring to different impulses - up or down impulse. Exact entry points into transactions for currencies, crypto, metals, stocks, indices!  -  Version MT4               DETAILED DESCRIPTION               R ecommended to use with
これはMT5のインジケーターで、再描画なしで取引に参入するための正確なシグナルを提供します。 外国為替、暗号通貨、金属、株式、インデックスなど、あらゆる金融資産に適用できます。かなり正確な見積もりを提供し、取引を開始して終了するのに最適な時期を教えてくれます。1つのシグナルを処理しただけでインジケーターの元が取れた例の 動画 (6:22)をご覧ください。Entry PointsPro インジケーターの助けを借りたほとんどのトレーダーの最初の1週間の結果が改善しています。 Telegramグループ に登録してください。Entry Points Proインジケーターのメリットは次の通りです。 再描画のないエントリーシグナル 再描画されるインジケーターでは一度表示されたシグナルが削除されて大きな金銭的損失につながることがありますが、これと異なり、表示されて確認されたシグナルは消えることがありません。 エラーなしの取引開始 インジケーターアルゴリズムによって取引を開始する(資産を売買する)理想的な瞬間を見つけることができます。それを使用するすべてのトレーダーの成功率が向上します。
WHY IS OUR FXACCCURATE LS MT5 THE PROFITABLE ? PROTECT YOUR CAPITAL WITH RISK MANAGEMENT Gives entry, stop and target levels from time to time. It finds Trading opportunities by analyzing what the price is doing during established trends. POWERFUL INDICATOR FOR A RELIABLE STRATEGIES We have made these indicators with a lot of years of hard work. It is made at a very advanced level. Established trends provide dozens of trading opportunities, but most trend indicators completely ignore them!
AW Trend Predictor MT5
AW Trading Software Limited
4.78 (58)
1 つのシステムでのトレンド レベルとブレイクダウン レベルの組み合わせ。高度なインジケーター アルゴリズムは、市場のノイズをフィルター処理し、トレンド、エントリー ポイント、および可能なエグジット レベルを決定します。インジケーターシグナルは統計モジュールに記録されるため、最適なツールを選択してシグナル履歴の有効性を示すことができます。この指標は、テイクプロフィットとストップロスのマークを計算します。 マニュアルと説明書 ->   ここ / MT4 バージョン ->   ここ インジケーターで取引する方法: Trend Predictor での取引は、たった 3 つの簡単なステップです。 ステップ 1 - ポジションを開く 70% 以上の成功率で買いシグナルが受信されました ステップ 2 - ストップロスの決定 逆信号でトランクを選択 ステップ 3 - テイクプロフィット戦略の定義 戦略 1: TP1 に到達したらポジション全体をクローズする 戦略 2: TP1 に達した時点でポジションの 50% をクローズし、TP2 に達した時点で残りの 50% をクローズします。 戦略 3:
ICT, SMC, SMART MONEY CONCEPTS, SMART MONEY, Smart Money Concept, Support and Resistance, Trend Analysis, Price Action, Market Structure, Order Blocks, BOS/CHoCH,   Breaker Blocks ,  Momentum Shift,   Supply&Demand Zone/Order Blocks , Strong Imbalance,   HH/LL/HL/LH,    Fair Value Gap, FVG,  Premium  &   Discount   Zones, Fibonacci Retracement, OTE, Buy Side Liquidity, Sell Side Liquidity, BSL/SSL Taken, Equal Highs & Lows, MTF Dashboard, Multiple Time Frame, BigBar, HTF OB, HTF Market Structure
Bill Williams Advanced is designed for automatic chart analysis using Bill Williams' "Profitunity" system. The indicator analyzes four timeframes at once. Manual (Be sure to read before purchasing) Advantages 1. Automatically analyzes the chart using the "Profitunity" system of Bill Williams. The found signals are placed in a table in the corner of the screen. 2. Equipped with a trend filter based on the Alligator indicator. Most of the system signals are recommended to be used only accordi
ブレーカートレーダーになり、価格が反転すると市場構造からの利益が変化します。 注文ブロックブレーカーインジケーターは、トレンドまたは価格の動きが枯渇に近づいており、逆転の準備ができていることを識別します。通常、反転または大規模なプルバックが発生しようとしているときに発生する市場構造の変化について警告します。 この指標は、ブレイクアウトと価格の勢いを識別する独自の計算を使用します。使い果たされる可能性のあるポイントの近くで新しい高値が形成されるたびに、インディケーターはその高値の作成を担当する最後の注文ブロックを描きます。次に、移動する価格とともに注文ブロックを追跡します。その後、価格が反対方向にシフトし、その注文ブロックを突破すると、新しい市場構造を作成し、トレンドまたは大きな後退の可能性のある反転の開始を警告します。 注文ブロックは、高値/安値が作成される前の最後の反対色のろうそくであり、価格がこれらの重要な領域を下抜けすると、トレンドの短期的ま​​たは長期的な反転の兆候です。 特徴 重要な枯渇点での市場構造の変化を警告します 価格が使い果たされるレベルに近づくと、
The Volume by Price Indicator for MetaTrader 5 features Volume Profile and Market Profile TPO (Time Price Opportunity). Volume and TPO histogram bar and line charts. Volume Footprint charts. TPO letter and block marker collapsed and split structure charts. Session filtering and grouping. Static, dynamic and flexible range segmentation and compositing methods with relative and absolute visualizations. Graphical layering, positioning and styling options to suit the user's analytic and aesthetic n
Easy By Sell is a market indicator for opening and closing positions. It becomes easy to track market entries with alerts. It indicates trend reversal points when a price reaches extreme values ​​and the most favorable time to enter the market. it is as effective as a Fibonacci to find a level but it uses different tools such as an algorithm based on ATR indicators and Stochastic Oscillator. You can modify these two parameters as you wish to adapt the settings to the desired period. My othe
The indicator very accurately determines the levels of the possible end of the trend and profit fixing. The method of determining levels is based on the ideas of W.D.Gann, using an algorithm developed by his follower Kirill Borovsky. Extremely high reliability of reaching levels (according to K. Borovsky  - 80-90%) Indispensable for any trading strategy – every trader needs to determine the exit point from the market! Precisely determines targets on any timeframes and any instruments (forex, met
"Piranha" - an autonomous trading system that determines overbought and oversold levels on the chart. Red and blue zones represent overbought and oversold levels respectively. Entry points are marked with arrows: a downward arrow in the red zone for "sell" and an upward arrow in the blue zone for "buy". The Take profit level is indicated by the green moving average. Key features: Adjusting the Take profit level as the green moving average changes position. Averaging ability when a new market e
Quantum平均足PRO のご紹介 市場のトレンドに対する明確な洞察を提供するように設計された平均足キャンドルは、ノイズを除去し、誤ったシグナルを排除する能力で知られています。混乱を招く価格変動に別れを告げ、よりスムーズで信頼性の高いチャート表現を導入しましょう。 Quantum Heiken Ashi PRO を真にユニークなものにしているのは、従来のローソク足データを読みやすい色のバーに変換する革新的なフォーミュラです。赤と緑のバーはそれぞれ弱気トレンドと強気トレンドをエレガントに強調し、潜在的なエントリーポイントとエグジットポイントを驚くほど正確に見つけることができます。 量子EAチャネル:       ここをクリック MT4のバージョン:       ここをクリック この注目すべき指標には、いくつかの重要な利点があります。 明確性の向上: 価格変動を平滑化することで、平均足バーは市場トレンドをより明確に表現し、有利な取引機会を特定しやすくします。 ノイズの削減: 誤ったシグナルを引き起こすことが多い不安定な価格変動に別れを告げます。 Quantum Heik
現在33%オフ 初心者にもエキスパートトレーダーにも最適なソリューション このインジケーターは独自の機能と新しい公式を多数内蔵しており、ユニークで高品質かつ手頃な取引ツールです。このアップデートでは、2つの時間枠ゾーンを表示できるようになります。より長いTFだけでなく、チャートTFとより長いTF(ネストゾーンを表示)の両方を表示できます。すべてのSupply Demandトレーダーの皆さんのお気に召すはずです。:) 重要情報の公開 Advanced Supply Demandの可能性を最大化するには、 https://www.mql5.com/ja/blogs/post/720245 にアクセスしてください。   エントリーまたはターゲットの正確なトリガーポイントを正確に特定できれば取引がどのように改善されるか想像してみてください。新しい基盤となるアルゴリズムに基づいて構築されているため、買い手と売り手の間の潜在的な不均衡をさらに簡単に特定できます。これは、最も強い需要と供給のゾーンと、過去のパフォーマンス(古いゾーンを表示)がグラフィカルに表現されるためです。これらの機能は、最適
ADR反転インジケーターは、通常の1日の平均レンジに関連して価格が現在取引されている場所を一目で示します。価格が選択した平均範囲とレベルを超えると、ポップアップ、電子メール、またはプッシュを介して即座にアラートを受け取るため、プルバックと逆転にすばやくジャンプできます。インディケータは、チャート上に1日の平均レンジの極値で水平線を描画し、それらを超える価格の数学的確率が付加されているレベルを超える延長も描画します。詳細については、以下をご覧ください... インジケーターとモニターを補完するADRアラートダッシュボードここでも利用可能なすべてのペア:https:// www.mql5.com/en/market/product/66316 MT4バージョンはこちらからも入手できます:https:// www.mql5.com/en/market/product/62757 通常の1日平均レンジ(ADR)内で価格が取引され、これらのレベルを上回っている時間の約60%は、通常、その後の引き戻し(利益確定)の動きを伴う急激な価格の動きの指標です。毎日の範囲の上部または下部からのプルバ
Gartley Hunter Multi - An indicator for searching for harmonic patterns simultaneously on dozens of trading instruments and on all possible timeframes. Manual (Be sure to read before purchasing) | Version for MT4 Advantages 1. Patterns: Gartley, Butterfly, Shark, Crab. Bat, Alternate Bat, Deep Crab, Cypher 2. Simultaneous search for patterns on dozens of trading instruments and on all possible timeframes 3. Search for patterns of all possible sizes. From the smallest to the largest 4. A
TPA True Price Action indicator reveals the true price action of the market makers through 100% non-repainting signals strictly at the close of a candle! TPA shows entries and re-entries, every time the bulls are definitely stronger than the bears and vice versa. Not to confuse with red/green candles. The shift of power gets confirmed at the earliest stage and is ONE exit strategy of several. There are available now two free parts of the TPA User Guide for our customers. The first "The Basics"
** All Symbols x All Timeframes scan just by pressing scanner button ** ***Contact me after purchase to send you instructions and add you in "123 scanner group" for sharing or seeing experiences with other users. After 17 years of experience in the markets and programming, Winner indicator is ready. I would like to share with you! Introduction The 123 Pattern Scanner indicator with a special enhanced algorithm is a very repetitive common pattern finder with a high success rate . Interestingly,
初心者やエキスパートトレーダーに最適なソリューション! このインジケーターは、独自の機能と新しい計算式を取り入れた、ユニークで高品質、かつ手頃な価格のトレーディングツールです。たった1枚のチャートで28の為替ペアの通貨強度を読み取ることができます。新しいトレンドやスキャルピングチャンスの引き金となるポイントを正確に特定することができるので、あなたのトレードがどのように改善されるか想像してみてください。 ユーザーマニュアルはこちら  https://www.mql5.com/en/blogs/post/697384 これが最初の1本、オリジナルだ! 価値のないクローンを買わないでください。 特別な サブウィンドウの矢印で強い通貨の勢いを表示 GAPがあなたのトレードを導く! 基準通貨や気配値が売られすぎ・買われすぎのゾーン(外相フィボナッチレベル)にあるとき、個別チャートのメインウィンドウに警告表示。 通貨がレンジの外側から反落した場合、プルバック/リバーサルのアラート。 クロスパターンの特別なアラート 複数の時間枠を選択可能で、トレンドを素早く確認できます。通貨強
**   All Symbols   x   All Timeframes   scan just by pressing scanner button ** *** Contact me after the purchase to send you instructions and add you in "Trend Reversal group" for sharing or seeing experiences with other users. Introduction: Trendlines are the most famous technical analysis in trading . Trendlines continually form on the charts of markets across all the different timeframes providing huge opportunities for traders to jump in and profit on the action. In the other hand,  The tre
このダッシュボードは、選択されたシンボルの最新の利用可能なハーモニックパターンを表示するので、時間を節約し、より効率的に /   MT4バージョン 。 無料インジケーター:   Basic Harmonic Pattern インジケーター列 Symbol : 選択したシンボルが表示されます。 Trend :   強気または弱気 Pattern : パターンの種類(ガートレー、バタフライ、バット、カニ、サメ、サイファー、ABCD) Entry : エントリー価格 SL: ストップロス価格 TP1: 1回目の利食い価格 TP2: 2回目の利食い価格 TP3:   3回目の利食い価格 Current price :   現在値 Age (in bars):    最後に描画されたパターンの年齢 主な入力項目 Symbols:   "28 Major Currency Pairs "または "Selected Symbols "から選択。 Selected Symbols:   カンマで区切られた監視したいシンボル("EURUSD,GBPUSD,XAUUSD")。ブローカーが
次世代の自動化された需要と供給のゾーン。どのチャートでも機能する新しい革新的なアルゴリズム。すべてのゾーンは、市場の価格行動に従って動的に作成されています。 2種類のアラート --> 1) 価格がゾーンに達したとき 2) 新しいゾーンが形成されたとき もう 1 つの役に立たない指標はありません。実績のある完全な取引戦略を手に入れることができます。     新機能:     価格が需給ゾーンに達したときにアラートを出す     新しい需給ゾーンが作成されたときにアラートを発します     プッシュ通知アラート     ピップ単位のゾーン幅ラベル     MTF のもう 1 つのタイムフレーム。したがって、現在より 2 時間足高いのではなく、現在より 3 時間足し上に見えるようになります。     アラート/ゾーン/MTF 機能を有効/無効にするボタン あなたが得る利点:     取引から感情を取り除きます。     取引エントリをオブジェクト化します。     確率の高いセットアップで利益
作者のその他のプロダクト
The utility draws pivot levels based on a selection from day week month The previous candlestick of the selected timeframe is taken and the values for the levels are calculated using the following formulas: Pivot = (high + close + low) / 3 R1 = ( 2 * Pivot) - low S1 = ( 2 * Pivot) - high R2 = Pivot + (R1 -S1) R3 = high + ( 2 * (Pivot - low)) S2 = Pivot - (R1 - S1) S3 = low - ( 2 * (high - Pivot)); The style and thickness for all lines are adjusted. The colors for the R, Pivot and S line
FREE
RSI Chart Levels
Nikolay Mitrofanov
5 (6)
The indicator draws levels based on the overbought and oversold values ​​of the RSI indicator. The maximum values ​​are taken into account, which are equal to or exceeded certain limits. That is, for example, when the price has gone into the overbought zone, the highest price is selected from all prices in this zone for this period of time, and as soon as the indicator value returns to a value below the overbought value, the level is fixed and the calculation of new values ​​begins. The sam
FREE
The indicator makes calculations based on data obtained from one of seven (7) moving averages and colors the chart. Simple moving averages are those that have only one important calculation parameter - the period. The shift in the indicator is not used. There is a shift trick setting, it is used to smooth the result of calculations. You can see the changes if you reduce this parameter to 1 (minimum value). shift trick must always be less than the period value. Available averages: MA
FREE
Calculates pivot levels. It paints the histogram depending on the location of prices relative to these levels. Parameter values: style - select the type of display (Histogram, Line, Arrow) price - price, has little effect on the final look, but this can be customized timeframe - select a timeframe for calculating levels. color over pivot line - color of everything above the pivot level color under pivot line - color of everything below the pivot level pivot line intersection color - the color
FREE
Looks for strong price movements and draws levels upon their completion. You determine the strength of the movement yourself by specifying in the settings the number of points and the number of candles of the same color in a row in one direction. There are 2 types of building in the settings: extrenum - high / low close - close price You can also adjust the number of displayed levels and the number of candles for calculations. By default, the settings indicate 5 levels for 360 candles.
FREE
The indicator highlights in color the places on the chart where the price moves in one direction continuously from the selected number of candles. You can specify the number of points from the beginning of the movement to select only movements from this amount. It can be useful for looking for reversals or sharp impulses. I also recommend purchasing this utility to determine local weekly / monthly trends and support and resistance lines. https://www.mql5.com/en/market/product/61401
FREE
The indicator draws a normal chart by coloring it in colors based on prices calculated by the Heiken Ashi indicator algorithm. That is, the shape of the candles does not change. In fact, this is the same Heiken Ashi that does not distort the price chart. Then there will be a drawing of a cat, because there is nothing more to write about the indicator. .                                                       
FREE
The utility draws reversal levels using the formulas for each of the selected number of candles: Pivot = (high + close + low) / 3 R1 = ( 2 * Pivot) - low S1 = ( 2 * Pivot) - high R2 = Pivot + (R1 -S1) R3 = high + ( 2 * (Pivot - low)) S2 = Pivot - (R1 - S1) S3 = low - ( 2 * (high - Pivot)) H = high L = low U = if the candle is bullish, then close. Otherwise - open D = if the candle is bullish, then open. Otherwise - close On any timeframe. After a new candle closes on the calculated timefr
FREE
Draws trend lines from the high and / or low values ​​of the week. The color and thickness of the levels are customizable. All trend lines can be edited. Suitable levels of the past can be renamed and other properties changed. Levels are re-read only on the H1 timeframe once an hour. ...
FREE
Trendline Equalizer
Nikolay Mitrofanov
1.5 (2)
When creating, modifying and moving a trend line, two anchor points will be selected: high / low, open / close, median or weighted from the candlestick prices. For high / low, open / close, if the anchor point is above the candlestick, the upper price will be taken, below the candlestick - the lower one. If the point is inside the candlestick, then if the first point is higher than the second, then the first one goes up, the second goes down. Conversely, if the second is higher than the first
FREE
The indicator converts two moving averages into histograms and paints their intersection area. There is a shift trick setting, it is used to smooth the result of calculations. You can see the changes if you reduce this parameter to 1 (minimum value). Available averages: MA Simple MA Exponential MA LinearWeighted MA Smoothed DEMA TEMA and RSI - as a bonus By default, the fast MA is displayed at the top of the histogram, and the slow one at the bottom. You can swap them if you like. shi
FREE
The indicator paints the candlesticks of the chart in colors calculated from the values of the strengths of the bulls and bears. It works like this: The values of the two indicators Bears and Bulls are taken, and who is stronger on the candlestick is compared. It's all. .
FREE
フィルタ:
Tiofelo Da Olga Gilbert Teles
1396
Tiofelo Da Olga Gilbert Teles 2022.05.21 19:15 
 

Good Morning! I liked the Fight of Forces Histogram indicator, congratulations for the excellent work. Could you give me the "index buffer". Thanks again!

Nikolay Mitrofanov
14505
開発者からの返信 Nikolay Mitrofanov 2022.05.22 05:33
Good Morning! If you mean the places where the indicator values are placed for building a histogram, then in the code, index 0 contains data, and index 1 contains color.
Detleff Böhmer
2602
Detleff Böhmer 2021.03.30 10:22 
 

Gute Arbeit Nicolay, diesen Indikator habe ich auf jedem Chart. verlässliche Signale von H1 bis D1. Danke fürs teilen.

レビューに返信
バージョン 1.22 2022.02.01
Рефакторинг
バージョン 1.21 2022.01.31
Рефакторинг.
Добавлена настройка подсветки свечей, где происходила сильная борьба и сопротивление медведей и быков.
バージョン 1.2 2022.01.30
Добавлена настройка выбора расчетов.
При true будет вычисляться абсолютное значение разницы между значениями двух индикаторов с учетом направления сил.
Короче, немного изменится вид гистограммы.
バージョン 1.1 2021.03.29
Добавлена возможность усилить результат тиковым объёмом.