Ichimoku Map MT5
- インディケータ
- Pavel Verveyko
- バージョン: 1.6
- アップデート済み: 23 1月 2023
- アクティベーション: 5
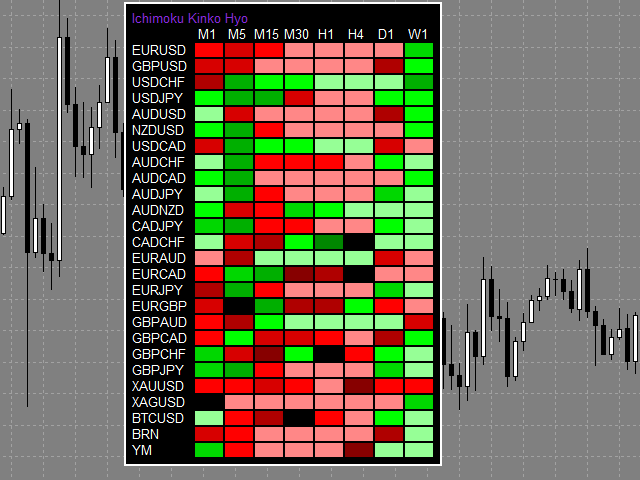
Ichimoku Map (instant look at the markets) - built on the basis of the legendary Ichimoku Kinko Hyo indicator.
The task of the Ichimoku Map is to provide information about the market strength on the selected time periods and instruments, from the point of view of the Ichimoku indicator.
The indicator displays 7 degrees of buy signal strength and 7 degrees of sell signal strength.
The stronger the trend, the brighter the signal rectangle in the table.
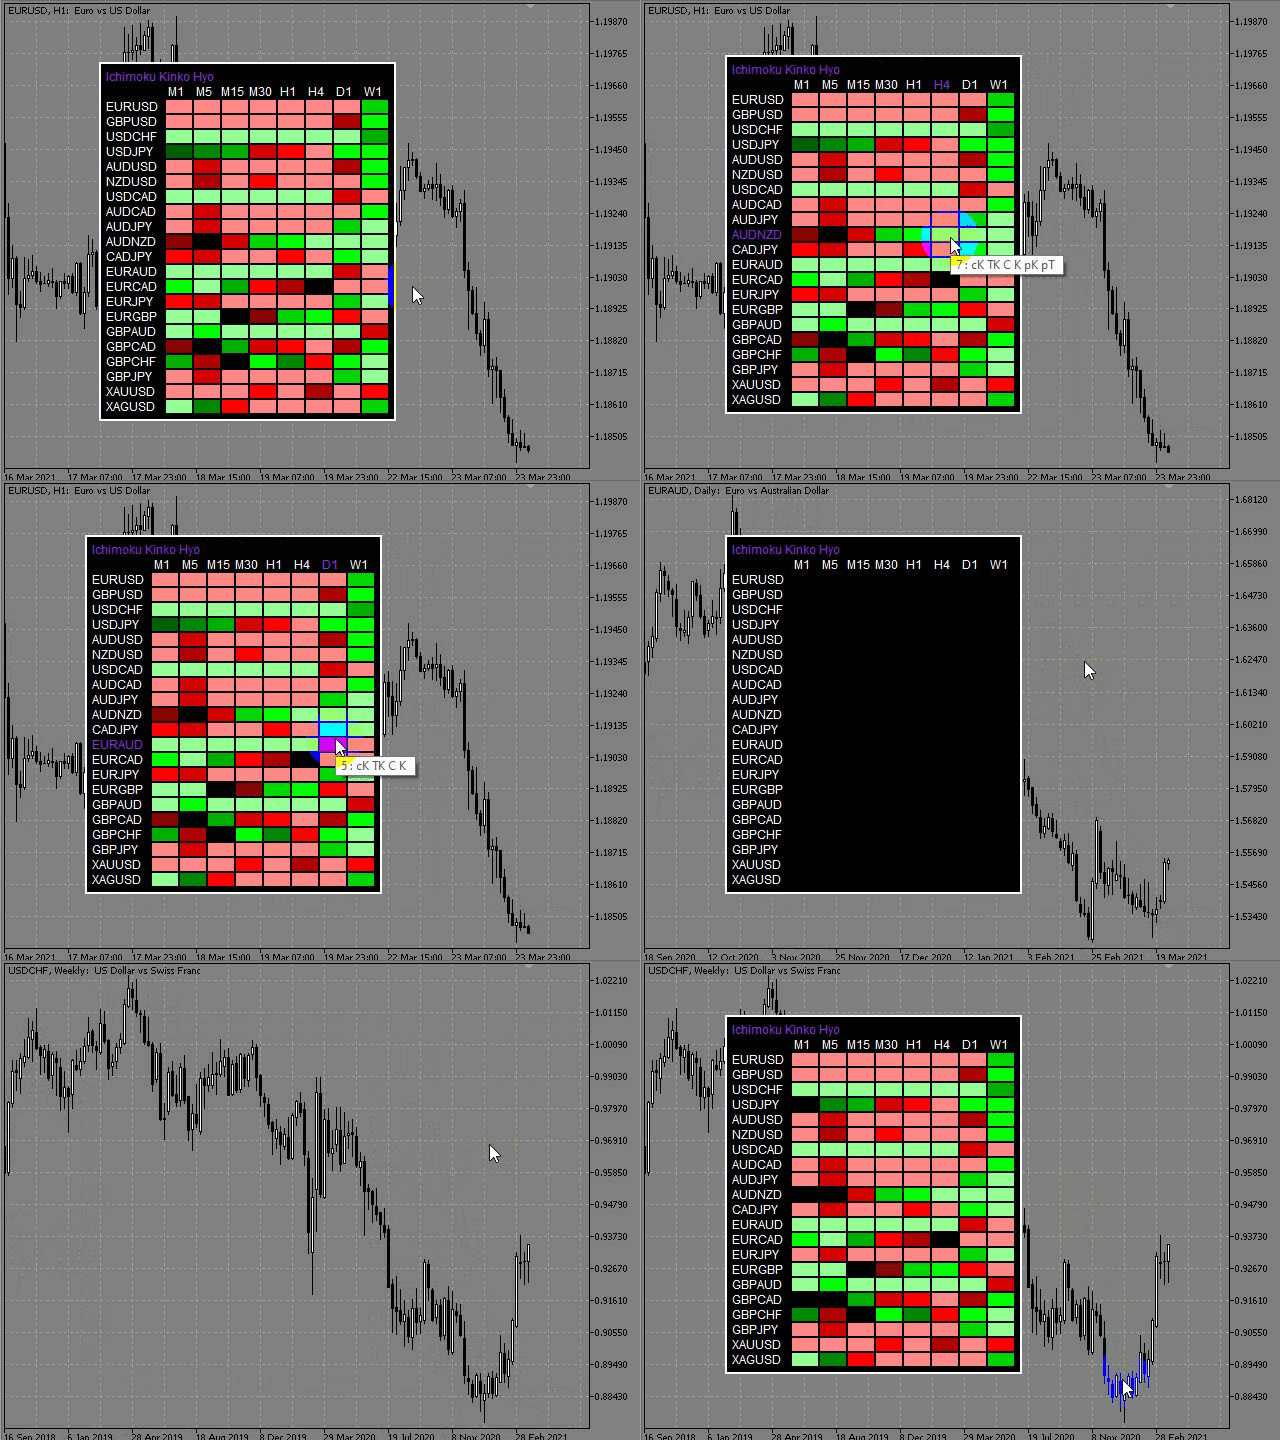
The table can be dragged with the mouse.
The size of the table depends on the font size selected in the settings.
When you hover the mouse cursor over a rectangle, the tooltip displays the signal strength and the description of the situation, as well as the tool and the time period that this rectangle corresponds to.
When you click on the selected rectangle of the table, the tool and/or time period changes or a new chart window opens.
If Current_Chart is selected in the New_Chart_or_Current_Chart setting, then the time period and the tool will be changed to those that correspond to the selected rectangle.
If New_Chart is selected in the New_Chart_or_Current_Chart setting, a new window with a graph will be opened, the time period and tool of which correspond to the selected rectangle.
In the Template_name_for_New_Chart setting, you can specify a chart template with which a new window will be opened.
Signal strength and interpretation of terms
- Each signal changes the degree of signal strength:
- cK - Kumo color (clouds) +1 point.
- TK - Golden and Dead Cross +1 point.
- C - Chinkou confirmation +1 point.
- K - Kumo Breakout (Clouds) +2 points.
- pK - Kijun Breakout +1 point.
- pT - Tenkan Breakout +1 point.
- !K - The price is in the cloud(Kumo) -1 point.
Settings
- Tickers - Tools to be displayed in the table (separated by commas).
- TimeFrames - Time periods to be displayed in the table (separated by commas).
- Table_Refresh_Rate (in seconds) - the refresh rate of the table is measured in seconds.
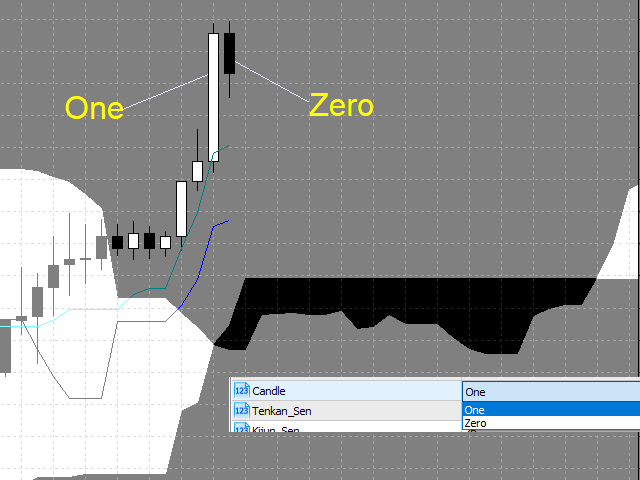
- Candle - if Candle=One, the indicator works with the last closed candle and does not redraw.
If Candle=Zero, the indicator works with the last open candle. - In other indicator settings, you can change the color of the signal rectangles, font, font size, table background color, table font color, as well as the classic parameters of the Ichimoku indicator.
- New_Chart_or_Current_Chart - the mode of opening a new chart: in a new window or changing the instrument and time period in the window in which the indicator is running.
- Template_name_for_New_Chart - the name of the template with which the new chart will be opened.
Ichimoku is an indicator developed in the 1930s by the Japanese analyst Goichi Hosoda, who published under the pseudonym Sanjin Ichimoku, to predict the movement of the Japanese Nikkei stock index.
The Ichimoku indicator combines several approaches to market analysis and is designed to identify trends, support and resistance lines, and generate buy/sell signals.
Hosoda Goichi spent more than thirty years perfecting his indicator and published the results only in 1968.
Ichimoku - can be roughly translated as "instant look at the balance".

