Supply Demand RSJ
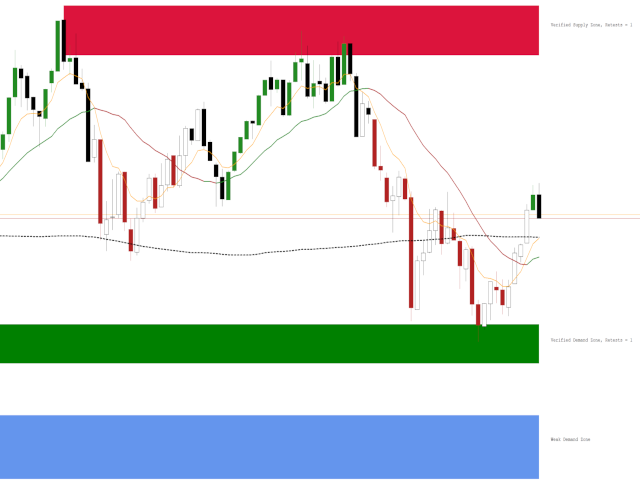
インジケータSupplyDemand RSJ PROは、グラフ上に「Supply」ゾーンと「Demand」ゾーンを計算してプロットし、ゾーンのタイプ(弱い、強い、検証済み、証明済み)を識別し、ゾーンの再テストの場合は、その回数を示します。再テストされました。
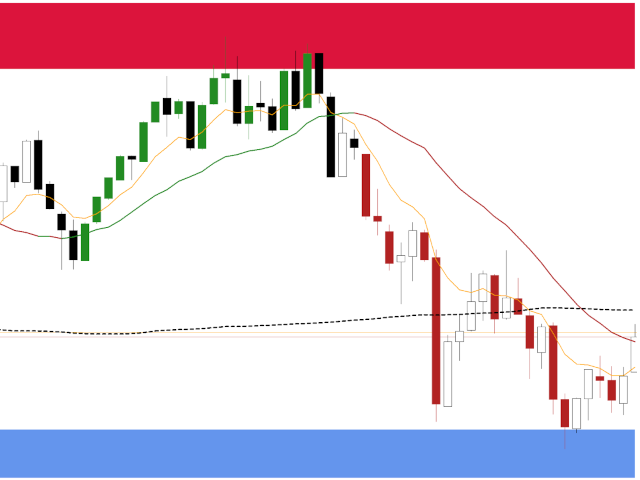
「供給」ゾーンは、需要よりも供給が多く発生し、価格が下がる価格ゾーンです。
「需要」ゾーンは、供給よりも多くの需要が発生し、価格を押し上げる価格ゾーンです。
構成可能な機能とアラートを備えたプロフェッショナルバージョンをぜひお試しください:Suppy Demand RSJ PRO
ゾーンの分類
- 弱い:再テストされた場合、違反される可能性が高い価格地域。
- 強い:トレンドの方向を変えており、すぐに再テストされる可能性が低い価格地域。
- 検証済み:価格が高い地域。最大で1〜3回の再テストがありましたが、価格が地域を破ることはできませんでした。
- 実証済み:3回以上の再テストがあったが、価格がこの地域を突破できなかった、価格の高い地域。
- 壊れた/ターンコート:壊れた価格領域。サポートの場合は抵抗になり、抵抗の場合はサポートになります。
設定
- ゾーンのラベルと情報を表示する:真のケースでは、ゾーンの右側にゾーンのタイプと、該当する場合は再テストの数が書き込まれます。
- 注:チャートシフトオプションがアクティブな場合にのみ機能します。
- フォントの色:テキストの色を設定します
- フォントサイズ:フォントサイズを設定します


ユーザーは評価に対して何もコメントを残しませんでした