Current Order Take Profit
- ユーティリティ
- Boguslaw Nejmanowski
- バージョン: 9.0
- アップデート済み: 25 3月 2021
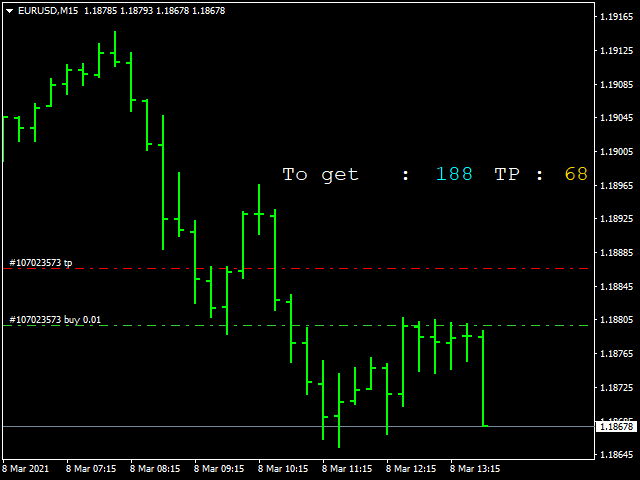
Current Order Take Profit
this indicator shows settled level of Take profit current opened order. If order Take Profit will be changed it will be shown on screen immediately.
The same with pips left to get so as to close the position. If the price will drop beneeth the open order price it will change the color of pips digits left to gain.
That is usefull when you change Take profit level by drag the price line using mouse to new level na wykresie.