• 概要
  • レビュー
  • コメント (1)
  • 最新情報

All Candlesticks Library

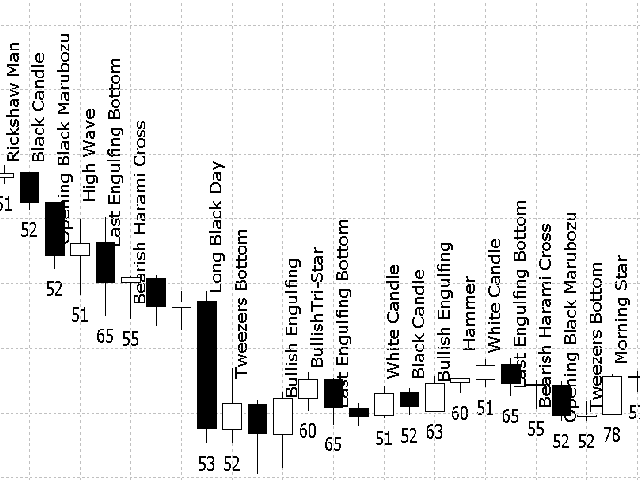
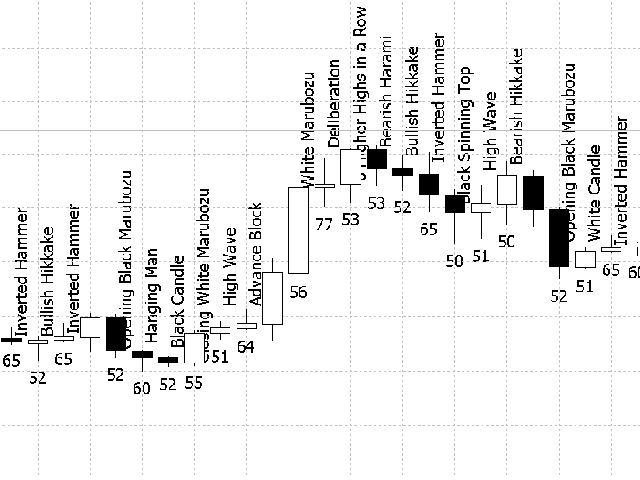
すべてのローソク足ライブラリは、ローソク足のバリエーションの本当に広い範囲を備えたインテリジェントなパターン認識システムを提供するインジケーターです! 一般的な同事や統合のバリエーションから、よく知られている勢いやブレイクアウトキャンドル、日常では見られない珍しいパターンまで、100を超えるキャンドルパターンがあります。

さらに、(100%正確ではありませんが、十分に公平な)統計が付属しています! キャンドルホルダーを表示するかどうかを選択し、それぞれのテキスト間隔、フォントの色とサイズを変更できます。


この指標は、特定の研究のための2年間の仕事からのものであり、99回のアクティベーションで購入できるようになりました。 それはあなたのために取引されていませんが、あなたはそれを欲するでしょう! (すぐに...)

はい、長期的には最新の状態に保たれます。


おすすめのプロダクト
There are 8 types of this indicator. Consisted of 1. Bullish and Bearish Engulfing 2. Morning and Evening Star 3. Three Green Soldiers and Three Red Crows 4. Three Inside Up and Down 5. Three Outside Up and Down 6. Bullish and Bearish Harami 7. Tweezers Top and Bottom 8. Piercing and Dark cloud cover Signal Filter :: 1. The appearance of the candle stick 2. SMA 3. 2EMA :: EMA Fast and EMA Slow 4. RSI N otification :: 1. Via screen 2. Email 2. Phone For trading 1. Scaling 2. Binary options
Supply and Demand Monster MT4
Tsog Erdene Borjigon Enkhkhudulmur
Supply and demand zones are at the heart of   supply and demand trading . These zones are areas that show  liquidity at a specific price.  The supply zone is also called the distribution zone, while the demand zone is called the accumulation zone.   Our indicator automatically draw supply and demand zones in Metatrader 5. It give opportunity to understand trading zone and avoiding risk.
BSA indicator is a ZigZag based indicator. This indicator is used to find the reversal level of the price. You can use the existing risk ratio and calculation timeframe in the entries by optimizing them according to your usage preference.  In lower time frames, the indicator can repaint. For healthier results, you can detect the least repainting by observing for a while according to the graphic you will apply.
The indicator is designed to work on any trading platform. The program is based on proprietary algorithms and W.D.Ganna's mathematics, allowing you to calculate target levels of price movement based on three points with the highest degree of certainty. It is a great tool for stock trading. The indicator has three buttons: NEW - call up a triangle for calculation. DEL - delete the selected triangle. DELS - completely remove all constructions. The probability of achieving the goals is more than 80
Limitless MT4は、すべての初心者と経験豊富なトレーダーに適したユニバーサルインジケーターです。 すべての通貨ペア、暗号通貨、生の株式で動作します 無制限のMT4-構成済みで、追加の構成は不要 そして今、主なもの なぜ無制限のMT4なのか? 1再描画の完全な欠如 2トレーディングの最高のスペシャリストによる2年間のテスト 3正しい信号の精度が80%を超える 4ニュースリリース中の取引で好調 取引ルール 1買いシグナル-青い上向き矢印の出現 下向きの赤い矢印の外観を販売するシグナル シグナル後の次のローソク足で取引を開始するには2 3テイクプロフィット チャート上 М1-40ピップ М5-50ピップ М15-55-60ピップ 4ストップロスは利益をとる 5誤った信号をフィルタリングするために、 パラボリックSAR-トレンドとのトレードへの参入を除外する移動平均または同様のトレンドインジケーター。 
The Before indicator predicts the most likely short-term price movement based on complex mathematical calculations. Most of the standard indicators commonly used in trading strategies are based on fairly simple calculations. This does not mean that there were no outstanding mathematicians in the world at the time of their creation. It is just that computers did not yet exist in those days, or their power was not enough for the sequential implementation of complex mathematical operations. Nowa
Cycles Predictor Indicator This indicator uses past market cycles to predict future price movements. The indicator scans through past data and considers  combinations  of cycles. When cycles  coincide  at the same future date/time then it is considered a valid future prediction. The predictions are drawn as vertical lines on the right side of the chart in the future. A prediction will often result in type of candle (ex. bull or bear) and/or a reversal point (ex. bottom or top) forming at this ex
The indicator scans for stop grabber (special pattern of Joe Dinapoli which gives very high probability buy / sell signals and does not repaint ) signals in multiple timeframes for the all markets filtered and shows the results on Dashboard. Key Features Dashboard can be used for all markets It can scan for stop grabber pattern on MN1, W1, D1, H4, H1, M30, M15 ,M5, M1 timeframes Parameters UseMarketWatch: Set true to copy all symbols available in market watch MarketWatchCount : Set the numbe
Instantly spot simple candlestick patterns with MSHT Price Pattern MSHT PRICE PATTERN can automatically detect more than 200 different candlestick patterns, including multi-candle patterns. This makes it easy for you to see if what you care about is present on a chart or not at a glance, and reduces the amount of time you have to stare at charts to check off items on your investment checklist. Candlestick Pattern Recognition is supported on charts, alerts, in scanners and smart checklists. A
Advanced Supply Demand
Bernhard Schweigert
4.9 (271)
現在33%オフ 初心者にもエキスパートトレーダーにも最適なソリューション このインジケーターは独自の機能と新しい公式を多数内蔵しており、ユニークで高品質かつ手頃な取引ツールです。このアップデートでは、2つの時間枠ゾーンを表示できるようになります。より長いTFだけでなく、チャートTFとより長いTF(ネストゾーンを表示)の両方を表示できます。すべてのSupply Demandトレーダーの皆さんのお気に召すはずです。:) 重要情報の公開 Advanced Supply Demandの可能性を最大化するには、 https://www.mql5.com/ja/blogs/post/720245 にアクセスしてください。   エントリーまたはターゲットの正確なトリガーポイントを正確に特定できれば取引がどのように改善されるか想像してみてください。新しい基盤となるアルゴリズムに基づいて構築されているため、買い手と売り手の間の潜在的な不均衡をさらに簡単に特定できます。これは、最も強い需要と供給のゾーンと、過去のパフォーマンス(古いゾーンを表示)がグラフィカルに表現されるためです。これらの機能は、最適
Easy Backtest Backtesting your trading strategy is the most important thing which every successful trader knows very well. Easy Backtest is the perfect solution to test your new strategy in Strategy Tester in your MT4 , using all available historical data. You can place orders: BUY , SELL , pending orders with Stop Loss and Take Profit , and you can modify them at any time. You can close orders individually or all at once, and also  breakeven the same like you do it in live trading. The play
FREE
Deal Trading SPT
Sukunthakan Ngernbamrung
Deal Trading SPT (Super Trend) is an indicator, shows the market trend direction, entry position, take profit level, stop loss level and trend strength. Utility Help to further filter and develop strategy to trade Market overview on the chart Stop loss and take profit calculation with market volatility Resistance and support for trialing stop No repaint after the finished bar Works in any timeframe and financial instrument, including forex, CFD and crypto etc. Message pop-up, notification wi
This index can be traced back to historical transactions, and can clearly see the trading location, trading type, profit and loss situation, as well as statistical information. Showlabel is used to display statistics. Summy_from is the start time of order statistics. This parameter is based on the opening time of the order. Backtracking can help us to correct the wrong trading habits, which is very important for beginners to learn manual transactions. This index is suitable for each time
トレンドトレーディング は、タイミングのプルバックとブレイクアウトにより、市場で起こっているトレンドから可能な限り利益を得るように設計された指標です。確立されたトレンドの中で価格が何をしているかを分析することにより、取引の機会を見つけます。 [ インストールガイド | 更新ガイド | トラブルシューティング | よくある質問 | すべての製品 ] 自信を持って効率的に金融市場を取引する むち打ちにならずに確立されたトレンドから利益を得る 収益性の高いプルバック、ブレイクアウト、早期の逆転を認識する この指標は、独自の品質とパフォーマンスを分析します 複数時間枠のダッシュボードを実装します インジケーターは再描画されていません 電子メール/音声/視覚アラートを実装します 確立されたトレンドは多くの取引機会を提供しますが、ほとんどのトレンド指標はそれらを完全に無視しています。インジケーターの解釈はかなり簡単です: (1) トレンドの変化 (2) トレンドの方向への後退 (3) トレンドの方向へのブレイクアウト 赤いダッシュ は下降トレンド中の修正です 青いダッシュ は上昇ト
VR Cub
Vladimir Pastushak
VR Cub は、質の高いエントリーポイントを獲得するためのインジケーターです。このインジケーターは、数学的計算を容易にし、ポジションへのエントリーポイントの検索を簡素化するために開発されました。このインジケーターが作成されたトレーディング戦略は、長年にわたってその有効性が証明されてきました。取引戦略のシンプルさはその大きな利点であり、初心者のトレーダーでもうまく取引することができます。 VR Cub はポジション開始ポイントとテイクプロフィットとストップロスのターゲットレベルを計算し、効率と使いやすさを大幅に向上させます。取引の簡単なルールを理解するには、以下の戦略を使用した取引のスクリーンショットを見てください。 設定、設定ファイル、デモ版、説明書、問題解決方法は、以下から入手できます。 [ブログ] レビューを読んだり書いたりすることができます。 [リンク] のバージョン [MetaTrader 5] エントリーポイントの計算ルール ポジションをオープンする エントリーポイントを計算するには、VR Cub ツールを最後の高値から最後の安値までストレッチする必要があります。
Trend Scanner
Vladimir Kalendzhyan
4.33 (6)
By purchasing this indicator, you have the right to receive a free copy of one of   my other indicator's or advisor’s!  (All future updates are included. No limits) . To get it , please contact me by  mql5 message ! The Trend Scanner trend line indicator displays the trend direction and its changes. The indicator works on all currency pairs and  timeframes. The indicator simultaneously displays multiple readings on the price chart: the support and resistance lines of the currency pair, the exist
Mr Beast Cobertura
Luis Mariano Vazquez Marcos
Mr Beast Super Hedge Asesor experto diseñado para trabajar encerrando el precio entre 2 valores hasta que rompa en una dirección tanto de compra como de venta. Este robot de trading de Forex ha sido desarrollado por MRBEAST como una herramienta para facilitar el trading intradía. Tenga en cuenta que el uso de este robot implica ciertos riesgos y no garantiza ganancias consistentes en el mercado de divisas. El robot de trading se basa en algoritmos y estrategias que he diseñado, los cuales se han
Добрый День уважаемые трейдеры!  Вашему вниманию индикатор созданный и работающий на базе трендовика ADX,  для торговли на смене направления движения который учитывает коррекцию и даёт возможность на ней заработать.  Применяю этот индикатор для скальпинга. Рекомендую таймфреймы от 15 ти минутного(М15) до часового (Н1) периодов.  Красный кружок сигнал на продажу- Sell) Зелёный кружок  сигнал на покупку Buy) Чем меньше ваш таймфрейм тем меньше пунктов вы зарабатываете.   Важно выставлять стопы! !В
Tron Scalperは、スキャルピングのために設計された新しい著者の指標です。 標準的な、専有用具の全範囲の読書に基づいて信号を与える表示器。 トロンのダフ屋の主な特長: 分析関数 これは、任意の通貨ペアと時間枠で使用することができます; インジケーターは再描画されません; それは他の指標に大きな追加です; グラフィカルな機能 チャート上の最小位置数を占めています; 柔軟性のあるチンキ; 簡単に学ぶことができます;   Tronダフ屋はから成っています。.. 青い線はRSIインジケータです; オレンジ色のラインは、T3RSIに基づく統合RSIインジケータです; 点線-ボリンジャーバンドの境界線; 青い線はボリンジャーバンドの中央線です;  トロンのダフ屋の主な特長: フィルタリングのための指標のセットを持っています; 指標自体は、いつ市場に参入する必要があるかを示しています; トロン-ダフ屋の基本設定: RSI期間-RSIの青い線を設定する;  バンド期間-点線の調整;  MA期間-移動平均の設定;  バンド偏差-バンド偏差;
Black series MT4 - The indicator is designed for trading on binary options with Timeframe M1-M5-M15 Multicurrency (Works on cryptocurrency and currency pairs) The signal appears when the candle opens Up to 90% correct signals There is no signal redrawing at all Can be used with other indicators. Good for scalping! In Settings there is: -Indicator working methods -I Allert Arrow color Red signal down Blue signal up Also watch the video how the indicator works and signals
This indicator depends on High and Low price of currency in the last day, and then I made some secret equations to draw 10 lines. Features You will know what exactly price you should enter the market. You will know when to be out of market. You will know what you should do in market: Buy Sell Take profit, and there are three levels to take your profit Support Resistance Risk to buy Risk to sell Signal Types and Timeframes Used You can use this indicator just on (M1, M5, M15, M30, H1) timefra
This indicator finds Three Drives patterns. The Three Drives pattern is a 6-point reversal pattern characterised by a series of higher highs or lower lows that complete at a 127% or 161.8% Fibonacci extension. It signals that the market is exhausted and a reversal can happen. [ Installation Guide | Update Guide | Troubleshooting | FAQ | All Products ] Customizable pattern sizes Customizable colors and sizes Customizable breakout periods Customizable 1-2-3 and 0-A-B ratios It implements visua
Indicator plots price cycle blocks and sends signals with smart volume confirmation. Price cycles and fractals are combined to determine the demand/supply blocks. The indicator can be used alone or combined with other Cycle Indicators Inputs: Period: Recommended value is between 35 and 55( Which are Set 1 and Set 2 periods of cycle sniper ) Engulfing: If true, you will be able to see the engulfing bar confirmation. Volume Filter: True (The  arrow comes with volume confirmation ) Videos with dif
This indicator shows price changes for the same days in past years. D1 timeframe is required. This is a predictor indicator that finds D1 bars for the same days in past 8 years and shows their relative price changes on the current chart. Parameters: LookForward - number of days (bars) to show "future" price changes; default is 5; Offset - number of days (bars) to shift back in history; default is 0; ShowAverage - mode switch; true - show mean value for all 8 years and deviation bounds; false - s
FREE
Mars 5     is a powerful indicator of   TREND   for any par and any timeframe. It doesn't requires any additional indicators for the trading setup.The indicator gives clear signals about opening and closing trades.This Indicator is a unique, high quality and affordable trading tool. Perfect For New Traders And Expert Traders Low risk entries. Never repaints signal. Never backpaints signal. Never recalculates signal. For MT4 Only Great For Scalping Great For Swing Trading Arrow Entry Alerts Po
ACB Breakout Arrows
KEENBASE SOFTWARE SOLUTIONS
4.12 (33)
The ACB Breakout Arrows indicator provides a crucial entry signal in the market by detecting a special breakout pattern. The indicator constantly scans the chart for a settling momentum in one direction and provide the accurate entry signal right before the major move.  Get multi-symbol and multi-timeframe scanner from here - Scanner for ACB Breakout Arrows MT4 Key features Stoploss and Take Profit levels are provided by the indicator. Comes with a MTF Scanner dashboard which tracks the brea
Trend PA
Mikhail Nazarenko
5 (3)
The Trend PA indicator uses   Price Action   and its own filtering algorithm to determine the trend. This approach helps to accurately determine entry points and the current trend on any timeframe. The indicator uses its own algorithm for analyzing price changes and Price Action. Which gives you the advantage of recognizing, without delay, a new nascent trend with fewer false positives. Trend filtering conditions can be selected in the settings individually for your trading style. The indicator
TMA Channel is a price channel obtained through a special calculation method based on traditional TMA . The channel has upper, middle, and lower tracks . When the price approaches or exceeds the upper track, it is already in an overbought state, and attention should be paid to the situation of reversal and decline; When the price approaches or falls below the lower track, it is already in an oversold state, and attention should be paid to the situation of reversal and rise . The indicator will d
DMAX pro
Danny Teoh Kok Keong
DMAX SIGNAL IS VERY POWERFUL TOOL TO HELP YOU ENTRY,ITS CAN DETECT OVERSOLD AND OVERBOUGHT IN FOREX MARKET. ITS CAN TRADE 24 FOREX PAIR IN MARKET, 80% ACCURATE RESULT. MANY TRADER FAIL BECAUSE OF ENTRY POINT AND EXIT POINT , SIGNAL OF DMAX WILL GIVE VERY GOOD SIGNAL TO LET YOU KNOW WHERE TO ENTRY AND EXIT.  RISK MANAGEMENT IS VERY IMPORTANT IN TRADING FOREX, PLEASE DONT RISK OVER 5% PER TRADE IS FORE MARKET
Trade with super Support and Resistance Breakout system. are you looking for the most sophisticated tools for your daily trading ? this tools are perfect for you, it has a most comprehensive breakout identification spot on all market (Forex, CFD, indice, etc) Limited offer :  10 copy for 30$ Indicator parameter: Depth: to arrange how deep to calculates the support and resistance zone Deviation Back-step the demonstration result you can see on the media file below.
このプロダクトを購入した人は以下も購入しています
まず第一に、この取引インジケーターは再描画されず、再描画されず、遅延しないことを強調する価値があります。これにより、手動取引とロボット取引の両方に理想的なものになります。 ユーザーマニュアル:設定、入力、戦略。 アトミックアナリストは、価格の強さとモメンタムを利用して市場でより良いエッジを見つけるためのPA価格アクションインジケーターです。ノイズや誤ったシグナルを除去し、取引ポテンシャルを高めるための高度なフィルターを備えています。複雑なインジケーターの複数のレイヤーを使用して、アトミックアナリストはチャートをスキャンし、複雑な数学的計算をシンプルなシグナルと色に変換します。これにより、どのような初心者トレーダーでも理解して使用し、一貫した取引の決定を行うことができます。 「アトミックアナリスト」は、新規および経験豊富なトレーダー向けにカスタマイズされた包括的な取引ソリューションです。プレミアムインジケーターとトップノッチの機能を1つの取引戦略に組み合わせ、すべてのタイプのトレーダーにとって汎用性のある選択肢にします。 デイリートレーディングとスキャルピング戦略:高
製品を購入する前に、以下の情報をお読みください。 Apollo Pips PLUS SP はユニークな製品です。これは、私の新しい「アポロ ピップス」インジケーターと、私のすべての取引インジケーターにアクセスできる「スーパー パック」ボーナスを手に入れたい人のためのものです。 Apollo Pips PLUS SP 製品を購入すると、実際には私の Apollo Pips インジケーターのまったく新しいバージョンを購入することになります。このバージョンのインジケーターには改良されたアルゴリズムと使いやすいパラメーターがあり、あらゆる市場およびあらゆる取引スタイルでインジケーターを使用する機会が得られます。 この製品の購入者は、私のスーパーボーナスとして、他のすべてのインジケーターにも無料でアクセスできます!私のすべての取引ツールにアクセスしたい場合は、この製品が最適です!:) しかし、これがすべてではありません!:) この製品のすべての購入者は、私の新しいインジケーターを無料で入手する資格もあります!:)新しい取引インジケーターを利用できるようになりました。私の特権のある「スーパー パッ
最初のパルスレベルを反転 (RFI)     指示する     ロシア     -        utilizar con   el indicador の ESP 推奨事項 -   TPSpro トレンド プロフェッショナル版 -   MT5のバージョン 最も重要なことは、将来においても最も重要なことです。 機能のプリンシパル: ゾーンのほとんどは、ベンダーとコンプラドールによってアクティブ化されます。 状況を直感的に把握できるよう、初期の衝動を修正します。 LOGIC AI: MUESTRA zonas (círculos) parabuscar puntos de entrada cuando se activa una plantilla 視覚的に優れた視覚効果があり、最も重要な機能がすべて揃っていることに注意してください。 優れたニベレス/ゾーンの視覚化 (modo MTF) 世界で最も人気のある場所/ゾーンです。これを使用するのに最適な方法です (   TPSproTREND PRO   )。 アルゴリズム プロフェッショナル セパラド パソ ア パソ パラ オペラ それは
現在20%OFF! 初心者やエキスパートトレーダーのためのベストソリューション! このダッシュボードソフトウェアは、28の通貨ペアで動作しています。それは私達の主要な指標(高度な通貨の強さ28と高度な通貨インパルス)の2に基づいています。それは全体の外国為替市場の大きい概観を与えます。それは、すべての(9)時間枠で28の外国為替ペアのための高度な通貨の強さの値、通貨の動きの速度と信号を示しています。チャート上で1つのインディケータを使用して市場全体を観察し、トレンドやスキャルピングの機会をピンポイントで見つけることができたら、あなたのトレードがどのように改善されるか想像してみてください。 このインディケータには、強い通貨と弱い通貨の識別、潜在的な取引の識別と確認がより簡単になるような機能が搭載されています。このインディケータは、通貨の強さや弱さが増加しているか減少しているか、また、すべての時間枠でどのように機能しているかをグラフィカルに表示します。 新機能として、現在の市場環境の変化に適応するダイナミックなマーケットフィボナッチレベルが追加され、すでに当社のAdvan
Gold Channel is a volatility-based indicator, developed with a specific timing algorithm for the XAUUSD pair, which consists of finding possible corrections in the market. This indicator shows two outer lines, an inner line (retracement line) and an arrow sign, where the theory of the channel is to help identify overbought and oversold conditions in the market. The market price will generally fall between the boundaries of the channel. If prices touch or move outside the channel it is a tra
NAM Order Blocks
NAM TECH GROUP, CORP.
5 (1)
MT4マルチタイムフレームオーダーブロック検出インジケーター。 特徴 -チャートコントロールパネルで完全にカスタマイズ可能で、完全な相互作用を提供します。 -必要な場所でコントロールパネルを表示および非表示にします。 -複数の時間枠でOBを検出します。 -表示するOBの数量を選択します。 -さまざまなOBユーザーインターフェイス。 -OBのさまざまなフィルター。 -OB近接アラート。 -ADRの高線と低線。 -通知サービス(画面アラート|プッシュ通知)。 概要 注文ブロックは、金融機関や銀行からの注文収集を示す市場行動です。著名な金融機関と中央銀行が外国為替市場を牽引しています。したがって、トレーダーは市場で何をしているのかを知る必要があります。市場が注文ブロックを構築するとき、それは投資決定のほとんどが行われる範囲のように動きます。 注文の構築が完了すると、市場は上向きと下向きの両方に向かって急激に動きます。注文ブロック取引戦略の重要な用語は、機関投資家が行っていることを含むことです。それらは主要な価格ドライバーであるため、機関投
Enigmera
Ivan Stefanov
5 (2)
エニグメラ:市場の中核 https://www.enigmera.com はじめに このインディケータと取引システムは、金融市場に対する驚くべきアプローチです。ENIGMERAは、フラクタルサイクルを使用して、サポートとレジスタンスレベルを正確に計算します。本格的な蓄積局面を示し、方向性と目標を示します。 トレンド中でも調整中でも機能するシステムです。 どのように作動するのか? ENIGMERAは、支持線・抵抗線、目標線、乖離線の3つのラインで構成されています。このシステムは、過去のデータを現在と未来に外挿する典型的な市場指標とは異なり、現在の完全な画像を提供します。支持線上にある場合、それは本当の支持を意味し、抵抗線上にある場合、それは本当の抵抗を意味する。ある水準が破られた場合、それはトレンドの変化を意味する。再描画はしない。 市場は常に進化しているため、ENIGMERAはその評価ツールを適応させ、定期的に戦略を修正しています。  これにより、すべてのシナリオが徹底的に評価されることが保証されます。この市場指標の独自性は、その能力を見れば明らかです。  ENIGM
Cycle Sniper
Elmira Memish
4.38 (32)
NEW YEAR SALE PRICE FOR LIMITED TIME!!! Please contact us after your purchase and we will send you the complimentary indicators to complete the system Cycle Sniper is not a holy grail but when you use it in a system which is explained in the videos, you will feel the difference. If you are not willing to focus on the charts designed with Cycle Sniper and other free tools we provide, we recommend not buying this indicator. We recommend watching the videos about the indiactor and system before pu
Bomb Bank シグナル: MetaTrader 4 の信頼度インジケーター Bomb Bank Signal は、金融市場で最も関連性の高いトレンドを特定するように設計された MetaTrader 4 の強力なインジケーターです。動きを正確に予測するツールをお探しなら、Bomb Bank が最適です。 仕組み: このインジケーターは、出来高分析、ローソク足終値、対称トレンドという 3 つの異なる方法を組み合わせて、売買の機会を検出してシグナルを送ります。 Bomb Bank は、買いの機会を特定するときは「爆弾」のようなものであり、売りシグナルを検出するときは「ドクロ」のようなものです。 ボムバンクはなぜ違うのですか? 完全な信頼性: Bomb Bank Signal は信号を削除しません。一度シグナルが発せられると、シグナルは残り続けるので、チャンスを逃すことはありません。 極めて高い精度: Bomb Bank は誤った信号を送信しません。リアルタイムで最新情報を更新し、市場の進化に合わせて調整しながら、以前のシグナルの透明性を維持します。 ライブアップデ
TPA True Price Action indicator reveals the true price action of the market makers through 100% non-repainting signals (except early signals mode) strictly at the close of a candle! TPA shows entries and re-entries, every time the bulls are definitely stronger than the bears and vice versa. Not to confuse with red/green candles. The shift of power gets confirmed at the earliest stage and is ONE exit strategy of several. There are available now two free parts of the TPA User Guide for our custo
30% DISCOUNT ! DISCOUNT ! DISCOUNT ONLY FOR 5 USERS at125$ valid for 1 day only.Grab it The PERFECT TREND HIT creates   BUY and SELL  perfect trend   arrow signals based on ADX EMA AND RSI And all filters inbuilt with accurate trend entries. Furthermore, the indicator and template display the trend direction, strength, and trade recommendation for independent price charts. ROCK WITH THE TREND Moreover, it shows the final trade recommendation to BUY or SELL with all filters and displays that info
Gann Time Clusters Indicator This indicator is based on W. D. Gann's Square of 9 method for the time axis. It uses past market reversal points and applies the mathematical formula for Gann's Square of 9 and then makes projections into the future. A date/time where future projections line up is called a 'time cluster'. These time clusters are drawn as vertical lines on the right side of the chart where the market has not advanced to yet. A time cluster will result in a market reversal point (ex.
Volatility Trend System - a trading system that gives signals for entries. The volatility system gives linear and point signals in the direction of the trend, as well as signals to exit it, without redrawing and delays. The trend indicator monitors the direction of the medium-term trend, shows the direction and its change. The signal indicator is based on changes in volatility and shows market entries. The indicator is equipped with several types of alerts. Can be applied to various trading
ECM Elite Channel is a volatility-based indicator, developed with a specific time algorithm, which consists of finding possible corrections in the market. This indicator shows two outer lines, an inner line (retracement line) and an arrow sign, where the channel theory is to help identify overbought and oversold conditions in the market. The market price will generally fall between the boundaries of the channel. If prices touch or move outside the channel, it's a trading opportunity. The
MT My Way
Issara Seeboonrueang
Best strategy,  Easy trade ,  Support of version update in the future MT My Way:  For new traders with no experience It is a very simple trade. Open the order when there is signal and close the order when there is exit or found the next opposite signal. You can set Stop Loss at the arrow and set the distance at Arrow Gap. For experienced traders, It will be very easy to trade. indicator for trade by yourself TRADE: Forex  TIME FRAME:  All Time Frame (Not M1) SYMBOL PAIR: All Sy
How to use Pair Trading Station Pair Trading Station is recommended for H1 time frame and you can use it for any currency pairs. To generate buy and sell signal, follow few steps below to apply Pair Trading Station to your MetaTrader terminal. When you load Pair Trading Station on your chart, Pair Trading station will assess available historical data in your MetaTrader platforms for each currency pair. On your chart, the amount of historical data available will be displayed for each currency pai
Ultimate Sniper Dashboard
Hispraise Chinedum Abraham
4.76 (17)
299ドルで割引中! 今後値上げの可能性あり! 下の説明を読んでください! 究極のスナイパーダッシュボードのための最高のエントリーシステム。究極のダイナミックレベル。(私の製品をチェックしてください) 究極のスナイパーダッシュボードはMT4多通貨テスト制限のため、ライブマーケットでのみ作動します。 究極のスナイパーダッシュボードをご紹介します。HA-Sniper、MA-Sniper、その他多くの特別なモードが含まれる最高の製品です。究極のスナイパーダッシュボードは絶対的な獣です! 初心者やエキスパートトレーダーにとって最高のソリューションです。もう二度と動きを見逃さない! シンプルさとピップを愛するトレーダーのために、特別な製品をご用意しました。シンプルでありながら、ダッシュボードは複数のカスタムアルゴリズムに基づき28の通貨ペアを監視し、すべての作業を行います。たった一つのチャートで、プロのように市場を読み解くことができます。もし、為替ペアが動き出したときに、その方向性を正確に特定することができれば、あなたの取引はどれほど改善されることでしょう。   当社のシ
Reversal Sniper is designed to find the extreme reversals of the price. Indicator collects data of Cycle Sniper Indicator. NOTE: REVERSAL SNIPER Indicator is made for Cycle Sniper Users as an additional tool.  However, it can be used by the traders who look for finding out strong reversal levels. Indicator works on all timeframes and all instruments. Reversal  Sniper  Checks: Harmonic Patterns RSI Zig Zag and Harmonic Swings Cycle Sniper Indicator's Buy / Sell Signals The complex algo i
Introduction to X3 Chart Pattern Scanner X3 Cherart Pattern Scanner is the non-repainting and non-lagging indicator detecting X3 chart patterns including Harmonic pattern, Elliott Wave pattern, X3 patterns, and Japanese Candlestick patterns. Historical patterns match with signal patterns. Hence, you can readily develop the solid trading strategy in your chart. More importantly, this superb pattern scanner can detect the optimal pattern of its kind. In addition, you can switch on and off individu
Connect Indicator is a tool used for connecting indicators between the MQL market and MT4. The connected indicators are made by our group and can be used for other applications, such as sending messages to the Line application or Telegram application. If you have any questions, please don't hesitate to ask us to receive support. Function and indicator buffer Buffer one is the high price of the previous candle. Buffer two is the high price of the previous candle. Usage To connect indicators to fu
TrendMaestro
Stefano Frisetti
5 (3)
note: this indicator is for METATRADER4, if you want the version for METATRADER5 this is the link:  https://www.mql5.com/it/market/product/108106 TRENDMAESTRO ver 2.4 TRENDMAESTRO recognizes a new TREND in the bud, he never makes mistakes. The certainty of identifying a new TREND is priceless. DESCRIPTION TRENDMAESTRO identifies a new TREND in the bud, this indicator examines the volatility, volumes and momentum to identify the moment in which there is an explosion of one or more of these data a
This product is based on the methodologies of Gann, his follower Don E. Hall. The Indicator builds a working view grid, which is used to analyze graphics. The Pyrapoint tool, developed by Don Hall, is a grid based on the Pythagorean cube. In his calculations he uses the Gann Square 9 methodology and the relationship between Price and Time. This tool is used to predict changes in trend and overall market actions. More information about the method   HERE
3 Indicators in 1 indicator Strategy based on price action Made specifically for the best forex currency pairs Can be used in the best time frame of the market at a very reasonable price This indicator is basically 3 different indicatos . But we have combined these 3 indicators in 1 indicator so that you can use 3 indicators at the lowest price. All three strategies are based on price action. But based on different trends. Long term, medium term and short term Attributes : No repaintin
Max Payneは、矢印の形でシグナルを与える反転/トレンドシグナルインジケーターです。このインジケーターは、同じバーの終値でシグナルを出します。このインジケーターは、異なる期間でチャート上に複数回ドロップして、シグナルの2倍/3倍の確認を取得できます。 このインジケーターは、あらゆる取引スタイルに合わせて高度に調整できますが、再描画やバックペイントは一切行われません。購入後には、使用したテンプレートとともにスクリーンショットに表示される完全なシステムが表示されます。 ----------------- 取引方法: トレンドフィルター(購入後に得られるペイントレンド)が方向に一致している間、同じバーでトリプル確認が得られるまで待ちます 取引を開始し、買い取引の場合は金色の矢印 (テンプレート) より下、売り取引の場合は金色の矢印 (テンプレート) より上にストップロスを設定します。終了シグナルは最初の反対側の白い点のシグナル (テンプレート) です。 ----------------- パラメーター : 信号周期:矢印周期 フィルター: 信号フィルター 距離 : ローソクからの矢印
【V 1.00】MTF NRPA 5 移動平均RTDがリリースされました! 非再描画矢印リアルタイム ダッシュボード。 最適な移動平均インジケーターをお探しなら、ここが正しいページです。 一般に、2 つの移動平均の交点 (クロスオーバー) が次の価格トレンドの方向を決定するため、2 つの移動平均を設定します。 高速移動平均が低速移動平均と交差し、高速 > 低速の場合、トレンドは上昇しています。 逆に、速い移動平均が遅い移動平均と交差し、速い < 遅い場合、トレンドは下降しています。 2 つの移動平均の欠点は、長期的な傾向が見えないことです。 それが私がこの取引ツールを開発した理由です。 それは次のように説明されています。 この取引ツールでは、5 つの移動平均を使用します。 はい、5つです! デフォルトでは、MA 1 と MA 2 を大きな時間枠 (H1) に設定します。 MA 1 と MA 2 の交差は、上半期の時間枠でトレンドの変化があることを意味します。 次に、現在の時間枠(小さい)に MA 3 と MA 4 を設定します。たとえば、M5 でチャートを開きます。
JULY OFFER 80% OFF next price for unlimited version will be 17000$. This is the only time you can get this institutional and professional indicator at this price for unlimited version. Don't dare to miss this. The tool I am about to introduce to you you can't compare it with other tools due to its strategy and accuracy level in predicting the next price directional movement . This tool is designed for serious traders who have decided to make a difference through trading. Be the next person to wi
4.8(25件)  ゴゴジャングル での評価 【トレンドラインPro2】 MT4(MetaTrader4)ライントレード補助インジケーターです。 ダウ理論に忠実であることを前提とした、誰にでもお勧めできる、とてもベーシックな仕様です。 ダウ理論に基づくトレンドを認識し、さらにサポートライン・レジスタンスライン・トレンドラインをリアルタイム自動描画・自動削除します。 精度は非常に高いです。 【挙動確認】 Youtube では、毎週末に挙動確認用動画をアップしています。 【ZigZag】 チャート形状から作られる、ダウ理論に沿ったオリジナルのジグザグをベースとしています。 ジグザグから読み取れるトレンドは、ダウ理論に沿って8段階まで束ねられています。 【Sign】 ダウ理論に基づく8段階のジグザグに沿って、トレンド方向を表示します。 緑(アップトレンド) 赤(ダウントレンド) 白(トレンドレス) 黄(最小から5つ以上のトレンドが上を示している) 黄(最小から5つ以上のトレンドが下を示している) 【Lines】 ダウ理論に基づく8段階のジグザグに沿っ
This indicator has been developed to identify and display these trends quickly and easily, allowing you to see instantly, those currency pairs which are trending, and those which are not – and in all timeframes, with just one click. The 28 currency pairs are displayed as a fan as they sweep from strong to weak and back again, and this is why we call it the ‘currency array’. All 28 pairs are arrayed before you, giving an instant visual description of those pairs that are trending strongly, those
The indicator " ZigZag on Trend " is an assistant in determining the direction of price movement, as well as a calculator of bars and points. It consists of a trend indicator, which follows the price direction by the trend line presented in the form of a zigzag and a counter calculating the number of bars traversed in the direction of the trend and the number of points on the vertical scale. (calculations are carried out by the opening of the bar) The indicator does not redraw. For convenience,
Indicator : RealValueIndicator Description : RealValueIndicator is a powerful tool designed specifically for trading on the EURUSD pair. This indicator analyzes all EUR and USD pairs, calculates their real currency strength values, and displays them as a single realistic value to give you a head start on price. This indicator will tell you moves before they happen if you use it right. RealValueIndicator allows you to get a quick and accurate overview of the EURUSD currency pair tops and bottoms,
フィルタ:
レビューなし
レビューに返信
バージョン 1.2 2021.02.27
Minor bug has been fixed
+
Now it does calculate past candlesticks too!
バージョン 1.1 2021.02.27
A minor bug has been fixed.