• 概要
  • レビュー
  • コメント (30)
  • 最新情報

News Dashboard MT5

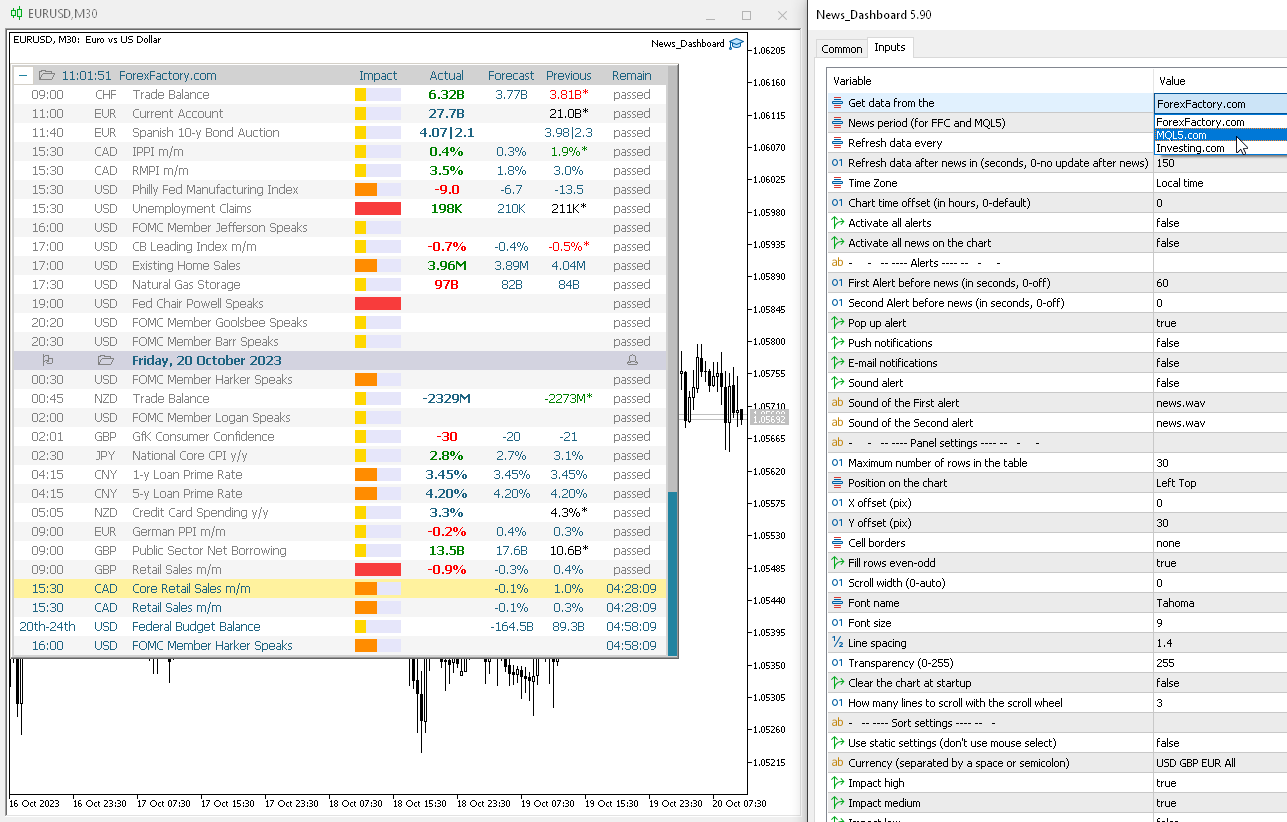
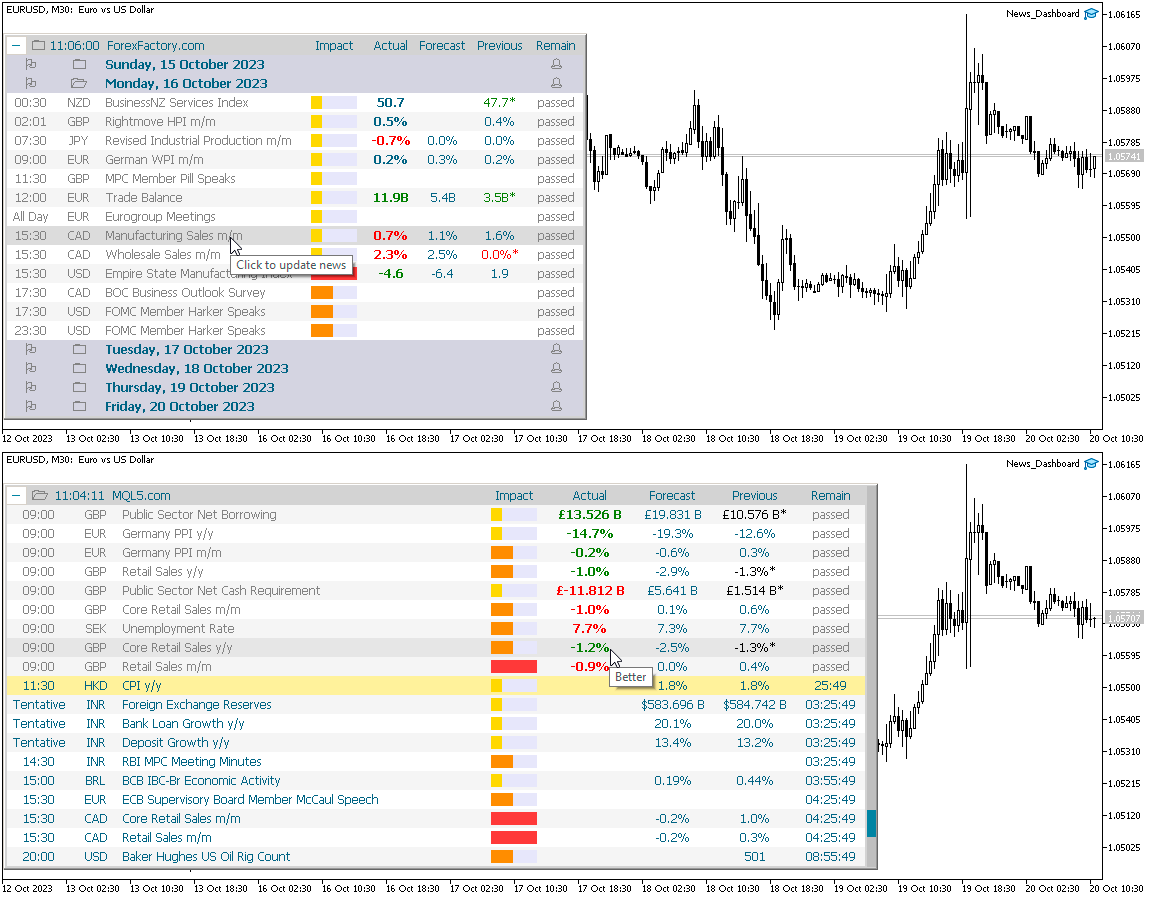
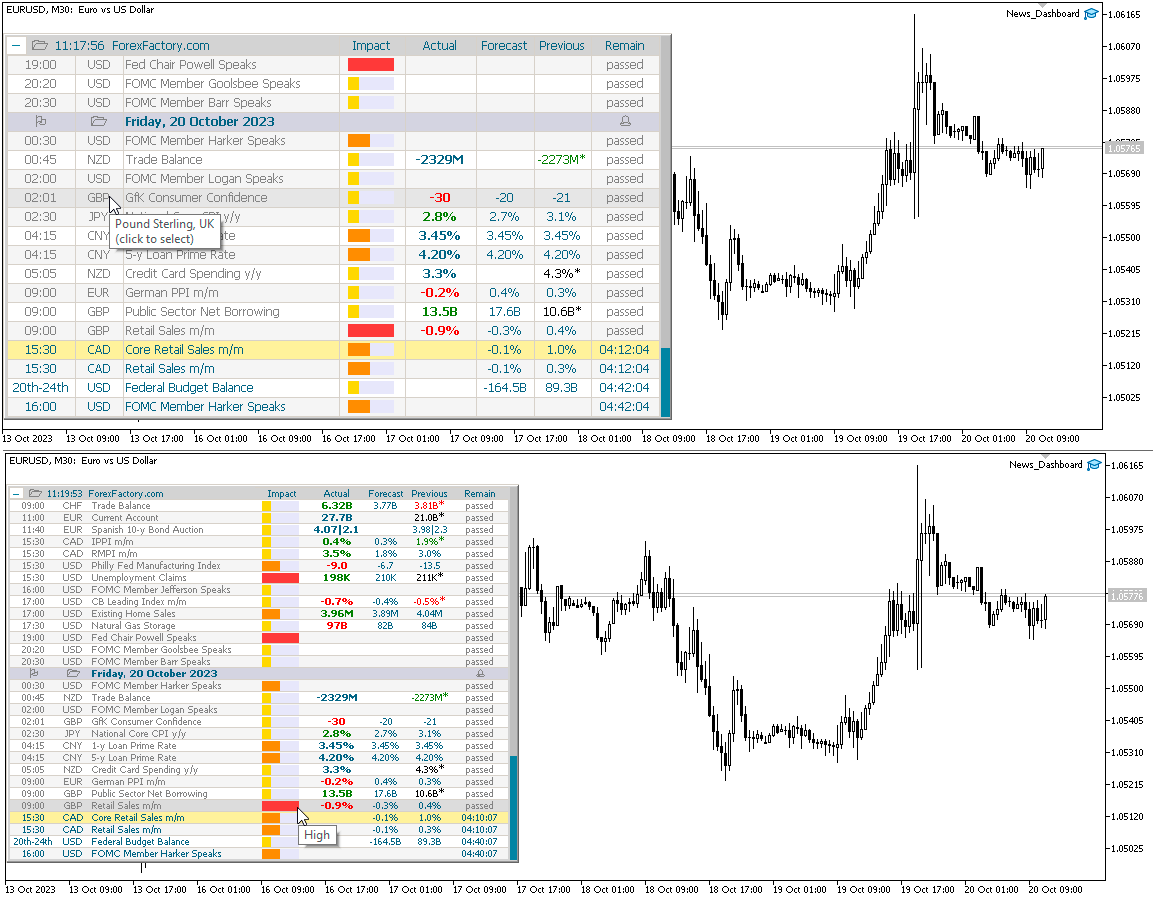
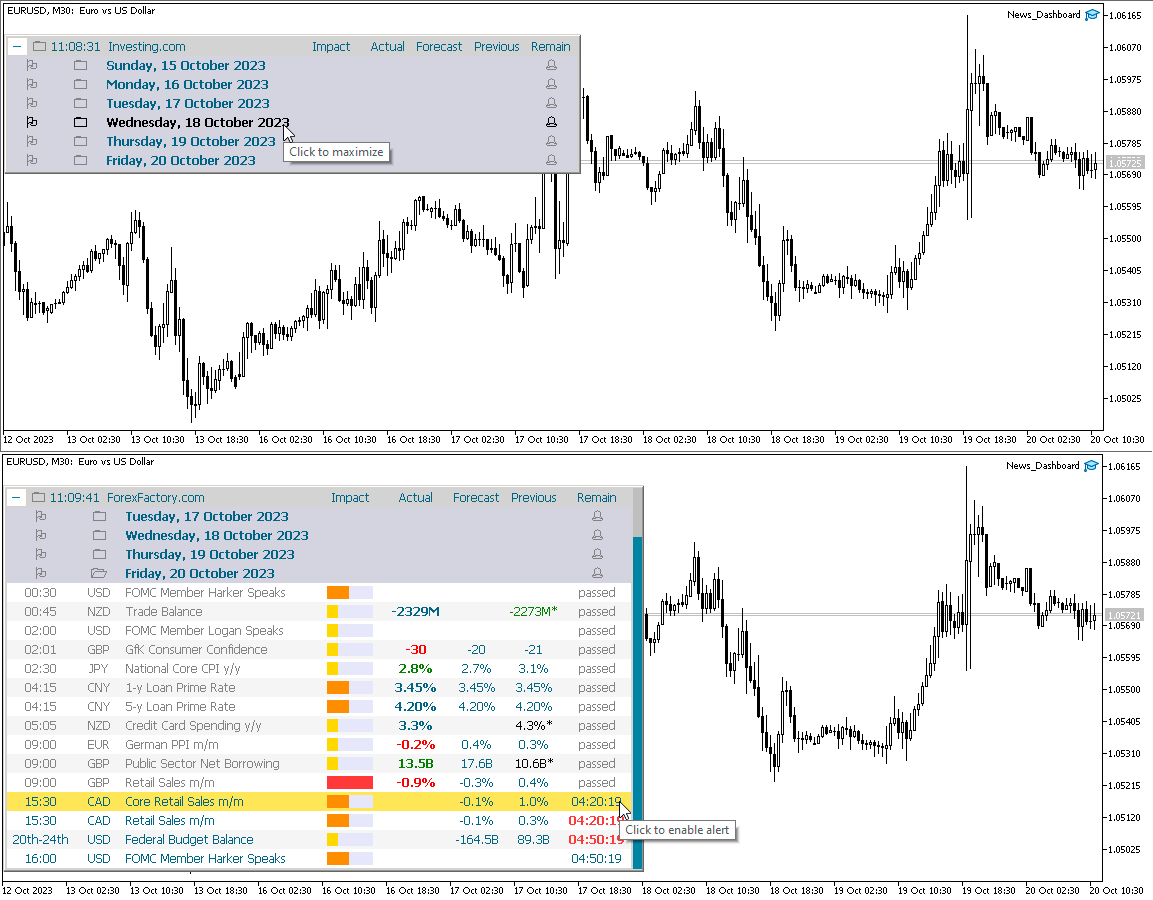
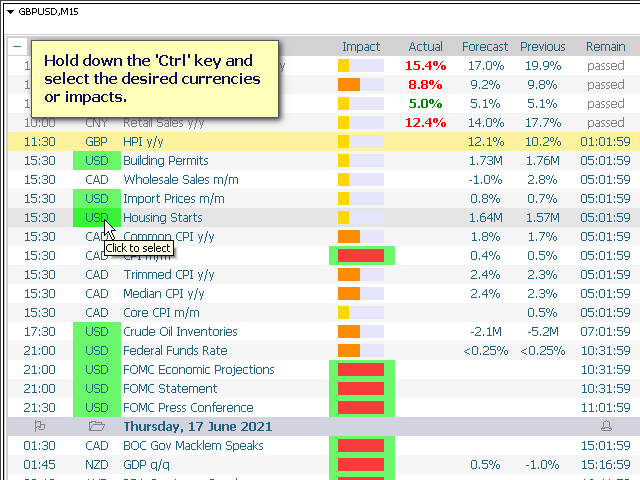
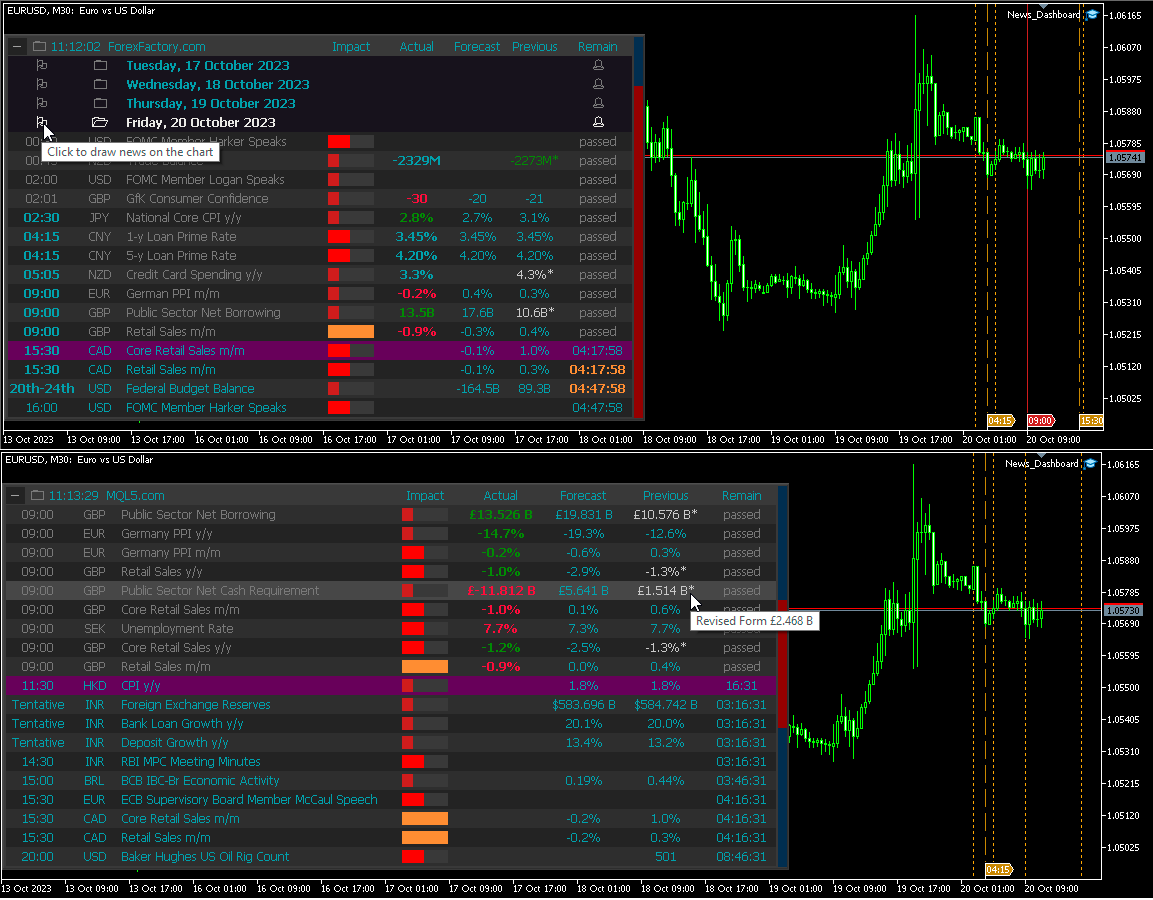
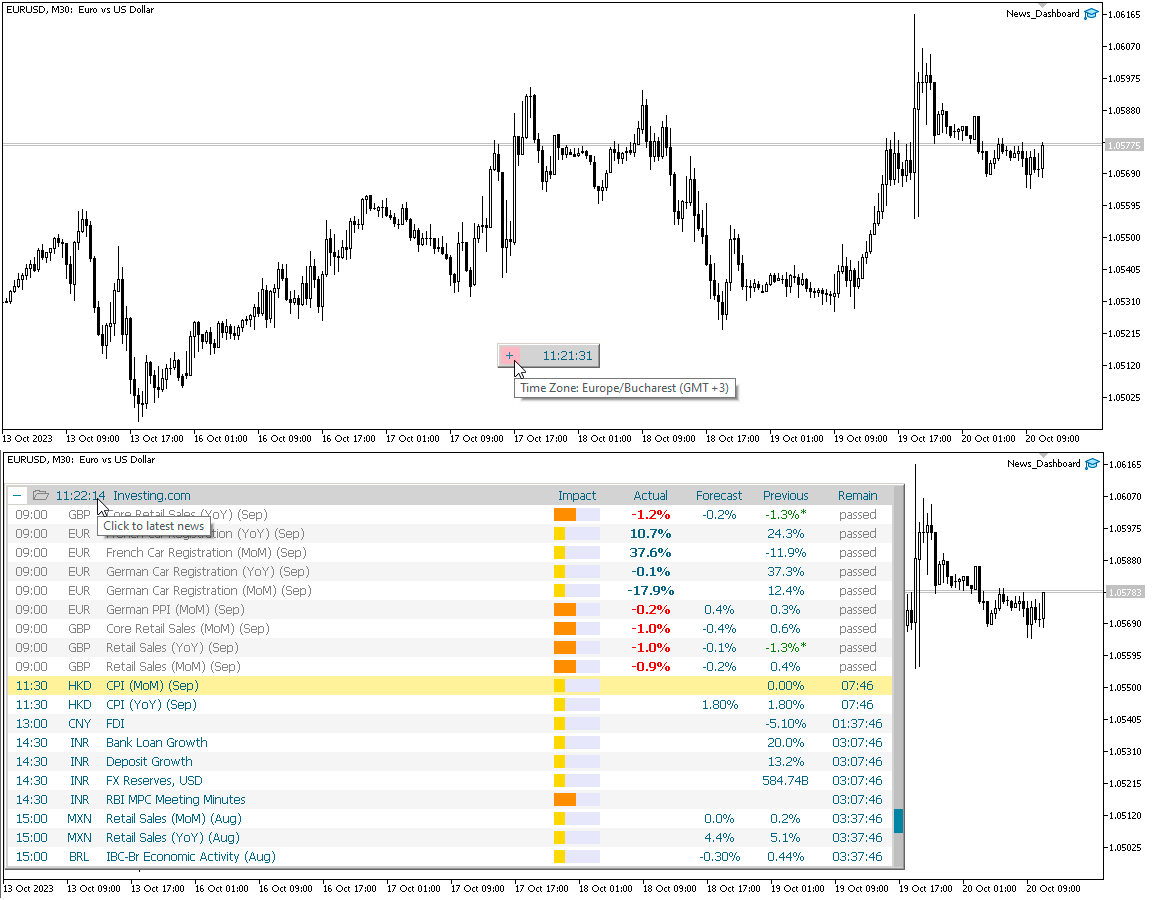
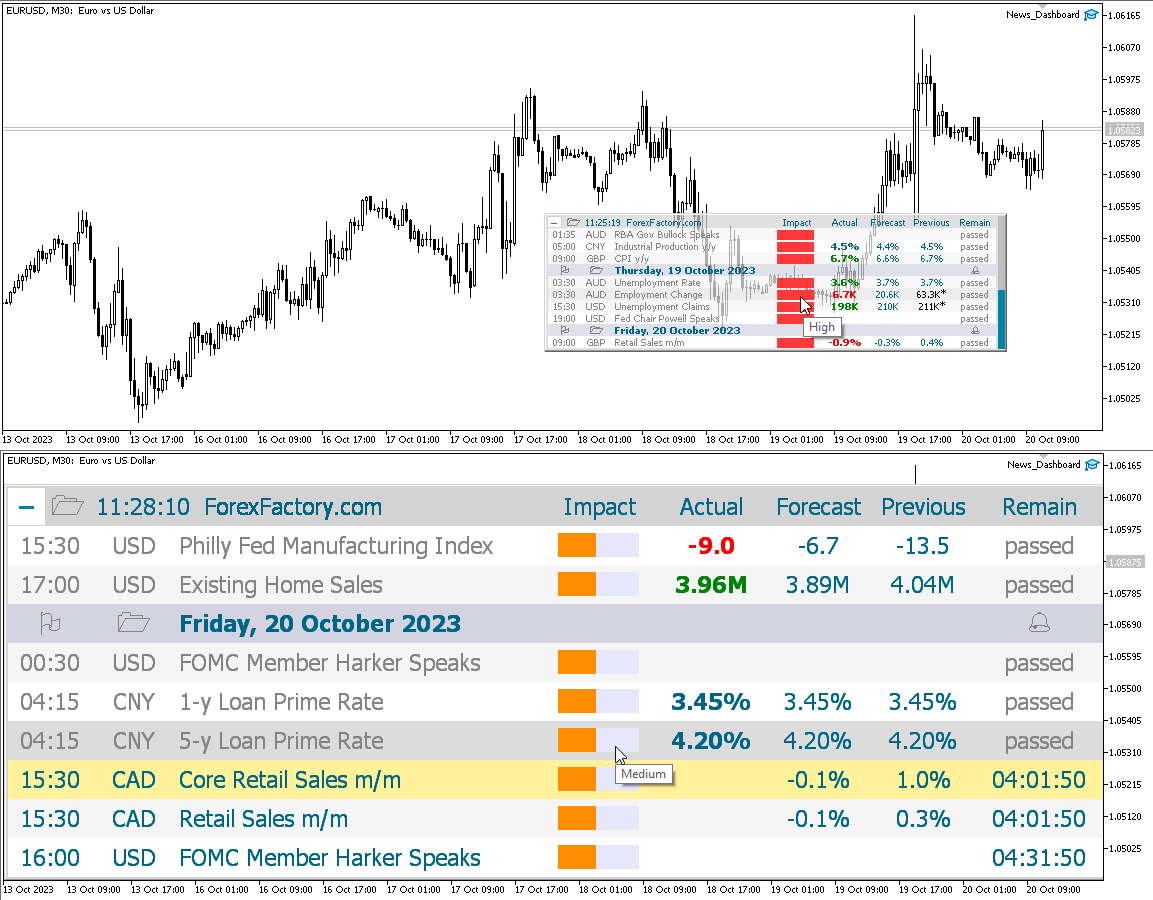
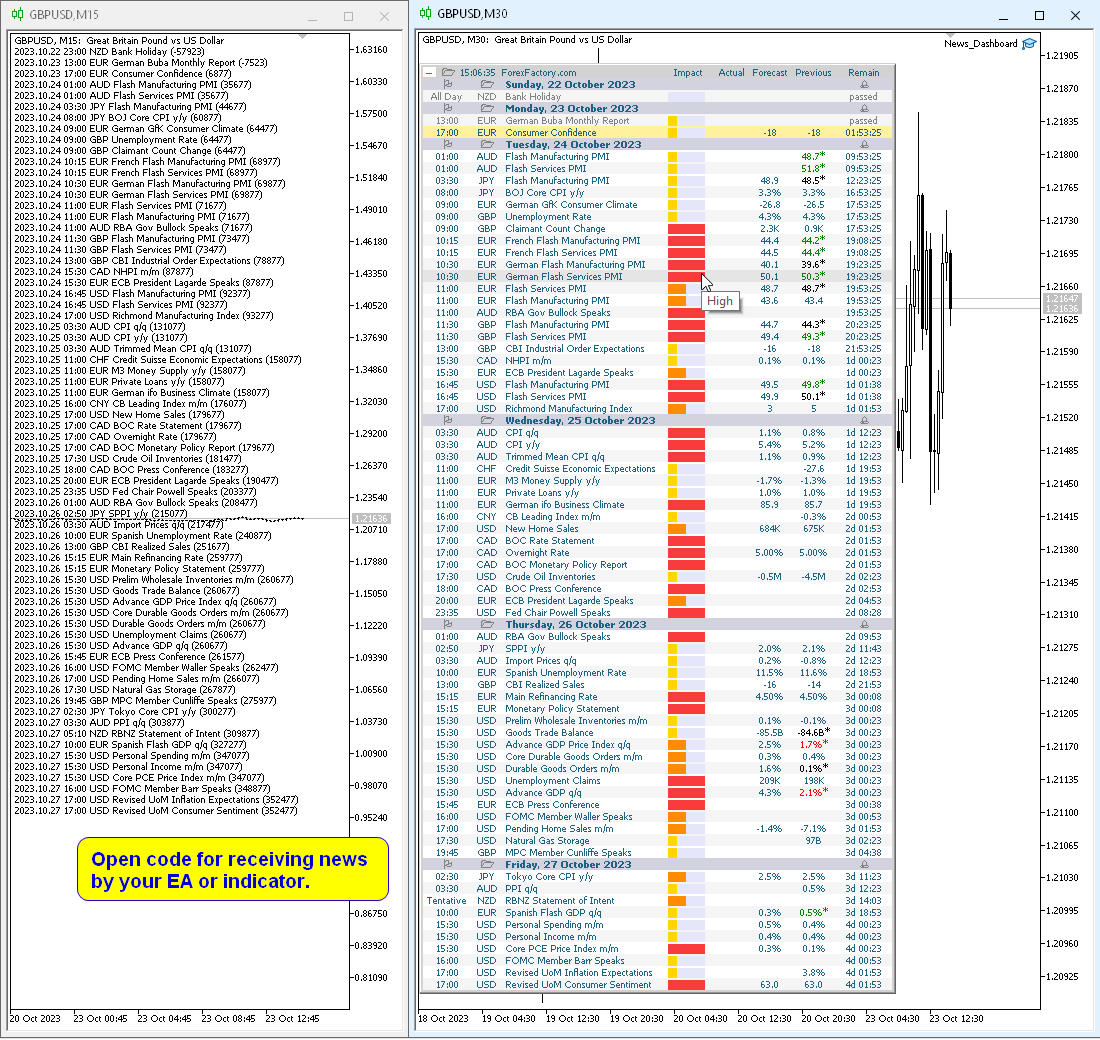
This dashboard displays current news from three sources: from the ForexFactory.com website (FFC calendar), from the Investing.com website and the Economic Calendar from mql5.com. You can sort news by impact and by country, and display them on the chart with one click. By holding down the 'Ctrl' key, you can select several different 'currencies' or 'impacts' to sort. Also, this utility shows not only the forecast, but also the actual values ​​after they appear on the site. You can set a separate notification for each news. News from mql5.com in the language of your MT5.

You can read the news using your EA or indicator. For more details, see the description in the comments.

The EA can close market positions and pending orders before news, move stop loss to breakeven and close positions at the end of the day.

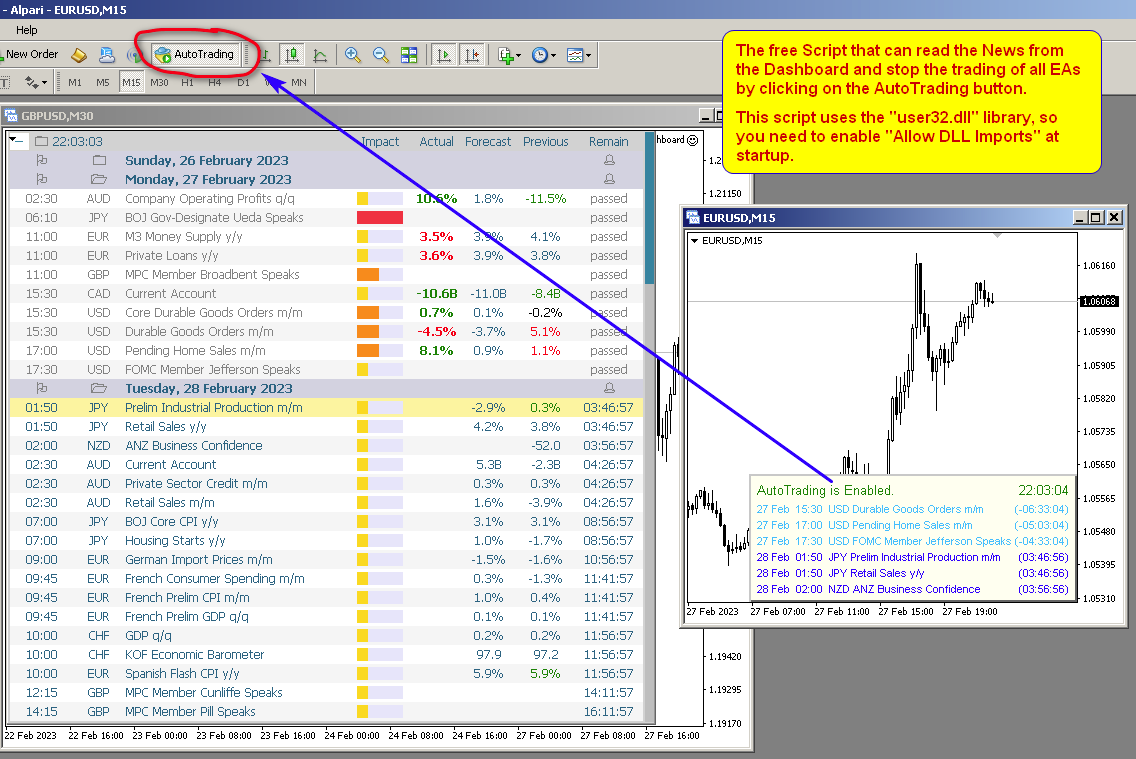
Also in the Comments you can find a Script that can read the news from the Dashboard and stop the trading of all EAs by clicking on the "Algo Trading" button.

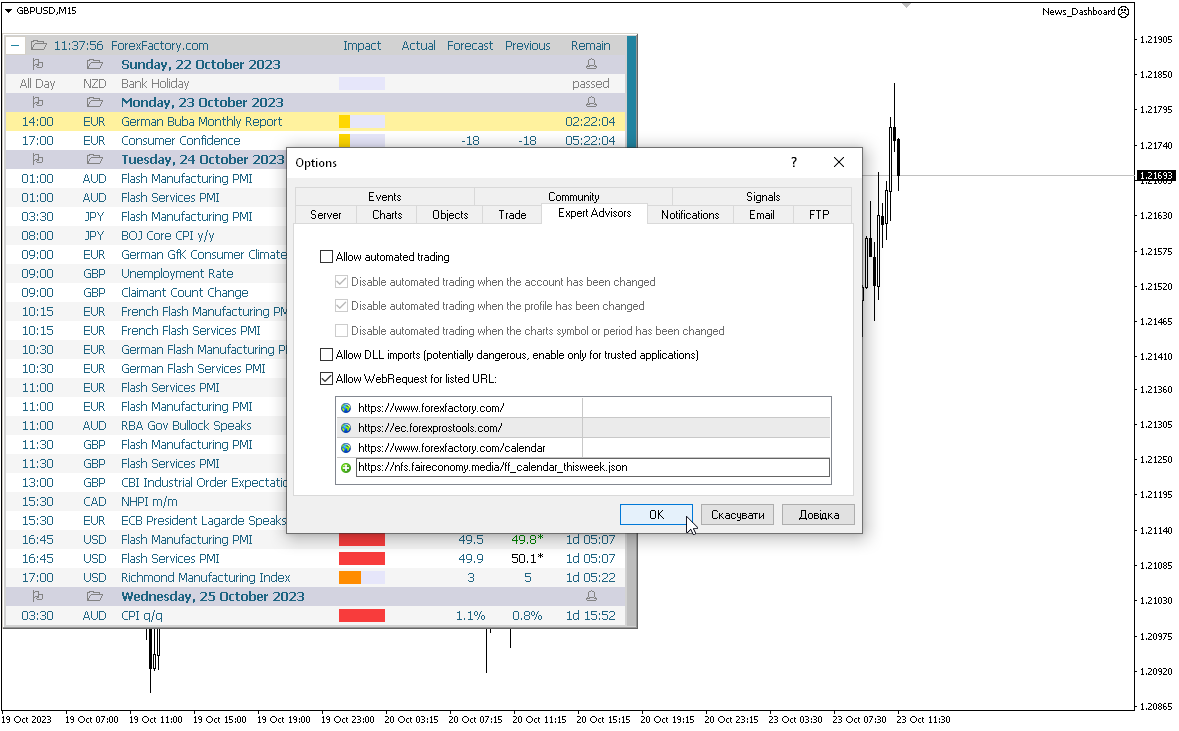
This program takes information from the internet, so you need to enable access to the ForexFactory and  Investing.com sites in your terminal settings.

Press "ctrl+O", "Expert Advisors", "Allow WebRequest", and copy the links to the list (see last screenshot, spaces should be removed, they were added because links cannot be posted here):

https://www.   forexfactory.com/
https://www.   forexfactory.com/calendar
https://           ec.forexprostools.com/
https://           nfs.faireconomy.media/ff_calendar_thisweek.json

ForexFactory uses CloudFlare protection, and blocks some IP-address and VPS.
Therefore, before buying, I recommend that you check out the test version, to see if it works for you, which is in the Comments.

Parameters

Get data from the
    — forexfactory.com
    — mql5.com
    investing.com
    — FFC (nfs.faireconomy.media)

    News period (for FFC and MQL5)
      — Last Week — previous week
      — This Week — current week
      — Next Week — future week.
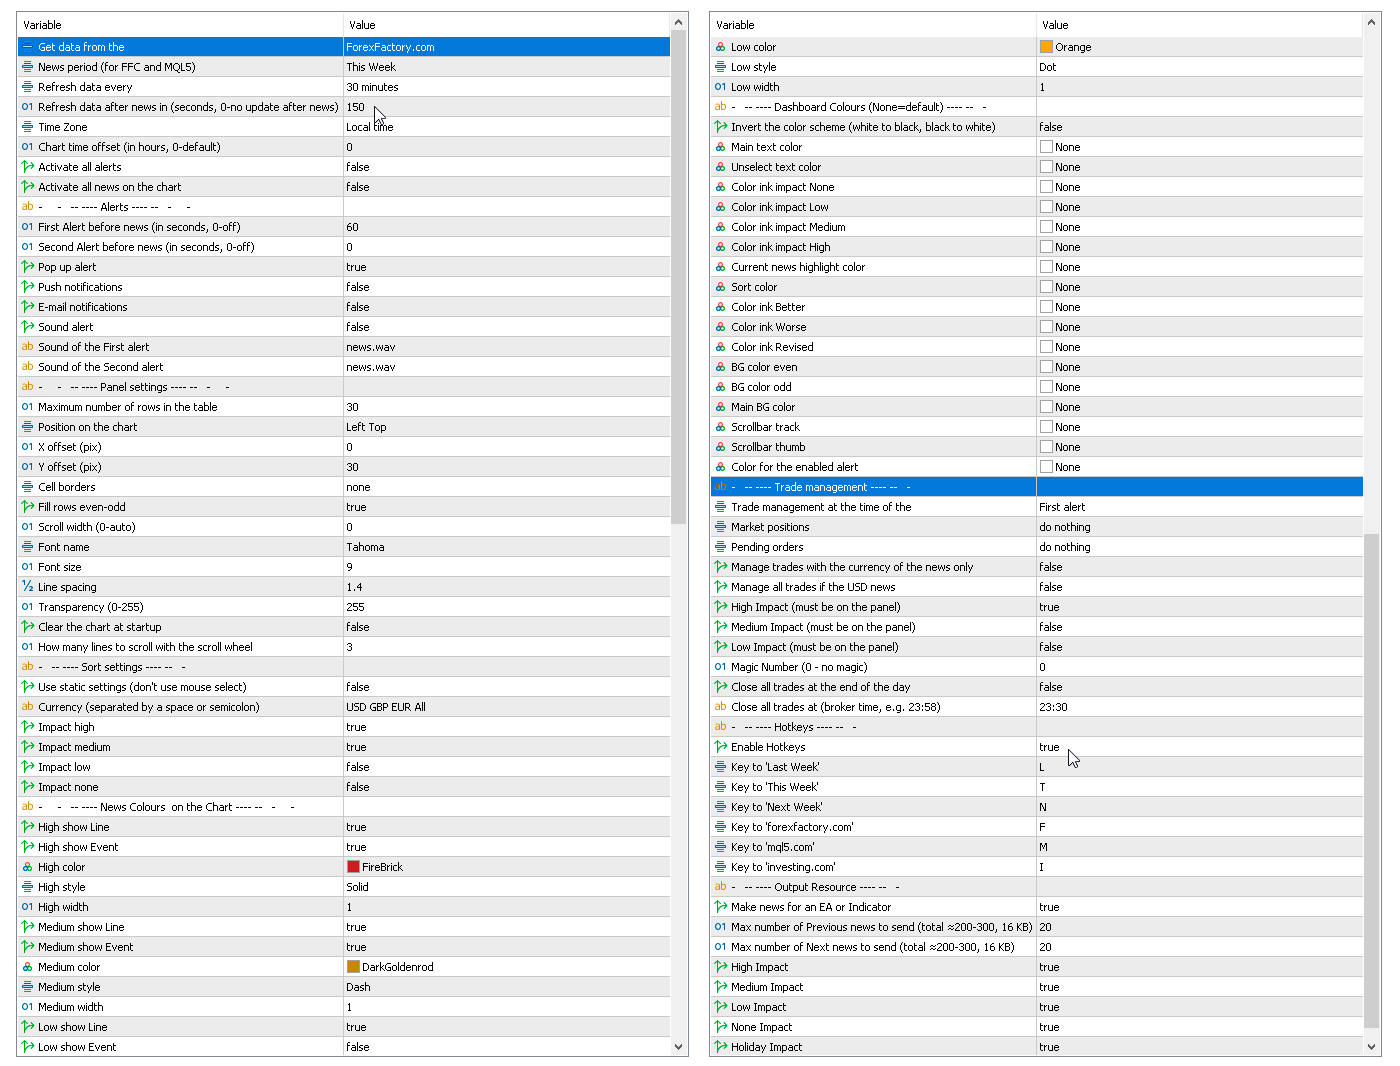
      Refresh data every — update data from the site every X-minutes.
      Refresh data after news in (sec., 0-no update after news) — update data automatically after news release to get actual values, by default after 150 seconds.
      Time Zone — choice of time zone, if it is determined incorrectly.
      Chart time offset (in hours, 0-default) — time shift for drawing objects on the chart.
      Activate all alerts — at start, all news will have alerts enabled;
      Activate all news on the chart — at start, all news will be displayed on the chart;
      Make news for an EA or Indicator.
        Alerts
        First Alert before news (seconds, 0-off) — send a first alert before the news, time in seconds.
        Second Alert before news (seconds, 0-off) — send a second alert before the news, time in seconds.
        Pop up alert.
        Push notifications.
        E-mail notifications.
        Sound alert.
        Sound of the First alert — filename for the first alert. The file must be located in the terminal_dir\Sounds directory. Only audio files in WAV format are played.
        Sound of the Second alert — filename for the second alert.
          Panel settings
          Maximum number of rows in the table.
          Position on chart.
          X offset (pix).
          Y offset (pix).
          Cell borders — options for framing table cells.
          Fill rows even-odd.
          Scroll width (0-auto).
          Font name.
          Font size.
          Line spacing.
          Code Page — change the code page. If the characters on the panel are displayed incorrectly, try other encodings (e.g. ACP or UTF7 .
          Transparency (0-255).
          Clear the chart at startup.
            Sort settings
            Use static settings (don't use mouse select) — this parameter disables the ability to select "currencies" and "impact" with the mouse. Only the values set below will be active.
            Currency (separated by a space or semicolon) — list of currencies to be displayed.
            Impact high — display high impact news.
            Impact medium — display news with medium impact.
            Impact low — display news with low impact.
            Impact none — display news without impact.
            News Colors on the Chart — news colors for displaying on the chart.
            Dashboard Colors (None = default) — color of dashboard elements.
              Trade management
              Trade management at the time of the
                — First alert
                — Second alert
                — turn off
                Market positions
                  — Close all 
                  — Set Breakeven & Close unprofitable
                  — Set Breakeven
                  — do nothing
                  Pending orders
                    — Close all 
                    — do nothing
                    Manage trades with the currency of the news only.
                    Manage only if the news has an enabled alert on the panel.

                    Manage all trades if the USD news.
                    High Impact (must be on the panel).
                    Medium Impact (must be on the panel).
                    Low Impact (must be on the panel).
                    Magic Number (0 - no magic).
                    Close all trades at the end of the day.
                    Close all trades at (broker time, e.g. 23:58).


                    おすすめのプロダクト
                    Supertrendingsignal
                    OTAVIO AGUIAR CAMPOS Aguiar
                    O indicador Supertrendingsignal imprime um sinal na tela indicando início de uma forte tendência. O sinal não mostra o ponto de entrada com melhor risco retorno, apenas faz a indicação de uma forte tendência.  Foi idealizado a partir de um conjunto de médias móveis e volume. Parametros: Periodmalongo: Períodos da média longa Periodmamedio: Períodos da segunda media Periodmamedio2: Perídos da terceira media Periodmacurto: Períodos da média curta. PeriodATR: Períodos do indicador ATR para adequar
                    FREE
                    The utility draws pivot levels based on a selection from day week month The previous candlestick of the selected timeframe is taken and the values for the levels are calculated using the following formulas: Pivot = (high + close + low) / 3 R1 = ( 2 * Pivot) - low S1 = ( 2 * Pivot) - high R2 = Pivot + (R1 -S1) R3 = high + ( 2 * (Pivot - low)) S2 = Pivot - (R1 - S1) S3 = low - ( 2 * (high - Pivot)); The style and thickness for all lines are adjusted. The colors for the R, Pivot and S line
                    FREE
                    Candle Timer 2X
                    Ronaldo Franco De Oliveira Cardoso
                    5 (4)
                    The RFOC Candle Timer 2x was created for the trader to locate himself in time, having access to the pending time for the formation of a new candle. Additionally, it is possible to include in the chart a second timer that shows the pending time for the formation of a new candle in a time period different from the current one.   The user will have the option to select up to 4 different positions for the timer display ("No candle", lower left corner, lower right corner or upper right corner). In ad
                    FREE
                    The   Candle Timer indicator   displays an advanced bar countdown timer on a chart. This study indicates the remaining time for the last candle in the chart. Main features The indicator shows the remaining time for the last bar in the chart. Alert notifications for new bar. Works on every timeframe (M1, M5, M15, M30, H1, H4, D1, W1, MN). Customizable parameters (Colors, Text size, Visibility...). Ideal tool for all kinds of trading (Scalpers, intraday traders...). Very fast calculation. Avail
                    FREE
                    This indicator draw a line on high and low levels of X number of days. It is possible to have an alert (in the software and mobile app) for when the price breaks the high or low of the current day. Configurações: Days -   past days to calculate (1 = actual day only). Alert when reach levels -   activate the alert for specific levels or both. Push notification -   enable the alert to the mobile MT5 app. Appearance High -   high level color. Low -   low level color. Size actual day -   thi
                    FREE
                    このプロジェクトが好きなら、5つ星レビューを残してください。 インスタグラムでフォロー:borelatech 機関が大きなボリュームを取引するので、それらが試してみることは珍しくありません 特定のパーセンテージレベルでポジションを守る これらのレベルは、あなたが使用できる自然なサポートと抵抗として役立ちます 取引を入力するか、ポジションに対する危険性を認識する。 一般的に使用されるパーセンテージの例は、EURUSDの0.25%と0.50%です。 毎週、スクリーンショットでこの例を見ることができます。 このインジケータを使用すると、以下の割合の変動を描画することができます。 日。 週。 月 日 クォーター。 生年月日
                    FREE
                    TG Ponto de Cobertura (Coverage Trade) This Indicator checks your trading results on the day relative to the asset on the chart and adds a line at the price corresponding to the coverage point for the open position, considering the entry price and lot size. The coverage point will be recalculated after new entries, based on the average price of the open operation and the lot size. If the result for the day is zero, a line will be displayed at the price of the current trade. If the day's r
                    FREE
                    Spread Costs refers to the amount of the loss caused by the spread, and Swap Benefits refers to the amount of the income gained by overnight positions. Spread Costs is an important indicator for short-term traders, especially for scalping traders, and Swap Benefits is an important indicator for long-term traders. Since the spreads and swaps on the MetaTrader 5 platform are all expressed in points, we need to convert it into the amount expressed in the account currency. This tool can display the
                    Big price reduction sale, don`t miss this opportunity if you pass by. Hello, this is a high-frequency trading program based on Fibonacci strategy.  Recommended to run on gold. In a 5-minute timeframe, this trading strategy operates with a fixed stop loss of 100 points and a fixed profit target of 20 points. It is designed to be applicable across all markets, making it versatile for various trading environments. A minimum deposit of $300 is recommended to engage in this strategy. This method
                    News: IDEA 2.0 is out with lot of features, like telegram bot notifications and Limits order! Check the changelog at bottom of page (*). Hi all, here you can find my Expert Advisor, called IDEA  (Intelligent Detection & managEr Algorithm) . In short, with this software you can: Have   a clear view of market status , with an indication of current trend. Simply add symbols you want to monitor to your market watch, and IDEA will notify you if some of them are in trend; Have an   automatic lots
                    Add a watermark in the background of your charts, containing the Stock Symbol followed by the current Timeframe, and the Symbol Description below it. Have you ever seen videos or screenshots of other platforms, boasting those great looking watermarks, and wondered why your MetaTrader5 doesn't have one? Well, I did... so I tried the very few options available in the Market at the time, but I still wanted to tweak everything exactly to my taste. So I developed my own solution, and now I am proud
                    FREE
                    1. What is this.          This is a   very rigorous   indicator to show different market trading sessions. It shows the main markets: NewYork, London, Frankfurt, Sydney, Wellington, Tokyo.           Very important: Different markets have different start and end dates for daylight saving time, and   the trading session of a market can vary depending on daylight saving time and winter time. Also, the daylight saving time system is   different for countries in the northern hemisphere and southern
                    The script allows to easily watch the date and time of several cities selected by the user from more than 30 important cities all over the world. It also shows GMT, Server time and Local time. The cities on the screen are automatically sorted by the date and time. You can save your setting on the Inputs tab and use them in future. Notice: Daylight saving time is not considered.
                    Awesome Oscillator by Bill Williams with the ability to fine-tune and replace the averaging algorithms of the indicator, which significantly expands the possibilities of using this oscillator in algorithmic trading and brings it closer in its properties to such an indicator as the MACD. To reduce price noise, the final indicator is processed with an additional Smooth averaging. The indicator has the ability to give alerts, send mail messages and push signals when the direction of movement of th
                    この小さなツールを使用すると、時間カウンターを分単位で定義できます あなたが設定した分数に応じてポジションをクローズするため。 たとえば、30分に設定した場合、ツールはオープンから30分後に各オープンポジションを閉じます。 設定 アクティブ:ツールをアクティブにして、定義された分数後にポジションを閉じるために使用します。 管理:ツールで管理されるシンボルで選択します。 アカウントのすべてのオープンポジションにシステムを適用する場合は、[ALL CURENCY]を選択します 「この通貨のみ」を選択すると、現在の通貨のみで一時的にポジションがクローズされます。 MINUTE DURATION TRADES:取引期間の分数を選択します。 タイムゾーン: タイムゾーンを定義します。 もしあなたが
                    FREE
                    Simple indicator that draws the market hours on chart (broker, local and GMT). Functions: Horizontal distance - from border. Vertical distance - from border. Color - text color. Font - text font. Size - text size. Corner - which chart corner will be drawn. Show seconds - show or hide seconds. Draw as background - candles front or back. Label local - text before local time. Label broker - text before broker time. Label GMT - text before GMT time. Separator - separator between label and time Objec
                    FREE
                    Prior Lines
                    Ricardo Almeida Branco
                    This indicator shows on the current day some lines of interest, such as maximum, minimum and closing of the previous day, as well as the opening, maximum and minimum price of the current day. It can also show the GAP (closing of the previous day and opening of the current day) and projections of the amplitude of the previous day, according to the value you choose in the multiplier. Oh, I was going to forget. It is also possible to determine the time frame, which is daily by default. If th
                    The   ATR indicator   is a helpful tool for measuring the range of bars. It quickly and easily helps evaluate the ATR's current spread (range), which is especially useful for VSA traders. The indicator for classifying the range of bars (candles) uses the moving average and its multiples. Accordingly, the area where the volume is located (relative to the moving average) is labeled as ultra-low, low, average, high, very high, or ultra-high. Our ATR indicator is rendered as a histogram. This indic
                    User Support Paid subscribers may request to join the WTGS Workshop   @DB_WTI after emailing your Twitter handle and the proof of subscription to   wtg.system.international@gmail.com . The System WTGS Navigator Overlay consists of two components: Dynamic Butterfly Footprints Overlay Disclaimers Although every effort has been made when designing WTGS Navigator Overlay, WTG makes no warranties, expressed or implied, or representations as to the accuracy or profitability of the system. WTG assume
                    1. What is this.          This is a very rigorous indicator to show different market trading sessions. It shows the main markets: NewYork, London, Frankfurt, Sydney, Wellington, Tokyo.           Very important: Different markets have different start and end dates for daylight saving time, and the trading session of a market can vary depending on daylight saving time and winter time. Also, the daylight saving time system is different for countries in the northern hemisphere and southern hemisphe
                    NeuroExt
                    Dmytryi Voitukhov
                    3.9 (10)
                    https://t.me/mql5_neuroExt   actual version Signal https://www.mql5.com/ru/signals/1511461 You can use any tool. The bases will be automatically created at the start of the Learn. If you need to start learning from 0 - just delete the base files. Initial deposit - from 200 ye. Options: DO NOT ATTEMPT TO TEST WITHOUT NEURAL NETWORK TRAINING! it is enough for the balance graph after training to be horizontal. generating a training base is extremely simple.  there is a ready-made training
                    FREE
                    Welcome to the Ultimate Harmonic Patterns recognition indicator that is focused to detect advanced patterns. The Gartley pattern, Bat pattern, and Cypher pattern  are popular technical analysis tools used by traders to identify potential reversal points in the market. Our Ultimate Harmonic Patterns recognition Indicator is a powerful tool that uses advanced algorithms to scan the markets and identify these patterns in real-time. With our Ultimate Harmonic Patterns recognition Indicator, you
                    Size Calculator allow you to calculate the size you need for your position giving two parametres: the number of pips risked and the money risked, for example if you want to risk 20 USD on 200 pips, then you will need to input 200 in the case reserved for pips and 20 in the case reserved for risk, the size will appear in left top carner of the chart in your metatrader 4 platform,    Size Calculator  support the following symbols : EURUSD GBPUSD AUDUSD NZDUSD  GOLD WTI  EURJPY GBPJPY USDJPY AUDJP
                    Server Clock
                    Flavio Javier Jarabeck
                    4.89 (9)
                    Many friends asked me for a simple, non-obtrusive, resource-friendly clock to track the time during their trades. It seems pretty obvious, but it is a must-have for those trading the market manually, waiting for the Market News, or just to visually know what time it is... Trading is an absorbing endeavor! So, here it is... Totally configurable, including Font Type, Font Size and Chart Location: Upper Left/Center/Right OR Lower Left/Center/Right, with a little twist of adjusting the Offset, just
                    FREE
                    Displays a digital clock or a countdown (until new bar) in the chart in realtime. Benefits: Current time always in sight for market open/close, economic data, etc. Displays accurate time (server/broker time) Keep an eye on how much time is left until a new bar starts (countdown) Clearly visible (set color, size, font, position) Always runs/refreshes every second even without new price tick Hint: To display the most accurate time, use the server (broker) clock setting combined with the time (ho
                    FREE
                    Dsc Vwap Channel
                    Diogo Sawitzki Cansi
                    5 (2)
                    Indicador usado para sabermos os pontos de suporte de resistência no gráfico. Funciona em todos ativos e timeframes. Acerte exatamente os pontos de entradas e saídas das suas operações.   SEE OUR RESULTS ON INSTAGRAM:  https://www.instagram.com/diogo.cansi/   TELEGRAM GROUP =  https://t.me/robosdsc More information by email dscinvestimentos@gmail.com or by Whatsapp 55-991372299
                    FREE
                    Countdown Clock
                    Alexandre Borela
                    4.95 (21)
                    このプロジェクトが好きなら、5つ星レビューを残してください。 インスタグラムでフォロー:borelatech このインジケータは、時間のための再開のコンパクトなカウントダウンクロックを描画します キャンドルを閉じると: チャートの任意の角に配置することができます。 複数のタイムフレーム; MT5のナビゲーターからドラッグすることでインジケータウィンドウに追加できます。 ろうそくが10秒残っていると色が異なります。 チャートとのより良い統合のためのカスタマイズ可能な色。
                    FREE
                    Introducing a compact and handy panel for watching the market and estimating multicurrency price movements. It shows main parameters for a user defined group of symbols in the form of a table. Its functionality is checked on Forex and FORTS. The following information is displayed: Financial instrument name . Last price value - can be turned off for off-exchange markets. Ask price value . Bid price value . Spread size in pips. Stop level in pips - can be turned off for off-exchange markets. Chang
                    Are you tired of drawing Support & Resistance levels for your Quotes? Are you learning how to spot Support & Resistances? No matter what is your case, Auto Support & Resistances will draw those levels for you! AND, it can draw them from other timeframes, right into you current chart, no matter what timeframe you are using... You can also Agglutinate regions/zones that are too much closer to each other and turning them into one single Support & Resistance Level. All configurable. SETTINGS Time
                    FREE
                    PROMOTION!! $499 until 1 Mar. After that, EA will be $1,050 Developed and tested for over 3 years, this is one of the safest EAs on the planet for trading the New York Open. Trading could never be easier.  Trade On NASDAQ US30 (Dow Jones Industrial Average) S&P 500  What Does The EA do? The EA will open a Buy Stop Order and a Sell Stop Order(With SL and TP) on either side of the market just a few seconds before the NY Open.  As soon as 1 of the 2 trades is triggered, the EA automatically delete
                    このプロダクトを購入した人は以下も購入しています
                    Trade Assistant MT5
                    Evgeniy Kravchenko
                    4.4 (172)
                    取引 ごとのリスクの 計算、新規注文 の 簡単 な 設置、部分的 な 決済機能 を 持 つ 注文管理、 7 種類 のトレーリングストップなど 、便利 な 機能 を 備 えています 。 注意、アプリケーションはストラテジーテスターでは機能しません。 説明ページからデモ版をダウンロードできます  Manual, Description, Download demo ライン機能 チャート上にオープニングライン、ストップロス、テイクプロフィットを表示します。この機能により、新規注文を簡単に設定することができ、注文を出す前にその特徴を確認することができます。   リスク計算 リスク計算機能は、設定されたリスクとストップロス注文のサイズを考慮して、新規注文のボリュームを計算します。ストップロスの大きさを自由に設定できると同時に、設定したリスクを守ることができます。 Lot calc ボタン - リスク 計算 を 有効 / 無効 にします 。 Risk フィールドでは 、必要 なリスクの 値 を 0 から 100 までのパーセンテージまたは 預金通貨 で 設定 します 。 設定」 タブで 、
                    価格が一瞬で変わる可能性のある市場では、注文はできるだけ簡単にすべきだと思いますか? Metatraderでは、注文を開くたびに、開始価格を入力し、損失を止めて利益を得るウィンドウと、取引サイズを開く必要があります。金融市場の取引では、初期預金を維持し、それを増やすために資本管理が不可欠です。それで、あなたが注文をしたいとき、あなたはおそらくあなたがどれくらいの大きさの取引を開くべきか疑問に思いますか?この単一の取引であなたの預金の何パーセントを危険にさらすべきですか?この取引からどれだけの利益を得ることができますか?また、リスクに対する利益の比率はどのくらいですか?トレードサイズを設定する前に、トレードサイズがどうあるべきかという質問に対する答えを得るために必要な計算を行います。 これらすべてを自動的に行うツールがあると想像してみてください。チャートを開き、市場分析を行い、エントリーポイント、ディフェンスポイント(ストップロス)、ターゲット(テイクプロフィット)を水平線でマークし、最後にリスクのレベルを定義します。利用可能な資本の%として、このトランザクションで負担することができ、こ
                    TradePanel MT5
                    Alfiya Fazylova
                    4.86 (115)
                    Trade Panel は、多機能の取引アシスタントです。 このアプリケーションには手動取引用の 50 以上の機能が含まれており、ほとんどの取引アクションを自動化できます。 購入する前に、デモ アカウントでデモ バージョンをテストできます。 デモは こちら から。 詳しい手順は こちら をご覧ください。 取引。 ワンクリックで基本的な取引操作を実行できます。 未決の注文とポジションをオープンする 未決の注文とポジションを決済する ポジションの反転(買いを閉じて売りをオープンする、または売りを閉じて買いをオープンする) ポジションをロックする(反対のポジションをオープンすることで、売りポジションと買いポジションの量を等しくします) すべてのポジションを部分的に決済します。 すべてのポジションのテイクプロフィットやストップロスを共通のレベルに設定します。 すべてのポジションのストップロスを損益分岐点レベルに設定します。 注文とポジションをオープンする際に、次のことが可能になります。 確立されたリスクに応じて取引量の自動計算を使用します。 ワンクリックで複数の注文を開きます。 計算された数量
                    The product will copy all telegram signal to MT5 ( which you are member) , also it can work as remote copier.  Easy to set up, copy order instant, can work with almost signal formats, image signal,  s upport to translate other language to English Work with all type of channel or group, even channel have "Restrict Saving Content", work with  multi channel, multi MT5 Work as remote copier: with signal have ticket number, it will copy exactly via ticket number. Support to backtest signal. How to s
                    Trade Manager は、リスクを自動的に計算しながら、取引を迅速に開始および終了するのに役立ちます。 過剰取引、復讐取引、感情的な取引を防止する機能が含まれています。 取引は自動的に管理され、アカウントのパフォーマンス指標はグラフで視覚化できます。 これらの機能により、このパネルはすべてのマニュアル トレーダーにとって理想的なものとなり、MetaTrader 5 プラットフォームの強化に役立ちます。多言語サポート。 MT4バージョン  |  ユーザーガイド + デモ Trade Manager はストラテジー テスターでは機能しません。 デモについてはユーザーガイドをご覧ください。 危機管理 % または $ に基づくリスクの自動調整 固定ロットサイズを使用するか、ボリュームとピップに基づいた自動ロットサイズ計算を使用するオプション RR、Pips、または価格を使用した損益分岐点ストップロス設定トレーリングストップロス設定 目標に達したときにすべての取引を自動的に終了するための 1 日あたりの最大損失 (%)。 過度のドローダウンからアカウントを保護し、オーバートレードを防ぎます
                    Pro Arbitrage EA   trades based on Arbitrage Strategy. The strategy is like a scalping technology but on three cross currency pairs at the same time. Each trade basket involves three pairs (all open at the same time) and they will close at once when any desired profit reaches. The strategy has no SL technically because all opened currencies are hedged. SL can happen if high slippages on order execution on the broker side. So the strategy is one of the safest ones in the world. Using the EA : U
                    DrawDown Limiter
                    Haidar, Lionel Haj Ali
                    5 (17)
                    Drawdown Limiter EA You are in the right place if you were searching for Drawdown control, Drawdown limiter, Balance protection, Equity Protection or Daily Drawdown Limit related to Prop Firm, FTMO, or Funded account trading, or if you want to protect your trading account. Have you suffered from controlling your drawdown when trading funded accounts? This EA is meant for you. Prop firms usually set a rule called “Trader Daily Drawdown”, and if it is not respected, you are disqualified.  I am an
                    あなたがメンバーである任意のチャネルから(プライベートおよび制限されたものを含む)シグナルを直接あなたのMT5にコピーします。  このツールは、トレードを管理し監視するために必要な多くの機能を提供しながら、ユーザーを考慮して設計されています。 この製品は使いやすく、視覚的に魅力的なグラフィカルインターフェースで提供されています。設定をカスタマイズして、数分で製品を使用を開始できます! ユーザーガイド + デモ  | MT4版 | Discord版 デモを試してみたい場合は、ユーザーガイドにアクセスしてください。 Telegram To MT5 受信機は、ストラテジーテスターで動作しません! Telegram To MT5の特徴 複数のチャネルから一度にシグナルをコピー プライベートおよび制限されたチャネルからシグナルをコピー BotトークンまたはChat IDは必要ありません   (必要に応じて使用することができます) リスク%または固定ロットを使用して取引 特定のシンボルを除外 すべてのシグナルをコピーするか、コピーするシグナルをカスタマイズするかを選択 すべてのシグナ
                    Set price targets, and leave everything else to HINN Lazy Trader! This tool is designed for automatic position sizing from specified levels to designated targets. Using a VPS is recommended (*). Current price already includes a 25% discount : Purchase (lifetime) -- $365 instead of $490 Rent (30 days) -- $50 instead of $69 The demo version generated by MT Market is automatically and is useless because to start this algo advisor, you need to specify zones of interest and targets! A community
                    YuClusters
                    Yury Kulikov
                    4.93 (43)
                    Attention: You can view the program operation in the free version  YuClusters DEMO .  YuClusters is a professional market analysis system. The trader has unique opportunities to analyze the flow of orders, trade volumes, price movements using various charts, profiles, indicators, and graphical objects. YuClusters operates on data based on Time&Sales or ticks information, depending on what is available in the quotes of a financial instrument. YuClusters allows you to build graphs by combining da
                    -25% discount ($199 -> $149) Advanced trading tool: One click smart orders that execute under your conditions Developed by trader for trading community:  position size calculator (lot size), open position after price action, strategy builder, set and forget trading, mobile notifications... Risk Management -  Risk percentage position size calculator, gain percentage, target risk reward ratio, spread and commissions are included in calculations 7 Advanced order types  - Set and forget trading w
                    The top-selling EAs on the market cost a lot and one day they are suddenly gone. This is because one strategy will not work in the forex market all the time. Our product is unique from all others in the MQL Marketplace because our EA comes with 34+ built-in indicators that allow develop strategies every time.  You build your strategy and keep updating it. If one strategy does not work, simply build another all using only one EA. This is All-In-One EA   in this market place. You can use as trade
                    This is exactly what the name says. Visual strategy builder . One of a kind. Turn your trading strategies and ideas into Expert Advisors without writing single line of code. Generate mql source code files with a few clicks and get your fully functional Expert Advisors, which are ready for live execution, strategy tester and cloud optimization. There are very few options for those who have no programming skills and can not create their trading solutions in the MQL language. Now, with Bots Build
                    -25% discount ($149 -> $111) Everything for chart Technical Analysis indicator mt5 in one tool Draw your supply demand zone with rectangle and support resistance with trendline and get alerts to mobile phone or email alert -  Risk reward indicator mt5 Video tutorials, manuals, DEMO download   here .   Find contacts on my   profile . 1.   Extended rectangles and trendlines Object will be extended to the right edge of the chart when price will draw new candles on chart. This is rectangle extend
                    取引パネルは注文の管理に限定されています - ボタンを使用して開かれたものと、ユーザーによって開かれたものの両方です。 シンプルで便利なコレクション。 バイヤーを補完します。 Gold Stuff インジケーターと併用することをお勧めします。 単一注文として取引を設定し、距離のあるグリッドを構築します。 標準グリッドを作成するには、10000 などの大きな距離を設定するだけです。 リアルタイム結果はこちらからご覧いただけます。 設定と個人的なボーナスを得るために、購入後すぐに私に連絡してください!   設定 新しいシリーズを開く - 注文の新しいシリーズのオン/オフの開始。 Lot miltiplier - 次の注文のロット乗数。 TP - ピップで利益を得る。 SL - 最初の注文からのピップ単位のストップロス。 トレイル スタート - トレーリング ストップの有効化。 トレイル ステップ - トレーリング ストップを有効にしたときの価格からの距離。 DD 削減アルゴリズム - 利益のある最後の注文が損失のある最初の注文シリーズでクローズされる場合のドローダウン削減
                    Mentfx Mmanage mt5
                    Anton Jere Calmes
                    4.43 (7)
                    The added video will showcase all functionality, effectiveness, and uses of the trade manager. Drag and Drop Trade Manager. Draw your entry and have the tool calculate the rest. Advanced targeting and close portions of a trade directly available in tool (manage trades while you sleep). Market order or limit order on either side with factored spread. Just draw the entry, the tool does the rest. Hotkey setup to make it simple. Draw where you want to enter, and the stop loss, the tool calculates al
                    ワンクリックで取引できるトレーディングパネル。ポジションと注文の操作!チャートまたはキーボードから取引。 当社の取引パネルを使用すると、チャートから直接シングルクリックで取引を実行でき、標準の MetaTrader コントロールよりも 30 倍高速に取引操作を実行できます。 パラメータと関数の自動計算により、トレーダーにとって取引がより速く、より便利になります。 グラフィックのヒント、情報ラベル、取引取引に関する完全な情報はチャート MetaTrader にあります。 MT4のバージョン 完全な説明   +DEMO +PDF 購入する方法 インストールする方法     ログファイルの取得方法     テストと最適化の方法     Expforex のすべての製品 手動取引用の取引パネル。チャート(チャートウィンドウ)またはキーボードから取引できます。  開閉、リバース、ロックポジションと注文を処理する МetaТrader5 のメインオーダーのトレーディングコントロールパネル:売買、売却、売却、売却、売却、閉じる、削除、修正、トレーリングストップ、ストップロス、takep
                    Exp COPYLOT CLIENT for MT5
                    Vladislav Andruschenko
                    3.78 (18)
                    MT5のトレードコピー機は、МetaТrader5プラットフォームのトレードコピー機です 。 それは間の 外国為替取引をコピーします   任意のは 、MT5 - MT5、MT4 - MT5   COPYLOT MT5版の アカウント (またはを MT4 - MT4   MT5 - MT4   COPYLOT MT4版用) 信頼できるコピー機! MT4のバージョン 完全な説明   +DEMO +PDF 購入する方法 インストールする方法     ログファイルの取得方法     テストと最適化の方法     Expforex のすべての製品 МТ4ターミナルでトレードをコピーすることもできます(   МТ4   -   МТ4、МТ5   -   МТ4   ):   MT4のCOPYLOT CLIENT このバージョンには、端末間 МТ5   -   МТ5、МТ4   -   МТ5が含まれ ます。 ディールコピー機は、2/3/10端末間でディール/ポジションをコピーするために作成されます。 デモ口座と投資口座からのコピーがサポートされています。 プログラムは、複数の端末
                    Grid Manual MT5
                    Alfiya Fazylova
                    4.83 (12)
                    「Grid Manual」は、注文のグリッドを操作するための取引パネルです。 ユーティリティはユニバーサルで、柔軟な設定と直感的なインターフェイスを備えています。 それは、損失を平均化する方向だけでなく、利益を増やす方向でも注文のグリッドで機能します。 トレーダーは注文のグリッドを作成して維持する必要はありません。 すべてが「Grid Manual」によって行われます。 注文を開くだけで十分であり、「Grid Manual」は注文のグリッドを自動的に作成し、非常に閉じるまでそれに付随します。 完全な説明とデモバージョン ここ。 ユーティリティの主な機能と機能 ユーティリティは、モバイル端末から開かれた注文を含め、あらゆる方法で開かれた注文を処理します。 「制限」と「停止」の2種類のグリッドで機能します。 グリッド間隔の計算には、固定と動的(ATRインジケーターに基づく)の2つの方法で機能します。 オープンオーダーグリッドの設定を変更できます。 チャート上の各注文グリッドの損益分岐点を表示します。 各注文グリッドの利益率を表示します。 ワンクリックでグリッドから収益性の高い注文を閉じるこ
                    THIS EA IS A SEMI-AUTO EA, IT NEEDS USER INPUT. Manual & Test Version Please DON'T BUY this product before testing or watching my video about it. Contact me for user support & advices! If you've bought this EA, you are entitled to a gift!! MT4 Version  With this Expert Advisor, you can: Implement your own Zone Recovery strategy to capitalize on trending markets. Create Grid trading strategies, to profit from ranging markets. Place orders easily and clearly. Display your trades/strategies on the
                    Trader Evolution
                    Siarhei Vashchylka
                    5 (3)
                    " Trader Evolution " - A utility designed for traders who use wave and technical analysis in their work. One tab of the utility is capable of money management and opening orders, and the other can help in making Elliott wave and technical analysis. Manual (Be sure to read before purchasing) | Version for MT4 Advantages 1. Trading in a few clicks. Immediate and pending orders are available in the panel 2. Money management. The program automatically selects the appropriate lot size 3. Simpli
                    UTM Manager は、迅速かつ効率的な取引執行を提供する直感的で使いやすいツールです。際立った機能の 1 つは、「スプレッドを無視」モードです。これにより、スプレッドを完全に無視して、ローソク足の価格で取引できるようになります (たとえば、LTF でより高いスプレッドのペアを取引でき、スプレッドによって取引から除外されるのを回避できます)。 UTM Manager のもう 1 つの重要な側面は、独自のローカル取引コピー機であり、各ブローカーで異なる取引戦略と設定 (たとえば、さまざまな TP、BE、およびリスク ルール) を柔軟に実行できます。 取引執行: 迅速かつ効率的な取引執行: チャート上のエントリー価格とストップロス価格をクリックして簡単に取引を入力するか、ワンクリックの固定ストップロスサイズ機能を使用します。 自動ロットサイズ計算: ロットは事前定義されたリスク設定に基づいて計算され、ドラッグによってポジションが変更されると再計算されます。 1 つまたは複数のポジションを同時に処理できる能力。 利益確定と損益分岐点: 柔軟なテイクプロフィット設定: 特定のリスク対報
                    Strategy Builder offers an incredible amount of functionality. It combines a trade panel with configurable automation (covert indicators into an EA), real-time statistics (profit & draw down) plus automatic optimization of SL, TP/exit, trading hours, indicator inputs. Multiple indicators can be combined into an single alert/trade signal and can include custom indicators, even if just have ex4 file or purchased from Market. The system is easily configured via a CONFIG button and associated pop-u
                    このエキスパートアドバイザーは、コストのかかるドローダウンを防止したり、取引ルールを遵守したりするために、取引口座のエクイティを常に監視しています。特定のルールセットに違反すると、EAは警告を発し、すべての取引を終了し、場合によっては、保留中のすべての注文を削除します。オプションで、すべてのチャートを閉じて、アカウントで動作しているすべてのEAを削除することもできます。このEAは、FTMOチャレンジやPZチャレンジなどの自己勘定取引チャレンジに特に役立ちます。 [ インストールガイド | アップデートガイド | トラブルシューティング | FAQ | すべての製品 ] 次の機能が実装されており、自由に有効または無効にできます。 エクイティ最大損失、別名トレーリングエクイティドローダウン 毎日のエクイティ最大損失 エクイティ利益目標 エクイティトレーリングストップ その他の利点は次のとおりです。 使いやすいデッド 自己勘定取引会社やトレーダーに便利 あらゆる種類のアラートを実装します ターミナルに報告する 技術的な案内: それはそれ自身で最大エクイティとデイリーエクイ
                    Features   With MT5 to Interactive Brokers(IB) Trader, you can: 1. Load chart data from IB to MT5, and Analyze with all standard or customer Indicators. 2. Place Orders to IB Account Directly in MT5. 3. Make your Own EAs upon IB Securities by only making minus changes of the trading function. Usage 1) Installation Copy the "Mt5ToIBTraderEn.ex4" and sample files to [MT5 Data Folder]->MQL5->Experts.  2)  MT5 Settings Add the IP Address to the MT5 Allowed URLs in 'Tools->Options->Exper
                    The Expert Advisor will help you forward all alert from  MetaTrader 5 to Telegram channel/ group.  All alert must save to folder <Data folder>MQL5\Files\Alerts\ , text file with format *.txt and screenshot with format *.gif or *.png. Parameters: - Telegram Bot Token: - create bot on Telegram and get token. - Telegram Chat ID:  - input your Telegram user ID,  group / channel ID - Forward Alert: - default true, to forward alert. - Send message as caption of Screenshot: - default false, set true
                    Elliott Wave Helper
                    Siarhei Vashchylka
                    4.92 (12)
                    Elliott Wave Helper - a panel for making elliott wave and technical analysis. Includes all known wave patterns, support and resistance levels, trend lines and cluster zones. Manual (Be sure to read before purchasing) | Version for MT4 Advantages 1. Making wave analysis and technical analysis in a few clicks 2. All Elliott wave patterns available, including triangle and combinations 3. All nine wave display styles, including a special circle font 4. E lements of technical analysis : trend lines
                    Would you like to automate your trading using a custom indicator of your choice? This EA trades using almost any custom indicator. It offers fully customizable settings, flexible position management, customizable trading sessions and weekdays, an inverse mode and a martingale mode. All the robot needs from you are two inputs: The filename of the indicator to trade The signal buffer or the buy/sell buffers to call That's it! The signal buffer or the buy/sell buffers should be provided by the dev
                    このプログラムを使用すると、非常に使いやすいユーザーインターフェースを使用して、MetaTraderアカウントからすべての取引を直接Notionにエクスポートできます。 MT4バージョン  |  ユーザーガイド + デモ 開始するには、ユーザーガイドを使用してNotionテンプレートをダウンロードしてください。 デモをご希望の場合は、ユーザーガイドにアクセスしてください。ストラテジーテスターでは機能しません! 主な機能 取引アカウントからすべての取引をNotionにエクスポート 実行中の取引および保留中の注文をNotionにエクスポートし、更新 テンプレートを作成する 前日からの取引をエクスポート 前週からの取引をエクスポート 前月からの取引をエクスポート カスタム時間範囲からの取引をエクスポート 新しいクローズされた取引をすべて自動的にNotionに送信 エクスポートに含めるフィールドを選択します。注文タイプ、ボリューム、オープン時間、クローズ時間など 開始方法 上記のユーザーガイドに移動するか、EAを起動して「接続ヘルプを取得」をクリックします 接続後、「開始:すべての取引
                    Trade Assistant 38 in 1
                    Makarii Gubaydullin
                    4.87 (15)
                    多機能ツール 搭載機能: ロット計算機、プライスアクション、リスク/リワードレシオ、トレードマネージャー、需要供給ゾーンなどをはじめ65以上の機能。 バージョ:デモ版   |   ユーザーマニュアル   |    MT5版 このユーティリティはストラテジー テスターでは機能しません。 ここからデモ   バージョンをダウンロードして製品をテストできます。 ご不明な点や改善提案、バグの発見などございましたら、 連絡してください 。 取引プロセスを簡素化、高速化、自動化します。このダッシュボードで標準端末機能を拡張します 1. 新しい取引を開始します : ロット / リスク / RR の計算 1. Lot計算機(リスクサイズに基づく取引量計算 2. リスク計算機(ロットサイズに基づくリスク量) 3. リスク/リワードレシオ (R/R) 4. 注文のアクティベーション トリガー + Buy StopLimit / Sell StopLimit 5. 仮想 SL / TP レベル (隠しSL、TP: ブローカーには見えない) 6.  Smart SL / エントリー レベル: バ
                    作者のその他のプロダクト
                    Multi timeframe ZigZag indicator. It displays the support/resistance horizontal lines and their breakouts, as well as draws the current targets of the market. It can also display lines of the Fractals indicator and candles from other periods (up to Quarterly).  The indicator redraws the last (current) point, and in some cases can change the last 2-3 points. All lines are drawn as objects (not indicator buffers, but there is a possibility to receive the data for the EA ). When used in an Exp
                    Multicurrency and multitimeframe modification of the Stochastic Oscillator. You can specify any desired currencies and timeframes in the parameters. The panel displays the current values and intersections of the lines — Signal and Main (stochastics crossover). Also, the indicator can send notifications when crossing overbought and oversold levels. By clicking on a cell with a period, this symbol and period will be opened. This is MTF Scanner. The key to hide the dashboard from the chart is "D"
                    Multicurrency and multitimeframe modification of the indicator Moving Average (MA). On the dashboard you can see the current state of the indicator - breakouts and touches (by price) of the Fast MA and Slow MA, as well as the intersection of the MA lines between each other   (moving average crossover) . In the parameters you can specify any desired currencies and timeframes. Also, the indicator can send notifications about the price touching the lines and about their crossing. By clicking on a
                    このインジケーターは、ジグザグインジケーター、取引セッション、フラクタル、またはローソク足(非標準の時間枠:年、6 か月、4 か月、3 か月、2 か月を含む)に基づいてフィボナッチ レベルを自動的に描画します(自動フィボ リトレースメント)。 フィボナッチ計算には、より高い時間枠を選択できます。 現在のバーが閉じるたびにレベルが再描画されます。 指定したレベルを超えたときにアラートを有効にすることができます。 履歴のレベルを分析することもできます。 これを行うには、「過去の Fibo レベルの数」パラメーターで Fibo レベルの数を指定する必要があります。 パラメーター Calculate Fibo according to — Fibo 検索モード: Candles (High-Low) — 高値-安値に基づいてフィボナッチを構築します。 Candles (Close-Close) — 終値-終値に基づいてフィボナッチを構築します。 ZigZags — ZigZag ポイントによって Fibo を構築します。 Sessions — 取引セッションごとに Fibo
                    Symbol Manager or Grid Manager, designed to group orders into one position (by symbol and by direction). This utility will be useful to multi-currency traders, who can have multiple orders on several pairs. You will be able to see the total number of lots, the total profit, and set virtual stop loss and virtual take profit. To set a real TP (or SL), you must first set the virtual value, and then enter the command in this cell: "set". If you want to set real TP/SL for all orders at once, then en
                    Multicurrency and multitimeframe modification of the indicator Bollinger Bands. On the dashboard you can see breakouts and touches of the Bollinger Bands. In the parameters you can specify any desired currencies and timeframes. The indicator can also send notifications when the price touches the Bollinger Bands, when the current volatility changes (expands or falls), and when the price touches all the bands. By clicking on a cell with a period, this symbol and period will be opened. This is MTF
                    ADX indicator is used to determine the trend and its strength. The direction of the price is shown by the +DI and -DI values, and the ADX value shows the strength of the trend. If +DI is above -DI, then the market is in an uptrend, if on the contrary, it is a downtrend. If ADX is below 20, then there is no definite direction. As soon as the indicator breaks this level, a medium-strength trend begins. Values above 40 indicate a strong trend (a downtrend or an uptrend). Multicurrency and multit
                    ADX Dashboard
                    Taras Slobodyanik
                    5 (3)
                    ADX indicator is used to determine the trend and its strength. The direction of the price is shown by the +DI and -DI values, and the ADX value shows the strength of the trend. If +DI is above -DI, then the market is in an uptrend, if on the contrary, it is a downtrend. If ADX is below 20, then there is no definite direction. As soon as the indicator breaks this level, a medium-strength trend begins. Values above 40 indicate a strong trend (a downtrend or an uptrend). Multicurrency and multit
                    Multicurrency and multitimeframe modification of the Stochastic Oscillator. You can specify any desired currencies and timeframes in the parameters. The panel displays the current values and intersections of the lines — Signal and Main (stochastics crossover). Also, the indicator can send notifications when crossing overbought and oversold levels. By clicking on a cell with a period, this symbol and period will be opened. This is MTF Scanner. The key to hide the dashboard from the chart is "D"
                    ZigZag Lines MTF
                    Taras Slobodyanik
                    4.27 (11)
                    Multi timeframe ZigZag indicator. It displays the support/resistance horizontal lines and their breakouts, as well as draws the current targets of the market. It can also display lines of the Fractals indicator and candles from other periods (up to Quarterly).  The indicator redraws the last (current) point, and in some cases can change the last 2-3 points. All lines are drawn as objects (not indicator buffers, but there is a possibility to receive the data for the EA ). When used in an Exp
                    Multicurrency and multi timeframe modification of the Relative Strength Index (RSI) indicator. You can specify any desired currencies and timeframes in the parameters. Also, the panel can send notifications when crossing overbought and oversold levels. By clicking on a cell with a period, this symbol and period will be opened. This is MTF Scanner. The key to hide the dashboard from the chart is "D" by default. Similar to the Currency Strength Meter, the Dashboard can automatically select pairs
                    インジケーターは現在のシンボルの利益(損失)を表示します。 線を自由にドラッグ&ドロップして現在の損益を表示できます。 パラメーター Calculation in money or in points — 損益をポイントまたは金額で計算します。 Add pending orders to calculate — 計算では未決注文を考慮します。 Magic Number (0 - all orders on symbol) — 特定の注文を評価する必要がある場合のマジック ナンバー。 Offset for first drawing (points from the average price) — 最初の開始時の平均価格からのラインのオフセット。 Decimal places for calculating the Sum — 合計を表示するための小数点以下の桁数。 Decimal places for calculating the Percentage — パーセンテージを表示するための小数点以下の桁数。 Tuning チューニング Color of the
                    FREE
                    Time Scale for MT5
                    Taras Slobodyanik
                    4.88 (17)
                    The indicator draws the time scale on the chart. You can specify the time offset, adjust the size and font to display on the chart ( it is displaying your local time on your chart instead of MT time ). You can also select the desired format for displaying the date and time. You may be interested in my other product , which contains a more advanced version of the Time Scale . Parameters Hours (time shift) — time shift (hours); Minutes (time shift) — time shift (minutes); Show time on mouse — sh
                    FREE
                    Multicurrency and multitimeframe modification of the ZigZag indicator. Displays the current direction of the market, the height of the last movement, the number of bars in this movement and the breaking of the previous point of the ZigZag (horizontal line). This is MTF Scanner. You can specify any desired currencies and timeframes in the parameters. Also, the panel can send notifications when the ZigZag changes direction or when there was a breakthrough of the previous point. By clicking on a
                    Lines Profit Loss
                    Taras Slobodyanik
                    4.82 (22)
                    インジケーターは現在のシンボルの利益(損失)を表示します。 線を自由にドラッグ&ドロップして現在の損益を表示できます。 パラメーター Calculation in money or in points — 損益をポイントまたは金額で計算します。 Add pending orders to calculate — 計算では未決注文を考慮します。 Magic Number (0 - all orders on symbol) — 特定の注文を評価する必要がある場合のマジック ナンバー。 Offset for first drawing (points from the average price) — 最初の開始時の平均価格からのラインのオフセット。 Decimal places for calculating the Sum — 合計を表示するための小数点以下の桁数。 Decimal places for calculating the Percentage — パーセンテージを表示するための小数点以下の桁数。 Tuning チューニング Color of the
                    FREE
                    Multicurrency and multitimeframe modification of the Commodity Channel Index (CCI) indicator. You can specify any desired currencies and timeframes in the parameters. Also, the panel can send notifications when crossing overbought and oversold levels. By clicking on a cell with a period, this symbol and period will be opened. This is MTF Scanner. The key to hide the dashboard from the chart is "D" by default. Parameters CCI Period — averaging period. CCI Applied price — price type. Clear
                    MA Dashboard
                    Taras Slobodyanik
                    4.5 (2)
                    Multicurrency and multitimeframe modification of the indicator Moving Average (MA). On the dashboard you can see the current state of the indicator - breakouts and touches (by price) of the Fast MA and Slow MA, as well as the intersection of the MA lines between each other (moving average crossover) . In the parameters you can specify any desired currencies and timeframes. Also, the indicator can send notifications about the price touching the lines and about their crossing. By clicking on a cel
                    Multicurrency and multitimeframe modification of the ZigZag indicator. Displays the current direction of the market, the height of the last movement, the number of bars in this movement and the breaking of the previous point of the ZigZag (horizontal line). This is MTF Scanner. You can specify any desired currencies and timeframes in the parameters. Also, the panel can send notifications when the ZigZag changes direction or when there was a breakthrough of the previous point. By clicking on a
                    Multi-currency and multitimeframe Heikin Ashi indicator. Shows the current state of the market. On the scanner panel you can see the direction, strength and number of bars of the current trend. The Consolidation/Reversal candles are also shown using color. You can specify any desired currencies and periods in the parameters. Also, the indicator can send notifications when the trend changes or when reversal and consolidation candles (dojis) appear. By clicking on a cell, this symbol and period wi
                    Multicurrency and multitimeframe indicator of the Standard Deviation Channel. Displays the current direction of the market. On the panel, you can see breakouts and touches (by price) of the levels of the linear regression channel. In the parameters, you can specify any desired currencies and timeframes. Also, the indicator can send notifications when levels are touched. By clicking on a cell, this symbol and period will be opened. This is MTF Scanner. The key to hide the dashboard from the char
                    Multi-currency and multi-timeframe indicator MACD. The dashboard can display both the Traditional (true) MACD and the MACD which is built into MetaTrader. On the panel you can see the current state of the indicator — the direction of movement of the MACD lines, their intersection and a pop-up window with the indicator chart. In the parameters you can specify any desired pairs-symbols and timeframes. The scanner can also send notifications about lines crossing each other and about lines crossing
                    Multi-currency and multitimeframe Heikin Ashi indicator. Shows the current state of the market. On the scanner panel you can see the direction, strength and number of bars of the current trend. The Consolidation/Reversal candles are also shown using color. You can specify any desired currencies and periods in the parameters. Also, the indicator can send notifications when the trend changes or when reversal and consolidation candles (dojis) appear. By clicking on a cell, this symbol and period wi
                    This is an indicator of trading sessions  that can display all levels (Open-High-Low-Close) for four sessions. The indicator can also predict session levels. Sessions can be drawn with lines or rectangles (empty or filled), lines can be extended to the next session. You can easily hide/show each session by pressing hotkeys (by default '1', '2', '3', '4'). You can see ASR (Average Session Range) lines  (default hotkey 'A'). This is similar to the ADR calculation, only it is calculated based on t
                    Multicurrency and multitimeframe modification of the Relative Strength Index (RSI) indicator. You can specify any desired currencies and timeframes in the parameters. Also, the panel can send notifications when crossing overbought and oversold levels. By clicking on a cell with a period, this symbol and period will be opened. This is MTF Scanner. The key to hide the dashboard from the chart is "D" by default. Similar to the Currency Strength Meter, the Dashboard can automatically select pairs c
                    This is an indicator of trading sessions  that can display all levels (Open-High-Low-Close) for four sessions . The indicator can also predict session levels. Sessions can be drawn with lines or rectangles (empty or filled), lines can be extended to the next session. You can easily hide/show each session by pressing hotkeys (by default '1', '2', '3', '4'). You can see ASR (Average Session Range) lines  (default hotkey 'A'). This is similar to the ADR calculation, only it is calculated based on
                    Time Scale
                    Taras Slobodyanik
                    4.8 (10)
                    The indicator draws the time scale on the chart. You can specify the time offset, adjust the size and font to display on the chart (it is displaying your local time on your chart instead of MT time). You can also select the desired format for displaying the date and time. While holding down the middle mouse button, and moving the cursor, a slider will appear on the scale. You may be interested in my other product , which contains a more advanced version of the Time Scale. Parameters Hours (tim
                    FREE
                    The Gann Box (or Gann Square) is a market analysis method based on the "Mathematical formula for market predictions" article by W.D. Gann. This indicator can plot three models of Squares: 90, 52(104), 144. There are six variants of grids and two variants of arcs. You can plot multiple squares on one chart simultaneously. Parameters Square — selection of a square model: 90 — square of 90 (or square of nine); 52 (104) — square of 52 (or 104); 144 — universal square of 144; 144 (full) — "full"
                    Multi-currency and multi-timeframe indicator MACD. The dashboard can display both the Traditional (true) MACD and the MACD which is built into MetaTrader. On the panel you can see the current state of the indicator — the direction of movement of the MACD lines, their intersection and a pop-up window with the indicator chart. In the parameters you can specify any desired pairs-symbols and timeframes. The scanner can also send notifications about lines crossing each other and about lines crossing
                    The indicator has three main tools: Magnifier (Zoom chart), Ruler  ( Time and Price scales ),   and Crosshair. You can move it all around with your mouse and customize different formats for  displaying , customize   size and color of each element. The Magnifier (zoom chart) allows you to display candles from any time frame and at different scales. Default hotkeys: 'Q' - higher timeframe, 'A' - lower timeframe, 'W' - decrease candle size, 'S' - increase candle size, 'Z' - show/hide zoom chart.
                    The indicator has three main tools: Magnifier (Zoom chart), Ruler  ( Time and Price scales ),   and Crosshair. You can move it all around with your mouse and customize different formats for  displaying , customize   size and color of each element. The Magnifier (zoom chart) allows you to display candles from any time frame and at different scales. Default hotkeys: 'Q' - higher timeframe, 'A' - lower timeframe, 'W' - decrease candle size, 'S' - increase candle size, 'Z' - show/hide zoom chart.
                    フィルタ:
                    レビューなし
                    レビューに返信
                    バージョン 6.50 2024.03.20
                    1) Changed the behavior of setting the timer at startup. Now the Dashboard tries to start the timer again when a new tick arrives. If there is no tick for a long time (or it’s a weekend), you can click on the button on the chart and restart the timer yourself.
                    バージョン 6.40 2024.02.12
                    1) An additional filter "Manage only if the news has an enabled alert on the panel" has been added to "Trade management".
                    バージョン 6.30 2024.02.04
                    1) Correction of minor bugs when displaying news on the chart.
                    バージョン 6.20 2024.02.03
                    1) Added activation of alerts and news when a new week begins and the “Activate all alerts” and “Activate all news on the chart” parameters are enabled.
                    バージョン 6.10 2023.12.02
                    1) Added parameters for hiding some columns from the table: 'Impact', 'Actual', 'Forecast', 'Previous'.
                    2) Added the "Code Page for Characters" parameter. If your system uses a different encoding (for example, Chinese or Japanese), then you may need to change this setting in order to see the characters correctly in the dashboard.
                    バージョン 6.0 2023.10.23
                    1) Added news source from "nfs.faireconomy.media" (hotkey 'J'). In the WebRequest parameters, you need to add the link: "https://nfs.faireconomy.media/ff_calendar_thisweek.json".
                    2) Added "Time format" parameter: 12-hour clock (am/pm) or 24-hour clock.
                    3) Fixed time shift bug for Holidays.
                    バージョン 5.90 2023.10.03
                    1) Fixed an error in sorting news by currency in "Trade management".
                    バージョン 5.80 2023.09.29
                    1) The procedure for generating a resource for external EA or Indicators has been changed. The total amount of news that is sent is approximately 200-300 (no more than 16 KB). First, the next news is generated, and then the previous ones. If the next news takes up all 16KB, then the previous news will not fit and will not be sent.
                    バージョン 5.70 2023.09.19
                    1) The FILE_SHARE_READ flag has been added to access news files.
                    バージョン 5.60 2023.08.25
                    1) The country of the news has been added to the tooltip.
                    2) Fixed MQL5 calendar error - "ERR_CALENDAR_TIMEOUT".
                    バージョン 5.50 2023.08.23
                    1) The news format has been changed on the forexfactory website.
                    バージョン 5.40 2023.05.06
                    1) Added a tooltip with the full name of the currency.
                    2) Added a tooltip for the current timezone.
                    バージョン 5.30 2023.05.05
                    1) Fixed getting GMT time from FFC site.
                    2) Fixed "app-calendar-actual" bug.
                    バージョン 5.20 2023.04.23
                    1) Recompilation for a new build.
                    バージョン 5.10 2023.03.19
                    1) For Investing.com news, fixed mapping of country name to currency name.
                    2) For Investing.com news, a bug in displaying special characters has been fixed.
                    バージョン 5.0 2023.03.12
                    1) Added a calendar from the site "investing.com". For it to work, you need to add the link "https://ec.forexprostools.com" in the terminal settings.
                    バージョン 4.80 2023.03.09
                    1) Fixed news sorting bug.
                    バージョン 4.70 2023.03.08
                    1) Recompilation.
                    バージョン 4.60 2023.03.08
                    1) Changed the news format on the forexfactory website.
                    バージョン 4.50 2023.03.07
                    1) Changed the news format on the forexfactory website.
                    バージョン 4.40 2023.02.27
                    1) The algorithm for highlighting the nearest news has been changed.
                    2) Fixed a bug when creating a resource for an external EA.
                    バージョン 4.30 2023.02.18
                    1) Fixed a bug when clicking on Time.
                    バージョン 4.20 2023.02.06
                    1) Updated functions for sending news to external EAs or Indicators. See the description in the Comments.
                    バージョン 4.0 2022.06.14
                    1) Fixed a bug when switching the MQL calendar to FFC.
                    2) Fixed "empty news" bug in MQL calendar.
                    バージョン 3.90 2022.06.10
                    1) Fixed a bug in the MQL Calendar. The calendar can slip news outside the selected date. Because of this, there was an incorrect processing of news in EA.
                    バージョン 3.80 2022.06.09
                    1) Fixed "array out of range" bug.
                    バージョン 3.70 2022.05.23
                    1) Fixed pressing the Ctrl key for the new version of MT5.
                    バージョン 3.60 2022.02.03
                    1) Added parameters "Hotkeys". Now you can toggle 'Last Week','This Week','Next Week' using hotkeys.
                    バージョン 3.50 2021.12.27
                    1) Fixed a bug with memorizing panel coordinates when minimizing / maximizing.
                    2) Displaying the panel in the foreground of the chart.
                    バージョン 3.40 2021.12.26
                    1) Fixed bug when getting the year number from "forexfactory.com".
                    2) Fixed bug when starting several EA at the same time.
                    バージョン 3.10 2021.11.04
                    1) Recompilation. Resized and removed the ZeroMemory for the union structure.
                    バージョン 3.0 2021.11.03
                    1) Changed the function of sending news to EA. Now, if a lot of news comes out at the same time, EA will receive all of them.
                    バージョン 2.90 2021.10.19
                    1) Now your EA (or indicator) can take news from the Dashboard. See the description in the comments.
                    バージョン 2.80 2021.10.01
                    1) Fixed the bug of spaces in the news.
                    バージョン 2.70 2021.09.18
                    1) Added parameters of the sound file for the first and second alerts.
                    バージョン 2.60 2021.08.17
                    1) Added "Trade management" parameters. Now EA can close positions and orders before news, set breakeven and close trades at the end of the day.
                    バージョン 2.50 2021.07.22
                    1) Added "Color ink Revised" parameter.
                    2) Code optimization.
                    バージョン 2.40 2021.07.20
                    1) Added mql5.com calendar for MT5 version (www.mql5.com/en/economic-calendar).
                    バージョン 2.30 2021.05.31
                    1) Fixed a bug when clicking on "Maximize day".
                    バージョン 2.20 2021.05.28
                    1) Added the "Color for the enabled alert" parameter.
                    バージョン 2.10 2021.05.27
                    1) Fixed bug with "Use static settings".
                    バージョン 2.0 2021.05.27
                    1) Added a parameter to activate all alerts at once (at start) - "Activate all alerts".
                    2) Added a parameter to activate all news on the chart (at start) - "Activate all news on the chart".
                    3) Added parameters for sorting news without using a mouse - "Use static settings (don't use mouse select)".
                    バージョン 1.90 2021.05.25
                    1) Now while holding down the CTRL key, you can select the desired currencies and the impact of news. After releasing the CTRL button, only the selected currencies (and impact) will be displayed.
                    バージョン 1.80 2021.04.19
                    1) Fixed a bug with the "Collapse all Days" icon.
                    バージョン 1.70 2021.04.08
                    1) Added message: "DDoS protection by Cloudflare! Please turn JavaScript on, enable Cookies and restart MT."
                    バージョン 1.60 2021.03.31
                    1) Fixed a bug with the transition of FFC to daylight saving time.
                    バージョン 1.50 2021.03.18
                    1) Fixed bug with empty news on weekends.
                    2) Accelerated scrolling.
                    3) Minor code fixes.
                    バージョン 1.40 2021.03.17
                    1) Fixed a bug with displaying html symbols in news.
                    バージョン 1.30 2021.03.08
                    1) Fixed the error 'array out of range'.
                    バージョン 1.20 2021.03.03
                    1) Added a clock showing the current time. Click on the clock - go to the current news.
                    2) Added an icon for collapsing and expanding all days at once.
                    3) Added highlighting of the current today's news.
                    4) Correction of minor bugs.