Liquidity level
- インディケータ
- Navdeep Singh
- バージョン: 1.3
- アップデート済み: 19 1月 2022
- アクティベーション: 10
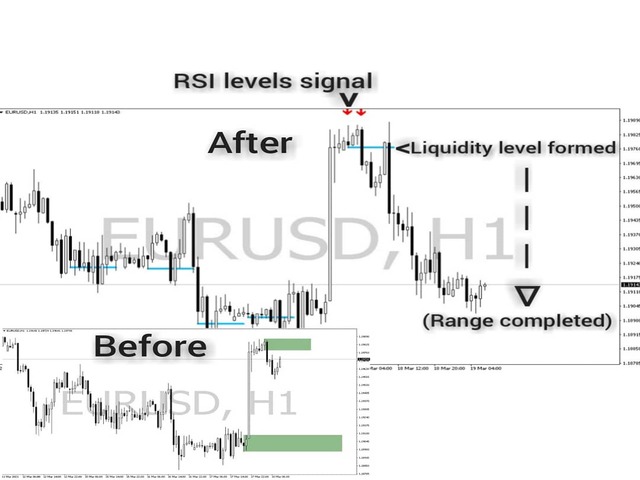
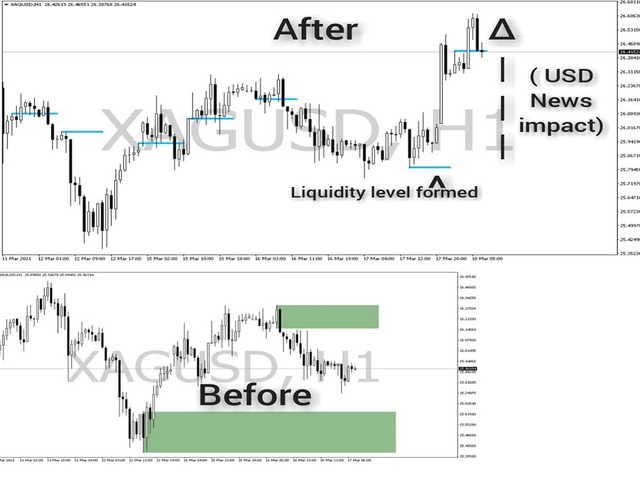
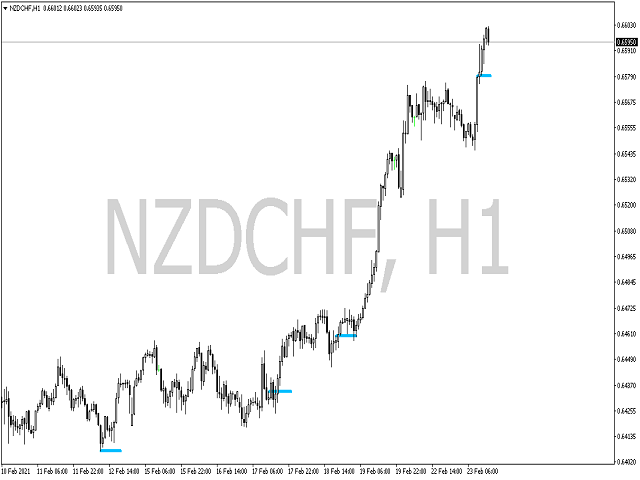
The indicator helps the trader in identifying potential liquidity levels. The algorithm used in this indicator checks the behavior of the asset taking into account the price levels, momentum and volume analysis.
Features:-
Parameters for signal optimization and alerts.
Usage:-
The levels formed by the indicator can be helpful to traders in identifying potential entries, breakouts or reversals. it can assist traders of technical trading background or even pure price action trading.
Examples of using the indicator in technical analysis is shown in the screenshots below.