Correlation Dashboard
- インディケータ
- Christopher Cyril Abu Aita
- バージョン: 2.2
- アップデート済み: 20 8月 2021
- アクティベーション: 5
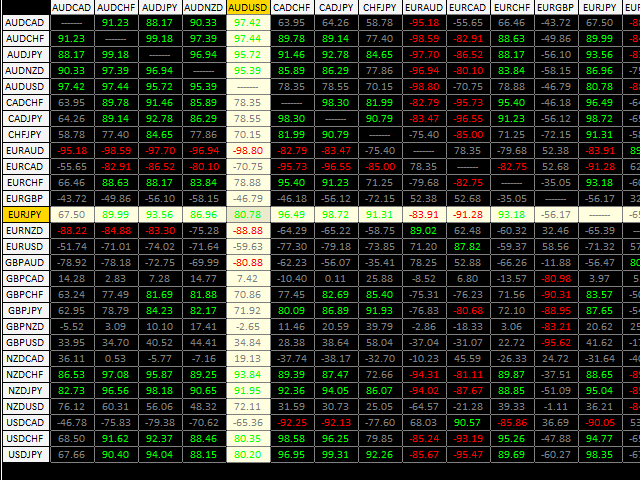
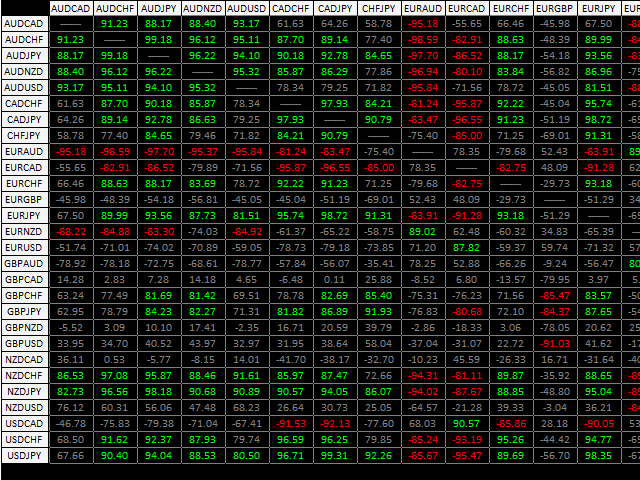
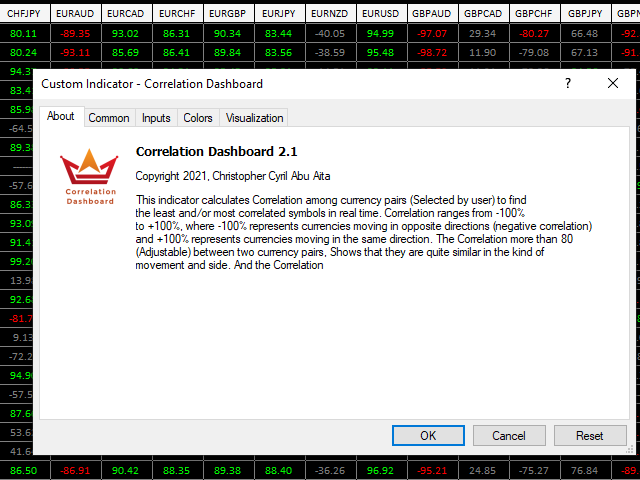
This indicator calculates Correlation among currency pairs (Selected by user) to find the least and/or most correlated symbols in real time.
Correlation ranges from -100% to +100%, where -100% represents currencies moving in opposite directions (negative correlation) and +100%
represents currencies moving in the same direction.
Note
The Correlation more than 80 (Adjustable) between two currency pairs, Shows that they are quite similar in the kind of movement and side.
The Correlation less than minus 80 between two currency pairs, Shows that they are quite similar in the kind of movement but inverse in side.
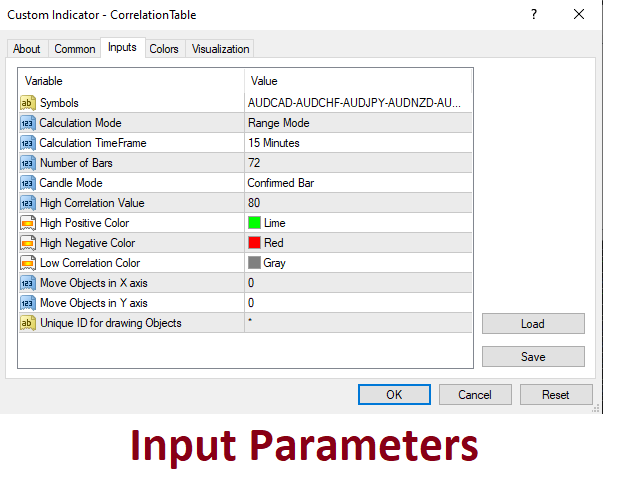
Indicator Parameters
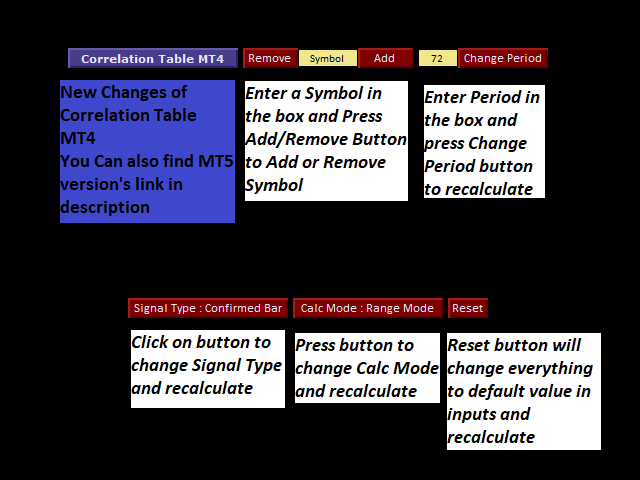
- Symbols You can select the pairs that you need. Default is 28 currency pairs
- Calculation TimeFrame The timeframe in which you want the calculations to be done
- Calcuation Period Number of bars to consider for Indicator's calculation
- Calculation Mode
Range Mode The correlation will be calculated based on Ranges of the past bars (Range = High-Low)
Close Mode The correlation will be calculated based on Closes of the past bars
- Signal Type
Current Bar The calculations will be done based on the current candle of the pairs
ConfirmedBar The calculations will be done based on the the last closed candle of the pairs
- Considered Correlation Percent If this option equals 80, The currency pairs that are correlated more than 80%, Will be shown in green color, And the currency pairs that are correlated less than minus 80%, Will be shown in red color.
- Positive Correlated Background Color Background Color of correlated pairs more than +80%
- Positive Correlated Text Color Text Color of correlated pairs more than +80%
- Negative Correlated Background Color Background Color of correlated pairs less than -80
- Negative Correlated Text Color Text Color of correlated pairs less than -80
- Rows/Columns Back Color Background Color of Rows/Columns Title
- Rows/Columns Text Color Text Color of Rows/Columns Title
- Table Border Color Border Color of table
- Main Cells Back Color Table Cells Background Color
- Main Cells Text Color Table Cells Text Color
- Selected Cells Color Background Color of selected cells by click on them
- Cells Width in Pixels (0 Means Auto Calc) Set cell's width or set it to zero to auto calculation of cells width
- Cells Height in Pixels (0 Means Auto Calc) Set cell's height or set it to zero to auto calculation of cells height
- Move Dashboard in X axis Move table to the right side
- Move Dashboard in Y axis Move table to the down side
- Font Font face of Texts
- Font Size Font Size of Texts