Sync Link MultiTimeframe Charts
- インディケータ
- Hiren Parekh
- バージョン: 1.1
- アップデート済み: 13 2月 2021
- アクティベーション: 5
If You Are Discretionary Trader This Tool Is A Must
Chart Switcher ------> Linking Multi-Time Frame Charts / Syncing Indicators And Drawings.
Main USP Of This Indicator:
Is Opening Multi-Time Frame Multiple Charts {Up To 10 Charts} Of A Symbol With Just 1 Click.
You Do not Have To Save Any Template As It has Been Save Auto When You Click Same Symbol Or Move To Another Symbol.
It Is Divided Into 2 Parts:
1} COMMON MODE and 2} SYMBOL MODE
1}COMMON MODE:
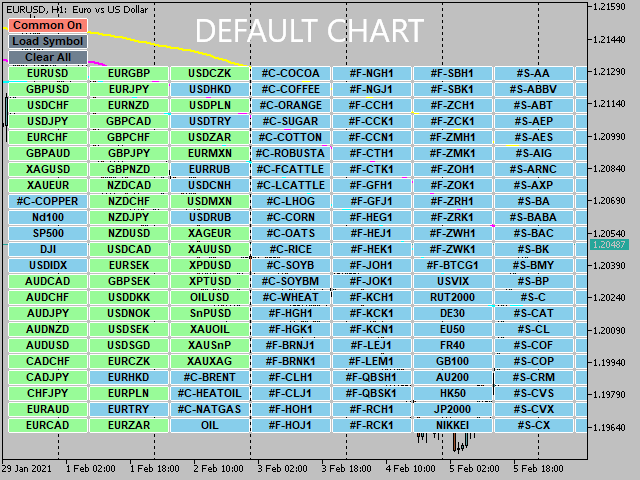
Under This Mode, You Can Sync Common Template To Multi-Time Frame Charts And Any Symbol In The Market Watch.
When The Common Mode Is ON Then Any Indicator Placed On Default Chart Will Get Copied On Another Timeframe Of The Same Symbol And When You Move To Another Symbol By Clicking On Symbol Or Up/Down Arrow Key It Will Copy All Those Indicators On That Symbol Also.
2}SYMBOL MODE:
Under This Mode You Can Create Template Especially Based On Each Symbol. Any Indicator Placed On The Symbol Will Only Get Copied To Its Other Timeframe Charts. So, For Every Symbol, You Can Create Your Template.
If You Use My Indicator Multi Timeframe Drawing Support Resistance
With This Then It Will Remember Your Drawings Also Exactly Like The Trading View. So Now You Don't Have To Pay Huge Monthly Fees.
IMPORTANT THINGS TO REMEMBER:
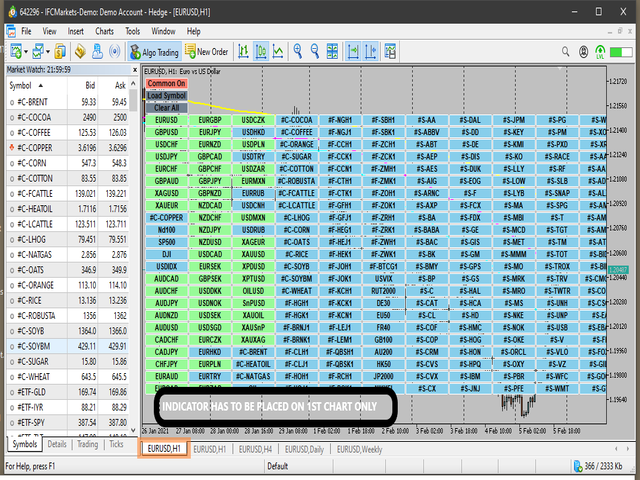
1}Sync Link MultiTimeframe Charts INDICATOR HAS TO BE PLACED ON 1ST CHART ONLY, OTHERWISE IT WILL NOT WORK.
2}ANY INDICATOR TO CREATE TEMPLATE NEEDS TO BE PLACED ON DEFAULT CHART ONLY.
3} YOU CAN MOVE FROM ONE SYMBOL TO ANOTHER BY CLICKING UP/DOWN ARROW KEYS.

