Average Aggression Bulls vs Bears
- インディケータ
- Edson Cavalca Junior
- バージョン: 1.0
- アクティベーション: 20
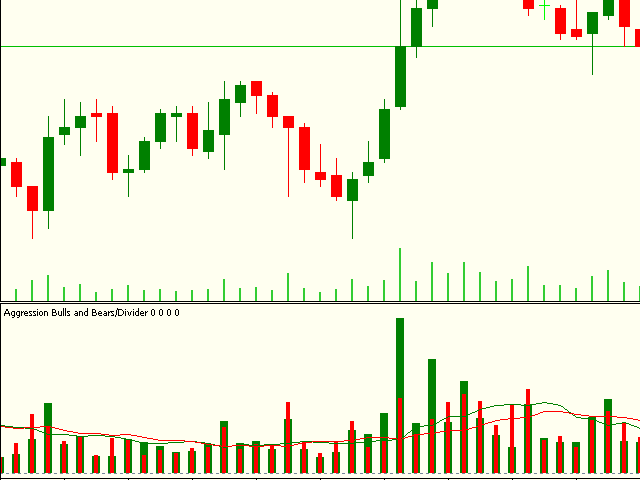
The indicator plots the buying and selling volume on the chart.
Two lines are generated corresponding to the average purchase and sale volumes.
The crossing of averages, the increase in their distance are good indicators of market movement.
NOTES:
- It is recommended to use the default configuration and VPS values.
- You need trading information (Time and Sales).
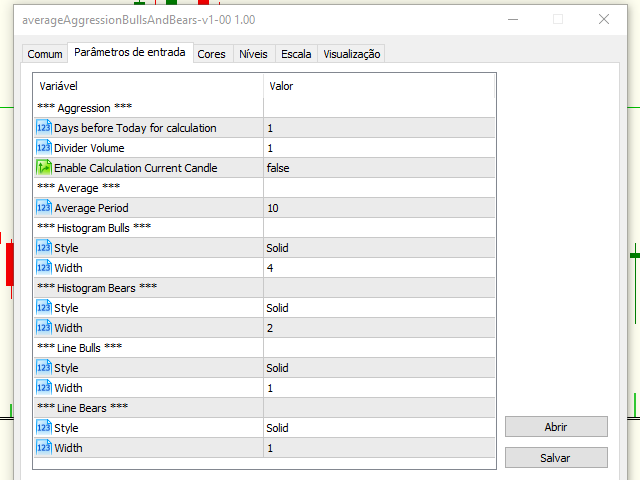
Parameters:
Aggression
- Numbers of days prior to the current one for calculation;
- Volume Divider e;
- Enables calculation of the current candle;
Average
- Average Period
Histogram Bulls
- Line style and;
- Size;
Histogram Bears
- Line style and;
- Size;
Line Bulls
- Line style and;
- Size;
Line Bears
- Line style and;
- Size;
Edson Cavalca Junior
Systems Analyst

