MA Speedometer
- インディケータ
- Davit Beridze
- バージョン: 1.4
- アップデート済み: 28 4月 2021
- アクティベーション: 5
Dashboard for Ma Speedometer: https://www.mql5.com/en/market/product/116784
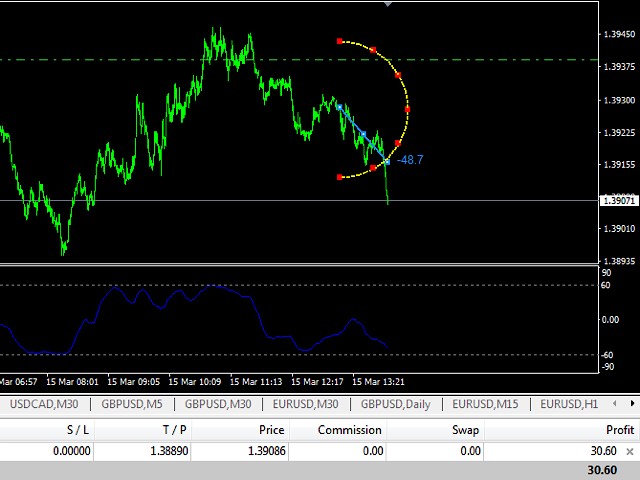
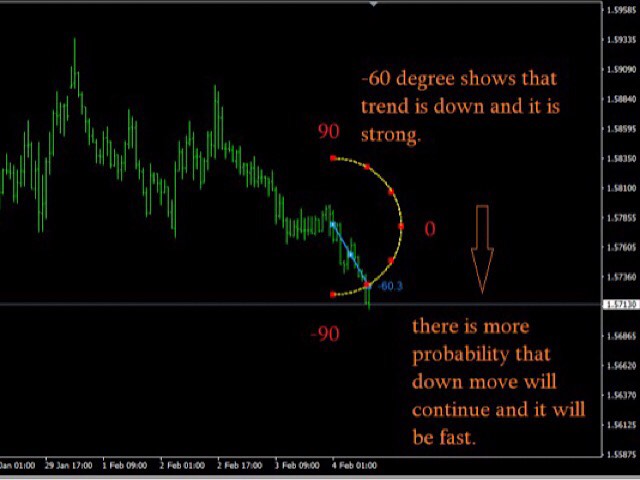
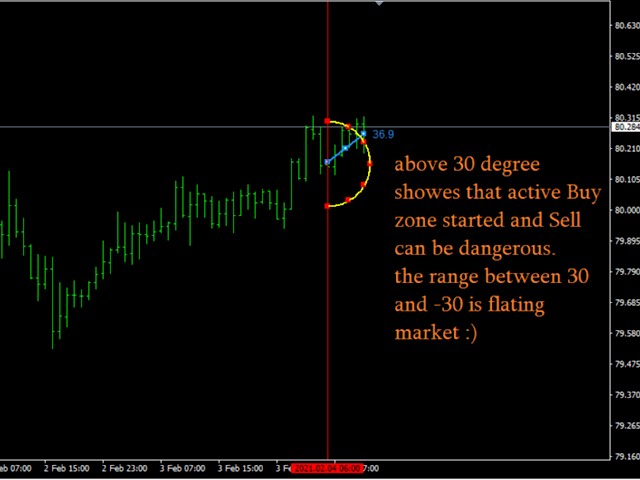
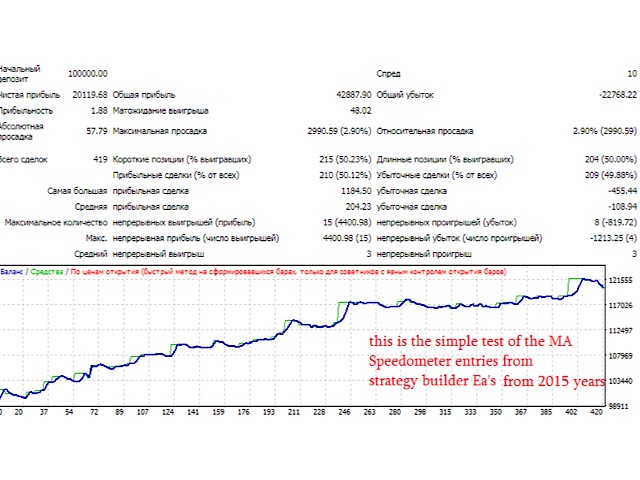
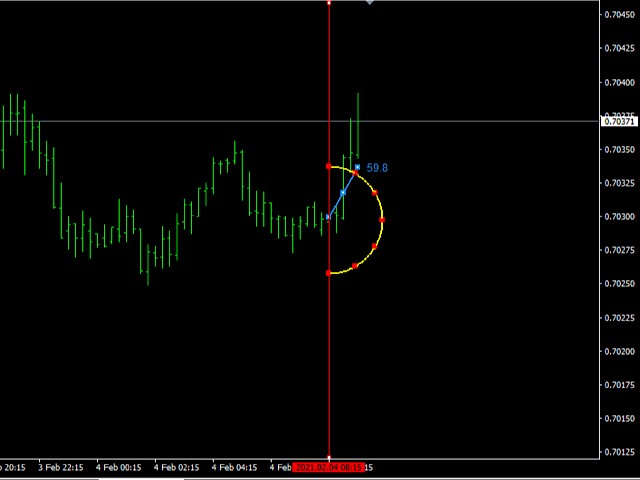
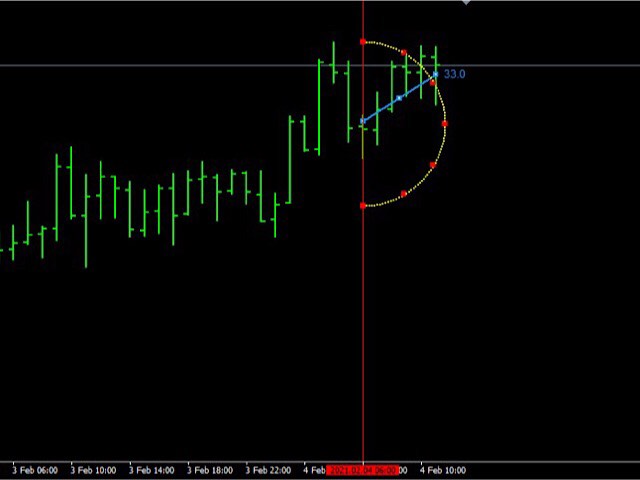
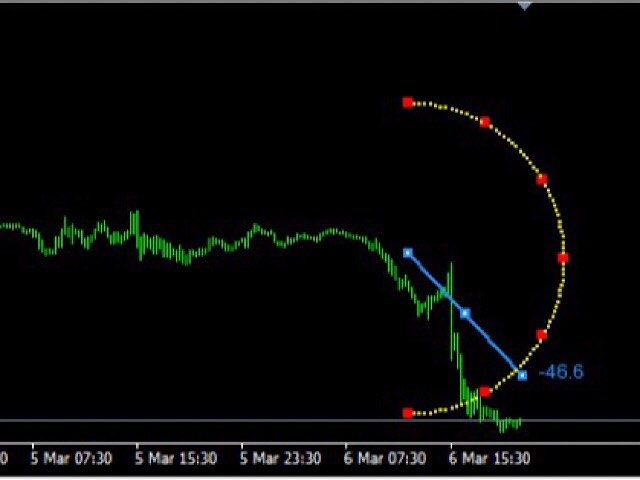
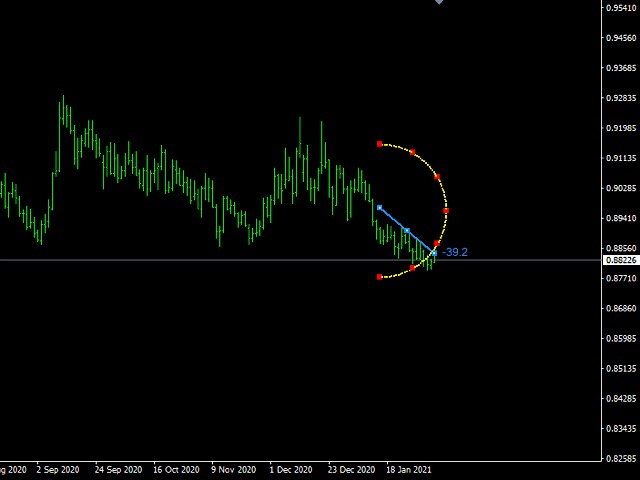
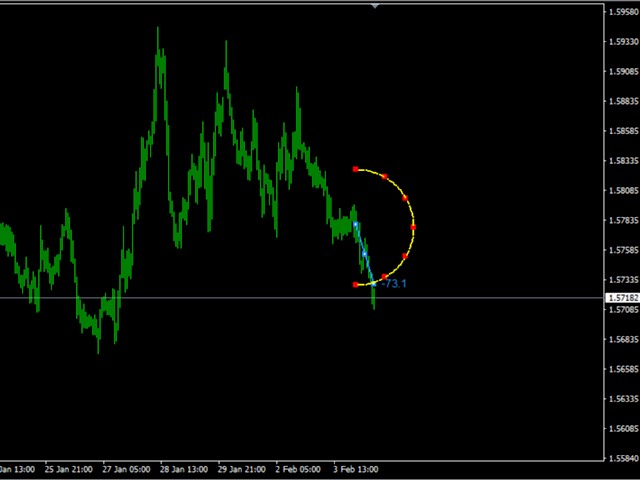
Non standard attitude to the standard moving average indicator. The essence of the indicator is to determine the strength and speed of the price direction by determining the tilt angle of the moving average. A point is taken on the fifteenth MA candle and a point on the last closed MA candle, a straight line is drawn between them, it is movable and on a hemisphere shows an angle of inclination from 90 degrees to -90. above 30 degrees is the buying area, below -30 degrees is the selling area. above 60 degrees the zone of strong purchases below -60 strong sales. The indicator is an excellent addition for any trading systems as a filter and also can be used as the main tool for new trading systems, since it separately shows stable growth in strategy testers. All numbers above are approximate, indicator contains the following settings: StartBar (number of candles from the most recent to determine the length of the speedometer needle); maPeriod; maPrice; maMethod; notifications (push, voice, mail) and also possibility to show history with line moving from 90 to -90 range (please note this line window showes history only and does not show overbought or oversold situations).
The indicator is very practical to use and worthy of attention. In case of purchase please Pm me for further assistance. There is Gift indicator for them who makes full purchase
here is MT5 version as well: https://www.mql5.com/ru/market/product/62619?source=Site+Profile+Seller


This indicator performance is mind blowing very accurate really a game changer in the Forex trading industry I wish I can give it a 50 star rating .you can now trade with confidence and no more guess work just follow instructions and the sky is the limit