• 概要
  • レビュー
  • コメント (1)
  • 最新情報

PointFigureKagiCharts

This non-trading expert utilizes so called custom symbols feature (available in MQL API as well) to build custom charts based on history of real ticks of selected standard symbol.

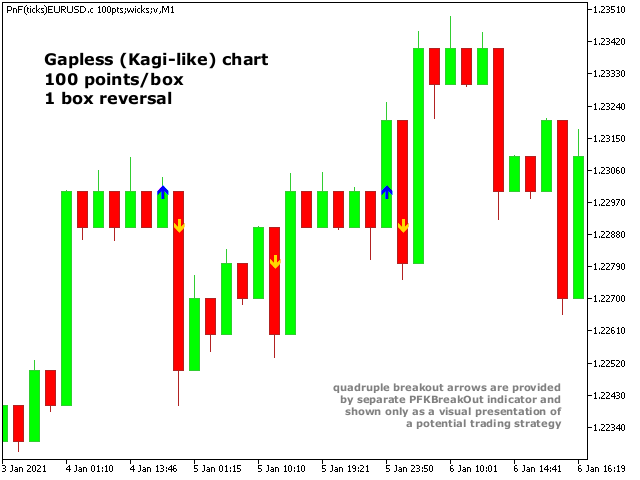
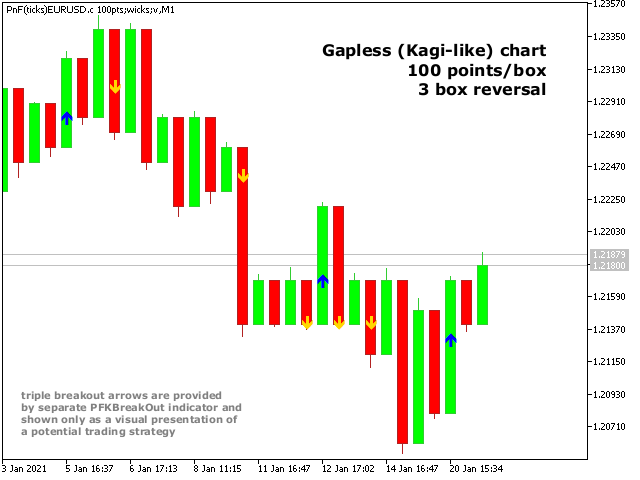
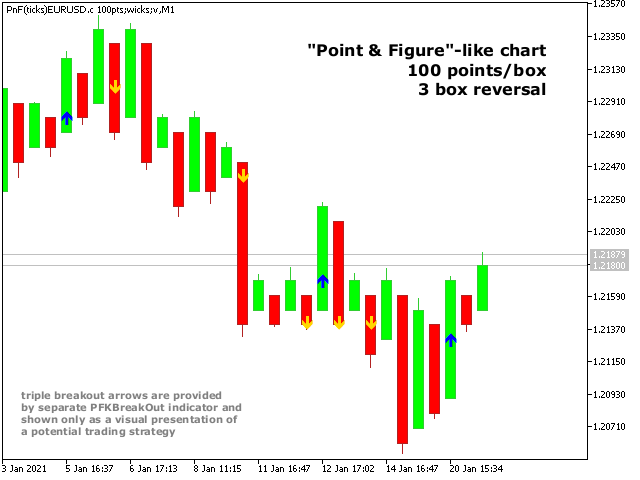
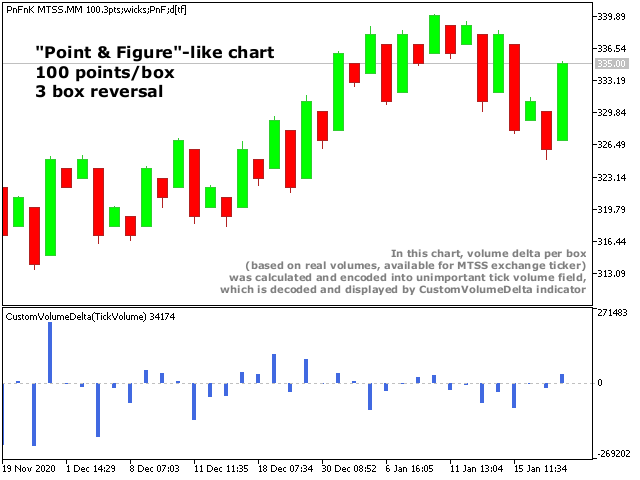
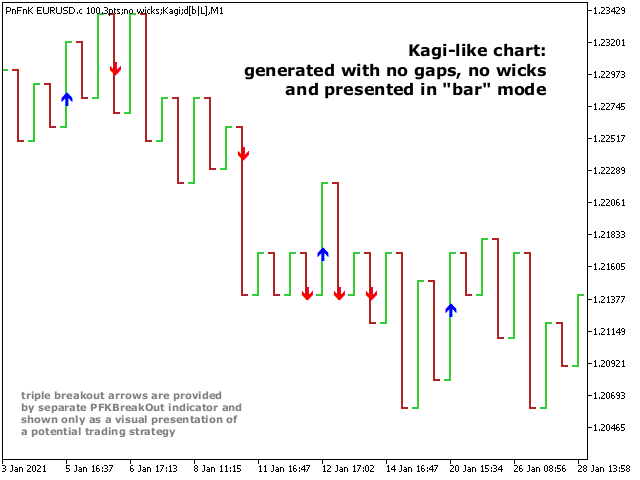
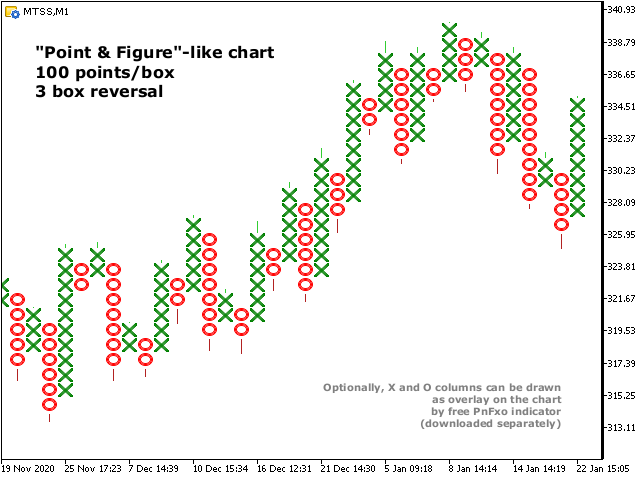
New charts imitate one of well-known graphic structures: Point-And-Figure (PnF) or Kagi. The result is not exactly PnF's X/O columns or rectangular waves of Kagi. Instead it consists of bars, calculated from and denoting stable unidirectional price moves (as multiples of the box size), which is equivalent to XO columns or polygonal lines.

These Point-And-Figure-like and Kagi-like charts (PFK) provide time-invariant presentation of prices, a kind of "packed" Renko.

The program generates custom symbol quotes, thus you may open many charts to apply different EAs and indicators to the boxes. It also transmits real ticks to update the custom charts in real time.

The generated PFK chart uses M1 timeframe. It makes no sense to switch the chart to a timeframe other than M1. The start time of a "minute" bar corresponds to the moment it began to form. The end time of such "minute" bar is dummy (MetaTrader does not allow for bars with different duration), instead you should look at the start time of the next "minute" bar.

After its placement on a chart, PointFigureKagiCharts downloads tick history and generates PFK bars for the custom symbol. This may take a while and require additional space on the disk. EA shows a progress in the comment. When the process is finished, the comment looks like this:

PnFKagiChart(100pt): open EURUSD_PFK100.2 / 1000 bars

where 100pt is the requested box size in points, EURUSD_PFK100.2 is a customizable symbol name, 1000 is a number of generated boxes (if EA is running for the very first time, this is the total number of PFK bars, but if it continues on results of a previous terminal session, the number of new boxes can be a few, because only most recent, missing boxes are generated).

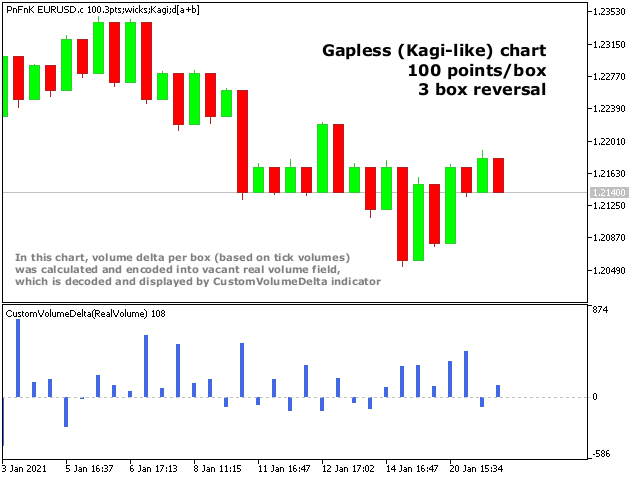
Unique feature - volume delta per box. The delta is encoded in a special way, because MetaTrader does not support negative volumes. This is why you need free CustomVolumeDelta indicator to view it.


PointFigureKagiCharts utility does not work in the tester. Use this DEMO to test it.


Parameters

  • BoxSize - box size in points, by default - 100;
  • ReversalFactor - number of boxes, required to start new bar in opposite direction;
  • ShowWicks - enable/disable wicks, by default - true;
  • EmulateOnLineChart - enable/disable ticks emulation on PFK charts, by default - true; this updates indicators and other EAs on backtests and online;
  • OutputSymbolName - name of the custom symbol, by default - empty string - then the name is formed as "Symbol_PFKSuffixSize.Factor", where Symbol - current work symbol, Size - BoxSize, Factor - ReversalFactor; optional Suffix: "b" for box mode without wicks; "g" for gapless (Kagi) type;
  • ResetID - a unique number to enforce complete recalculation of entire PFK chart, if the ID is changed since previous generation of the same custom symbol, by default - 0; recalculation is helpful in rare cases, when generated PFK chart contains an error for some reason; normally ID should be left untouched, because the EA continues calculation smartly from the most recent existing box;
  • BoxType - selector of the box calculation algorithm: Conventional (Point-And-Figure) or Gapless (Kagi), see examples in the pictures;
  • VolumeType - selector of the volumes per box calculations: Total Volume, or Delta Volume with either of 4 algorithms (Ask vs Bid, Ask + Bid, Tick Flags, Bid or Last);
  • DropTicksOutsideBars - filter out incorrect ticks (outliers);
  • StartFrom - time where to start the tick history processing, 0 means very beginning;
  • StopAt - time where to stop, 0 means till current time;

Volume Delta Methods

For Ask vs Bid, tick volumes are considered for buy if Ask price increases, and for sell if Bid decreases (please note, that on some accounts/symbols Bid changes more frequent than Ask, which introduces a negative bias; this is the platform specificity).

Ask+Bid analyses the changes of the average price (sum of Ask and Bid): move up - buy, move down - sell.

Tick Flags is based on buy/sell tick flags and applicable for exchanges only.

Bid/Last checks price type used by chart.


おすすめのプロダクト
Gann Box MT5
Frederic Jacques Collomb
Gann Box インジケーターは、トレーダーが市場の重要なレベルを特定し、活用するのを支援するために設計された強力で多機能なツールです。このインジケーターを使用すると、チャート上に長方形を描くことができ、それが自動的に 0, 0.25, 0.50, 0.75, 1 の戦略的レベルを持つ複数のゾーンに分割されます。価格がこれらのレベルのいずれかに達すると、アラートがトリガーされ、トレーディングの意思決定に貴重な支援を提供します。描いたゾーンに対する市場の動きを即座に把握できます。ゾーンをトレースするには、単純な長方形を描いて名前を GannBox に変更するだけです。 このインジケーターは、 サポートとレジスタンス の概念を使用するトレーダー、 サプライとデマンド 、 ICTテクニック 、または**公正価値ギャップ(FVG)**の専門家など、すべてのタイプのトレーダー向けに設計されています。 デイトレーダー、スイングトレーダー、またはポジショントレーダーであろうと、 Gann Box は市場の動きをより良く理解し予測する手助けをし、反応性とパフォーマンスを向上させます。 MT4バージョ
It works according to the spread trading strategy. The essence of spread strategies is to profit from the difference between asset prices. When prices diverge, two opposite transactions are opened for different currency pairs. Closing occurs when prices converge backwards or according to signals from the neural network.   Parameters Symbol1                           -   the first currency pair Symbol1                            - the second currency pair DiffPrevCurrOpenB          -  the discr
Would you like to have statistics about your trades displayed while you operate? Have you a solid understanding of the symbol you are trading? Do you really know everything you need to about your trading account? Do you need to keep an eye on the local times around the world? Advanced Info Displayer answers to all that. It helps you to know many hidden or hard to find data. Also, it is very convenient if you value statistics and maths. Just to exemplify, in more than 80 lines of information you
MT5 Broker  Rates (OHLC, candles) HTTP Provider Description EA turns your MT5 terminal into   historical/realtime rates  data provider for your application.  There are many market data providers on the internet, but in practice, the data provided is not always of good quality. Moreover, these services are often more expensive and typically require monthly subscription fees per each symbol. With this EA, you can feed your application with exactly the same rates data that you see in the MT5 term
Monitor your favorite Symbols My   #1 Utility:  includes 65+ functions, including this tool  |   Contact me  if you have any questions This tool opens in a separate window: it can be moved (drag anywhere), and minimized [v]. You can adjust the Watchlist on the panel: Click [edit list] to add / remove the Symbols from the Watchlist. Calculated value: it may either be the last [closed bar], or the current [floating bar]. Select the [timeframe] for calculation. There are 2 types of the value sorti
This indicator allows to hide CCI oscillator (on all MT5 timeframes) from a date define by the user, with a vertical line (Alone) or a panel (with "Hidden Candles"). Indicator Inputs: Period Apply To Information on "Commodity Channel Index" indicator is available here:   https://www.metatrader4.com/en/trading-platform/help/analytics/tech_indicators/commodity_channel_index ************************************************************* Hey traders!!  Give me your feeds!  We are a community here and
FREE
Knowledge of the strength and weakness of each currency is vital for every forex trader. Our   Currency Strength Meter indicator   measures the strength of eight major currencies (USD, EUR, GBP, CHF, JPY, CAD, AUD, NZD) by using the Relative Strength Index indicator, also known as RSI. The Currency Strength Meter indicator shows you, simply and quickly, when a currency is oversold, overbought, or in "normal area". This way, you can identify which currency is the strongest and the weakest. Our
N-second K-line chart, customizable, monitoring multiple seconds of multiple symbols simultaneously, all Chinese parameters, easy to use -------------------------------------------------------------------------------------------------------------- You can ask me any questions in private messages https://www.mql5.com/en/users/chaoping0326 Customization of indicators and EA for MT4 and MT5 is available Long term programming project (MT4 from 2012, MT5 from 2016). Good programming skills, reasonabl
Calculation panel has been developed to aid in Forex trading using a method based on correlation dependence of currency pairs. The panel implements: Due to the fact that the working instruments of the "basket" have an equal volatility and pip values, the panel provides automatic calculation of the second instrument's lot size. To analyze the relative divergence of two currency pairs, the information based on the RSI indicator values (in percentages) are shown on the panel. Information on swaps o
革新的な Trades Time Manager を使用して、取引ルーチンを簡単に管理できます。この強力なツールは、指定された時間に注文執行を自動化し、取引アプローチを変革します。 購入から注文の設定まで、すべて手動介入なしで、さまざまな取引アクションのためのパーソナライズされたタスク リストを作成します。 Trades Time Manager のインストールと入力ガイド EA に関する通知を受け取りたい場合は、MT4/MT5 ターミナルに URL を追加してください (スクリーンショットを参照)。 MT4のバージョン     https://www.mql5.com/en/market/product/103716 MT5のバージョン     https://www.mql5.com/en/market/product/103715 手動監視に別れを告げ、合理化された効率を採用します。直感的なインターフェイスにより、シンボル、約定時間、価格、ストップロス (SL)、テイクプロフィット (TP) ポイント、ロットサイズなどの正確なパラメーターを設定できます。 このツールの柔軟性は、市
The Multiple Position Opening is a multi-symbol multi-timeframe script used to open simultaneously various positions.  Risk Management   The volume used to open a position is chosen between a fixed and a variable lot size, available through the Volume and Free Margin % input parameters, respectively. If there isn't enough money in the account for the chosen volume, this is reduced to the highest possible value (corresponding to free margin). If this reduction leads to a correct volume (if the
FREE
Hello This EA for send any indicator Signals (buffer) to your channel in Telegram with photo for chart also you can share your signals with your clients in your telegram please watch the photos you must have Telegram channel then make bot and give it Permission and get token (watch this video to know how do it) https://www.youtube.com/watch?v=x1bKWFOjSBE and you must download this files https://drive.google.com/file/d/1pYpnWUr4Kb4aIwdoGVD_9zSH1HWX-tt3/view?usp=sharing then unzip files the
Attention All ICT Students! This indispensable tool is a must-have addition to your trading arsenal... Introducing the ICT PD Arrays Trader: Empower your trading with this innovative utility designed to enhance and simplify your ICT trading strategy and maximize your potential profits.  How does it work? It's simple yet highly effective. Begin by placing a rectangle on your trading chart and assigning it a name like 'ict' or any preferred identifier. This allows the system to accurately ide
このスクリプトは、さまざまなウィンドウ関数の重みを評価するように設計されています。これらのウィンドウ機能に基づいて構築されたインジケーターは、 https://www.mql5.com/ru/market/product/72160 からダウンロードできます。 入力パラメータ: iPeriod –インジケーター期間。 iPeriod> = 2 iCenterは、ウィンドウ関数の中心が配置される参照のインデックスです。デフォルトでは、このパラメーターは0です。ウィンドウの中心はインジケーターの中心と一致します。 1 <= iCenter <= iPeriodの場合、ウィンドウ関数の中心がシフトし、その結果、インジケーターのいくつかの特性が変化します。図1では、中心の選択がウィンドウ機能とインジケーターの表示にどのように影響するかを確認できます。このパラメータは、0.5刻みで変更できます。 Histogramwidth-ヒストグラムの幅。 Histogramcolor-ヒストグラムの色。 Showduration-期間を表示します。 スクリーンショット-このオプションを有効にすると、画像
FREE
The indicator compares quotes of a given symbol and a synthetic quote calculated from two specified referential symbols. The indicator is useful for checking Forex symbol behavior via corresponding stock indices and detecting their convergence/divergence which can forecast future price movements. The main idea is that all stock indices are quoted in particular currencies and therefore demonstrate correlation with Forex pairs where these currencies are used. When market makers decide to "buy" one
Do not buy before seeing the Danko Trend Color product, as this panel is a way to view a summary of this indicator on various timeframes. The Danko DTC Panel utility allows you to look at the trend in up to 5 timeframes. When clicking on the timeframe texts, a new window will open with the indicator plotted on the screen so you can see the complete chart. The width of the panel, with the amount of candles you want to see, is customizable, see the images below. Ao clicar nos textos dos timefra
テレグラムチャネルで信号を交換して公開しますか?次に、このユーティリティはあなたのためです。 -ターミナルでの取引 -テレグラムチャネルに取引を公開します あなたの顧客は喜ぶでしょう: -毎日5つの信号から -信号の美しいデザイン カスタマイズ [サービス]-> [設定]-> [エキスパートアドバイザー]-> [次のURLのWebリクエストを許可する]:https://api.telegram.org Telegramで、@ BotFatherにアクセスし、ボットを作成します ボットのトークンをコピーして、アドバイザーのパラメーターに入力します チャンネルを作成して公開する 作成したボットをチャンネルに追加し、管理者にします リンクをたどってください:https://api.telegram.org/bot [TOKEN_BOTA] / sendMessage?chat_id = @ [USERNAME_KANALA]&text = TEST。角かっこ[]を独自の値に置き換えます。私の場合 https://api.telegram.org/bot12854
Hidden Gap by MMD Hidden Gap by MMD is a unique indicator that detects hidden gaps between three consecutive candles. This observation isn't my own, but in the MMD methodology, it has its application alongside other original indicators. You can apply this indicator to the chart multiple times and set the interval from which you want to see the hidden gaps. You can show or hide these gaps as needed. For example, you can view the chart at an M5 interval and see hidden gaps from an M15 chart, etc.
Orion Telegram Notifier Bot  allows the trader to receive trade notifications in his Telegram whenever a position is opened or closed. The EA sends notifications showing the Symbol, Magic Number, Direction, Lot (Volume), Entry Price, Exit Price, Take Profit, Stop-Loss and Profit of the position. How to setup Orion Telegram Notifier? Open Telegram and Search for “BotFather” Click or Type “/newbot” Create a nickname and username (Example: nickname: MT5trades   - username: MT5TelegramBot) *The us
This utility tool draws the ticker symbol and timeframe information as a watermark in the background of the chart. It may come in handy if you have multiple charts on the screen at the same time. Inputs: Font Name:  You can change text font by typing in the name of your favorite font installed on your operating system. (e.g.: Verdana, Palatino Linotype, Roboto, etc...)   Font Color: You can choose your favorite from the available colors or type in a custom RGB color (values from 0 to 255, e.g.:
Hello This EA for send Orders Signals when you open or close order and send statics to your channel in Telegram with sum of profit or Loss Pips you can share your orders with your clients in your telegram please watch our video  to see how it is fast. https://www.youtube.com/watch?v=u_7twtYZhyI you must have Telegram channel then make bot and give it Permission and get token (watch this video to know how do it) https://www.youtube.com/watch?v=x1bKWFOjSBE and you must download this files h
This EA has been developed, tested and traded live on NASDAQ M15 TF. Everything is ready for immediate use on real account. Very SIMPLE STRATEGY with only FEW PARAMETERS.  Strategy is based on  EXPANSION ON THE DAILY CHART .   It enters if volatility raise after some time of consolidation .  It uses  STOP   pending orders with  ATR STOP LOSS.   To catch the profits is a  TRAILING PROFIT  function in the strategy.  EA has been backtested on more than 10-year long tick data with 99% quality of mo
このユーティリティーは、見たいローソク足パターンがチャート上に表示されると、すぐに携帯電話に詳細な通知を送り、MT5ターミナルにアラートを表示します。通知には、シンボル、ローソク足パターン、パターンが形成されたタイムフレームが含まれます。 メタトレーダー5モバイルとWindows端末をリンクする必要があります。方法はこちらをご覧ください。 https://www.metatrader5.com/ja/mobile-trading/iphone/help/settings/settings_messages#notification_setup 検出できるCandlestickパターンの一覧です。 三匹の白い兵隊 三羽の黒いカラス 強気の三本線打ち 弱気の三本勝負 スリーインサイド・アップ スリー・インサイド・ダウン スリーアウトサイドアップ スリーアウトサイドダウン モーニングスター イブニングスター 強気のアバンドンドベイビー Bearish Abandoned Baby(ベアリッシュ・アバンドンド・ベイビー 強気のハラミ Bearish Harami Bullish En
Due to the fact that at each separate period of time, trading and exchange platforms from different parts of the planet are connected to the trading process, the Forex market operates around the clock. Depending on which continent trading activity takes place during a certain period, the entire daily routine is divided into several trading sessions. There are 4 main trading sessions: Pacific. European. American Asian This indicator allows you to see the session on the price chart. You can als
Tired of information overload when analyzing forex currency strength? Introducing "All Currency Strength Live", the ultimate dashboard indicator for MetaTrader 5 that simplifies your trading life. This innovative tool provides a clear, concise overview of the strength of all major currencies, empowering you to make informed trading decisions with ease. With "All Currency Strength Live,"  you gain access to real-time insights into both price and volume strength across all major currencies. No mor
Current strength of the 8 major currencies My   #1 Utility:  includes 65+ functions, including this indicator  |   Contact me  if you have any questions The indicator is displayed in a separate window, it can be moved to any place on the chart. In the input settings   you can adjust: Interface theme : dark / white; Prefix and Suffix,  if the currency pairs on your broker have it: (e.g. if Symbol is "EURUSD .pro ", please set " .pro " as a Suffix); Panel size Font size
トレンドキャッチャー: アラートインジケーター付きのトレンドキャッチャーストラテジーは、市場トレンドやポテンシャルなエントリーポイントやエグジットポイントを特定するのに役立つ多目的な技術分析ツールです。動的なトレンドキャッチャーストラテジーを備えており、市場状況に適応してトレンドの方向を明確に視覚化します。トレーダーは、自身の好みやリスク許容度に合わせてパラメーターをカスタマイズできます。このインジケーターはトレンドの識別を支援し、ポテンシャルなリバーサルをシグナルし、トレイリングストップのメカニズムとして機能し、市場への迅速な対応のためのリアルタイムアラートを提供します。 特徴: - トレンドの識別:上昇トレンドと下降トレンドをシグナルします。 - トレンドのリバーサル:ローソク足の色が上昇から下降に変わった場合やその逆の場合に、ポテンシャルなリバーサルを警告します。 - リアルタイムアラート:新しいトレンドの識別に対するアラートを生成します。 推奨事項: - 通貨ペア:EURUSD、AUDUSD、XAUUSDなど... - タイムフレーム:H1。 - アカウン
FREE
Deku
Tshivhidzo Moss Mbedzi
don't forget to leave reviews and comments . so that i can make more free tools for you guys . show me some support  The systems have no money management or other elements of risk accumulation. Data on charts are updated every hour and shows how many points the systems win. There will be a constant process of adding new forex expert advisors with good expectations and removing these with bad results. Trading with forex ea is a marathon, not a sprint. Going fast with huge risk equals throwing
FREE
The strategy which is applied in finance market all around the world is known as CTA strategy. A successful CTA always includes multi-strategies, multi-instruments and multi-timeframe. The series of Multi Instruments TrendSystem (MITS) provide a profitable strategy which can be used in different instruments with different timeframe. Multi Instruments TrendSystem 3 BS  MT5 (Blood Sword)  is a fully automated multi-instrument Expert Advisor. This EA is one of our trend strategies EA, it can be u
Plug & Play portfolio - series of high-quality EURUSD H1 strategies for maximized success. The eighth strategy, the last one from the EUR-8 portfolio , uses BollingerBands mean reversal method for setting up the pending order. To have a whole portfolio of strategies, which trades for you is incredibly efficient, don't miss that opportunity. Check my other strategies today! and assemble your portfolio. Benefits for you Plug & Play system , designed to have   simple initial setup . That's saved
このプロダクトを購入した人は以下も購入しています
Trade Assistant MT5
Evgeniy Kravchenko
4.37 (166)
取引 ごとのリスクの 計算、新規注文 の 簡単 な 設置、部分的 な 決済機能 を 持 つ 注文管理、 7 種類 のトレーリングストップなど 、便利 な 機能 を 備 えています 。 注意、アプリケーションはストラテジーテスターでは機能しません。 説明ページからデモ版をダウンロードできます  Manual, Description, Download demo ライン機能 チャート上にオープニングライン、ストップロス、テイクプロフィットを表示します。この機能により、新規注文を簡単に設定することができ、注文を出す前にその特徴を確認することができます。   リスク計算 リスク計算機能は、設定されたリスクとストップロス注文のサイズを考慮して、新規注文のボリュームを計算します。ストップロスの大きさを自由に設定できると同時に、設定したリスクを守ることができます。 Lot calc ボタン - リスク 計算 を 有効 / 無効 にします 。 Risk フィールドでは 、必要 なリスクの 値 を 0 から 100 までのパーセンテージまたは 預金通貨 で 設定 します 。 設定」 タブで 、
価格が一瞬で変わる可能性のある市場では、注文はできるだけ簡単にすべきだと思いますか? Metatraderでは、注文を開くたびに、開始価格を入力し、損失を止めて利益を得るウィンドウと、取引サイズを開く必要があります。金融市場の取引では、初期預金を維持し、それを増やすために資本管理が不可欠です。それで、あなたが注文をしたいとき、あなたはおそらくあなたがどれくらいの大きさの取引を開くべきか疑問に思いますか?この単一の取引であなたの預金の何パーセントを危険にさらすべきですか?この取引からどれだけの利益を得ることができますか?また、リスクに対する利益の比率はどのくらいですか?トレードサイズを設定する前に、トレードサイズがどうあるべきかという質問に対する答えを得るために必要な計算を行います。 これらすべてを自動的に行うツールがあると想像してみてください。チャートを開き、市場分析を行い、エントリーポイント、ディフェンスポイント(ストップロス)、ターゲット(テイクプロフィット)を水平線でマークし、最後にリスクのレベルを定義します。利用可能な資本の%として、このトランザクションで負担することができ、こ
TradePanel MT5
Alfiya Fazylova
4.85 (115)
Trade Panel は、多機能の取引アシスタントです。 このアプリケーションには手動取引用の 50 以上の機能が含まれており、ほとんどの取引アクションを自動化できます。 購入する前に、デモ アカウントでデモ バージョンをテストできます。 デモは こちら から。 詳しい手順は こちら をご覧ください。 取引。 ワンクリックで基本的な取引操作を実行できます。 未決の注文とポジションをオープンする 注文のグリッドを開く 未決の注文とポジションを決済する ポジションの反転(買いを閉じて売りをオープンする、または売りを閉じて買いをオープンする) ポジションをロックする(反対のポジションをオープンすることで、売りポジションと買いポジションの量を等しくします) すべてのポジションを部分的に決済します。 すべてのポジションのテイクプロフィットやストップロスを共通のレベルに設定します。 すべてのポジションのストップロスを損益分岐点レベルに設定します。 注文とポジションをオープンする際に、次のことが可能になります。 確立されたリスクに応じて取引量の自動計算を使用します。 ワンクリックで複数の注文を開き
Local Trade Copier EA MT5
Juvenille Emperor Limited
4.99 (69)
Local Trade Copier EA MT5 による、驚くほど高速な取引コピーを体験してください。1分で簡単にセットアップできるこの取引コピー機は、同じWindowsコンピュータまたはWindows VPS上の複数のMetaTrader端末間で取引をコピーすることができ、0.5秒未満の高速コピースピードを実現します。 初心者であろうとプロのトレーダーであろうと、 Local Trade Copier EA MT5 には、あなたの特定のニーズに合わせてカスタマイズするための幅広いオプションが用意されています。これは、利益の可能性を高めたい人にとって究極のソリューションです。 今すぐ試してみて、これが市場で最も速くて簡単なトレードコピー機である理由を理解してください。 ヒント: デモアカウントで Local Trade Copier EA MT5 デモバージョンをダウンロードして試すことができます: ここ ダウンロードした無料のデモ ファイルを MT5 >> ファイル >> データ フォルダを開く >> MQL5 >> Experts フォルダに貼り付けて、ターミナルを再起動し
カスタム・アラートは、8つの主要通貨(USD、CAD、GBP、EUR、CHF、JPY、AUD、NZD)、GOLD(XAU)、これらの通貨をベースとした28のFXとGOLDの全ペア、そしてUS30、UK100、WTI、Bitcoinなどの最大7つの指数にわたって有望なセットアップを識別する多用途のマルチマーケット・モニタリング・ツールです。完全にカスタマイズ可能です。このツールは、FXパワー、FXボリューム、IXパワーのインジケーターからデータを収集し、重要なイベントを通知します。  このマルチマーケットスキャナーが提供するすべてのオプションの恩恵を受けるには、開始する前に、使用するインジケータをターミナルにインストール済みである必要があります。 機能と様々なアラートオプションの詳細については→カスタムアラ ートFAQをご覧ください。
あなたがメンバーである任意のチャネルから(プライベートおよび制限されたものを含む)シグナルを直接あなたのMT5にコピーします。  このツールは、トレードを管理し監視するために必要な多くの機能を提供しながら、ユーザーを考慮して設計されています。 この製品は使いやすく、視覚的に魅力的なグラフィカルインターフェースで提供されています。設定をカスタマイズして、数分で製品を使用を開始できます! ユーザーガイド + デモ  | MT4版 | Discord版 デモを試してみたい場合は、ユーザーガイドにアクセスしてください。 Telegram To MT5 受信機は、ストラテジーテスターで動作しません! Telegram To MT5の特徴 複数のチャネルから一度にシグナルをコピー プライベートおよび制限されたチャネルからシグナルをコピー BotトークンまたはChat IDは必要ありません   (必要に応じて使用することができます) リスク%または固定ロットを使用して取引 特定のシンボルを除外 すべてのシグナルをコピーするか、コピーするシグナルをカスタマイズするかを選択 すべてのシグナ
Exp COPYLOT CLIENT for MT5
Vladislav Andruschenko
4.04 (23)
MT5のトレードコピー機は、МetaТrader5プラットフォームのトレードコピー機です 。 それは間の 外国為替取引をコピーします   任意のは 、MT5 - MT5、MT4 - MT5   COPYLOT MT5版の アカウント (またはを MT4 - MT4   MT5 - MT4   COPYLOT MT4版用) 信頼できるコピー機! MT4のバージョン 完全な説明   +DEMO +PDF 購入する方法 インストールする方法     ログファイルの取得方法     テストと最適化の方法     Expforex のすべての製品 МТ4ターミナルでトレードをコピーすることもできます(   МТ4   -   МТ4、МТ5   -   МТ4   ):   MT4のCOPYLOT CLIENT このバージョンには、端末間 МТ5   -   МТ5、МТ4   -   МТ5が含まれ ます。 ディールコピー機は、2/3/10端末間でディール/ポジションをコピーするために作成されます。 デモ口座と投資口座からのコピーがサポートされています。 プログラムは、複数の端末
Tired of complex order placement and manual calculations? Trade Dashboard is your solution. With its user-friendly interface, placing orders becomes effortless, by a single click, you can open trades, set stop loss and take profit levels, manage trade lot size, and calculate risk to reward ratios, allowing you to only focus on your strategy. Say goodbye to manual calculations and streamline your trading experience with Trade Dashboard. Download  Demo Version  right now. You can find  Details of
The product will copy all telegram signal to MT5 ( which you are member) , also it can work as remote copier.  Easy to set up, copy order instant, can work with almost signal formats, image signal,  s upport to translate other language to English Work with all type of channel or group, even channel have "Restrict Saving Content", work with  multi channel, multi MT5 Work as remote copier: with signal have ticket number, it will copy exactly via ticket number. Support to backtest signal. How to s
Trade Manager は、リスクを自動的に計算しながら、取引を迅速に開始および終了するのに役立ちます。 過剰取引、復讐取引、感情的な取引を防止する機能が含まれています。 取引は自動的に管理され、アカウントのパフォーマンス指標はグラフで視覚化できます。 これらの機能により、このパネルはすべてのマニュアル トレーダーにとって理想的なものとなり、MetaTrader 5 プラットフォームの強化に役立ちます。多言語サポート。 MT4バージョン  |  ユーザーガイド + デモ Trade Manager はストラテジー テスターでは機能しません。 デモについてはユーザーガイドをご覧ください。 危機管理 % または $ に基づくリスクの自動調整 固定ロットサイズを使用するか、ボリュームとピップに基づいた自動ロットサイズ計算を使用するオプション RR、Pips、または価格を使用した損益分岐点ストップロス設定トレーリングストップロス設定 目標に達したときにすべての取引を自動的に終了するための 1 日あたりの最大損失 (%)。 過度のドローダウンからアカウントを保護し、オーバートレードを防ぎます
MT5 to Telegram Signal Provider は、Telegramのチャット、チャンネル、またはグループに 指定された シグナルを送信することができる、完全にカスタマイズ可能な簡単なユーティリティです。これにより、あなたのアカウントは シグナルプロバイダー になります。 競合する製品とは異なり、DLLのインポートは使用していません。 [ デモ ] [ マニュアル ] [ MT4版 ] [ Discord版 ] [ Telegramチャンネル ] セットアップ ステップバイステップの ユーザーガイド が利用可能です。 Telegram APIの知識は必要ありません。必要な全ては開発者から提供されます。 主な特長 購読者に送信する注文の詳細をカスタマイズする機能 例えば、Bronze、Silver、Goldといった階層型のサブスクリプションモデルを作成できます。Goldサブスクリプションでは、すべてのシグナルが提供されます。 id、シンボル、またはコメントによって注文をフィルターできます 注文が実行されたチャートのスクリーンショットが含まれます 追加の
Cerberus Equity Watcher
Samuel Bandi Roccatello
5 (2)
Cerberus the Equity Watcher はリスク管理ツールであり、アカウントの資産を常に監視し、不完全な EA や裁量的なトレーダーの場合は感情的な行動によって引き起こされる大きなドローダウンを回避します。これは、バグを含む可能性のある EA や、予想外の市況でうまく機能しない可能性のある EA に依存するシステマティック トレーダーにとって非常に役立ちます。 Cerberus では、最小エクイティ値と (オプションで) 最大値を設定できます。これらのいずれかに達すると、すべてのポジションがフラットになり、すべての未決注文がクローズされ、すべての EA が「強制終了」されます。すべての位置を平坦化すると、ユーザーの携帯電話に通知が送信され、画面に明確なメッセージが表示されます。 「平坦化」の後、Cerberus は株式価値を監視し続け、再初期化されるまでそれ以上の取引の試みを停止し続けます。 Cerberus によって実行されるすべての操作は、画面に明確に表示され、Expert advisor タブに報告され、通知がユーザーに送信されます。ユーザーのミスを避けるために、
Set price targets, and leave everything else to HINN Lazy Trader! This tool is designed for automatic position sizing from specified levels to designated targets. Using a VPS is recommended (*). The demo version   limited in functionality, be sure to watch this video before using -->  https://youtu.be/geLQ6dUzAr8 A community for users, product discussion, update news, and first line of support are organized in a free Discord: https://discord.gg/zFhEZc7QDQ Use Webmoney For payments in cryptocu
MT5 to Discord Signal Provider は、Discord へ直接トレーディングシグナルを送信するために設計された、使いやすく完全にカスタマイズ可能なユーティリティです。このツールは、あなたのトレーディングアカウントを効率的なシグナルプロバイダーに変えます。 スタイルに合わせてメッセージフォーマットをカスタマイズ!利便性を考え、事前にデザインされたテンプレートから選択し、メッセージのどの要素を含めるか除外するかを選択できます。 [ デモ ] [ マニュアル ] [ MT4 バージョン ] [ Telegram バージョン ] セットアップ 簡単なセットアップのために、私たちの詳細な ユーザーガイド に従ってください。 Discord API の事前知識は必要ありません。必要なツールはすべて提供されます。 主な特徴 購読者の更新のための注文詳細をカスタマイズ。 ブロンズ、シルバー、ゴールドなど、各レベルで異なるシグナルアクセスを提供する階層的サブスクリプションモデルを実装。 注文が実行されたチャートのスクリーンショットを添付。 これらのスクリーンショットに表
Adam FTMO MT5
Vyacheslav Izvarin
5 (2)
ADAM EA Special Version for FTMO Please use ShowInfo= false for backtesting ! Our 1st EA created using ChatGPT technology Trade only GOOD and checked PROP FIRMS  Default parameters for Challenge $100,000 Tested on EURUSD and GBPUSD only  Use 15MIN Time Frame Close all deals and Auto-trading  before Weekend at 12:00 GMT+3  Friday For Prop Firms MUST use special Protector  https://www.mql5.com/en/market/product/94362 -------------------------------------------------------------------------------
Grid Manual MT5
Alfiya Fazylova
4.88 (16)
「Grid Manual」は、注文のグリッドを操作するための取引パネルです。 ユーティリティはユニバーサルで、柔軟な設定と直感的なインターフェイスを備えています。 それは、損失を平均化する方向だけでなく、利益を増やす方向でも注文のグリッドで機能します。 トレーダーは注文のグリッドを作成して維持する必要はありません。 すべてが「Grid Manual」によって行われます。 注文を開くだけで十分であり、「Grid Manual」は注文のグリッドを自動的に作成し、非常に閉じるまでそれに付随します。 完全な説明とデモバージョン ここ。 ユーティリティの主な機能と機能 ユーティリティは、モバイル端末から開かれた注文を含め、あらゆる方法で開かれた注文を処理します。 「制限」と「停止」の2種類のグリッドで機能します。 グリッド間隔の計算には、固定と動的(ATRインジケーターに基づく)の2つの方法で機能します。 オープンオーダーグリッドの設定を変更できます。 チャート上の各注文グリッドの損益分岐点を表示します。 各注文グリッドの利益率を表示します。 ワンクリックでグリッドから収益性の高い注文を閉じるこ
-25% discount ($199 -> $149) Advanced trading tool: One click smart orders that execute under your conditions Developed by trader for trading community:  position size calculator (lot size), open position after price action, strategy builder, set and forget trading, mobile notifications... Risk Management -  Risk percentage position size calculator, gain percentage, target risk reward ratio, spread and commissions are included in calculations 7 Advanced order types  - Set and forget trading w
YuClusters
Yury Kulikov
4.93 (42)
Attention: You can view the program operation in the free version  YuClusters DEMO .  YuClusters is a professional market analysis system. The trader has unique opportunities to analyze the flow of orders, trade volumes, price movements using various charts, profiles, indicators, and graphical objects. YuClusters operates on data based on Time&Sales or ticks information, depending on what is available in the quotes of a financial instrument. YuClusters allows you to build graphs by combining da
Trade Assistant 38 in 1
Makarii Gubaydullin
4.89 (18)
多機能ツール 搭載機能: ロット計算機、プライスアクション、リスク/リワードレシオ、トレードマネージャー、需要供給ゾーンなどをはじめ65以上の機能。 バージョ:デモ版   |   ユーザーマニュアル   |    MT5版 このユーティリティはストラテジー テスターでは機能しません。 ここからデモ   バージョンをダウンロードして製品をテストできます。 ご不明な点や改善提案、バグの発見などございましたら、 連絡してください 。 取引プロセスを簡素化、高速化、自動化します。このダッシュボードで標準端末機能を拡張します 1. 新しい取引を開始します : ロット / リスク / RR の計算 1. Lot計算機(リスクサイズに基づく取引量計算 2. リスク計算機(ロットサイズに基づくリスク量) 3. リスク/リワードレシオ (R/R) 4. 注文のアクティベーション トリガー + Buy StopLimit / Sell StopLimit 5. 仮想 SL / TP レベル (隠しSL、TP: ブローカーには見えない) 6.  Smart SL / エントリー レベル: バ
これは視覚的な取引パネルであり、取引を簡単に配置および管理し、人為的エラーを回避し、取引活動を強化するのに役立ちます。使いやすい視覚的なインターフェースと、健全なリスクおよび位置管理アプローチを組み合わせています。 [ インストールガイド | 更新ガイド | トラブルシューティング | よくある質問 | すべての製品 ] 驚くほど使いやすい チャートから簡単に取引 正確なリスク管理との取引、手間のかからない 資本の保存が最優先事項です 気をつけずに利益を上げましょう できるだけ早くリスクのない取引をお楽しみください 開かれているすべての取引の自動トレーリングストップ 最初のストップロスは、取引が行われるとすぐに配置されます EAは、取引を行った後に次のタスクを実行します。 最初のストップロス/テイクプロフィットは自動的に配置されます できるだけ早くフリーライドにロックします(オプション) ストップロスを初めて損益分岐点に移動します(オプション) 停止するまで、希望の方法を使用してストップロスを追跡します その他のクールな機能は次のとおりです。 優れたターミナルアクティビティレポート
MT5のエキスパートアドバイザーリスクマネージャーは非常に重要であり、私の意見ではすべてのトレーダーにとって必要なプログラムです。 このエキスパートアドバイザーを使用すると、取引口座のリスクを管理することができます。リスクと利益の管理は、金銭的およびパーセンテージの両方で実行できます。 エキスパートアドバイザーが機能するには、それを通貨ペアチャートに添付し、許容可能なリスク値を預金通貨または現在の残高の%で設定するだけです。 PROMO BUY 1 GET 2 FREE -   https://www.mql5.com/en/blogs/post/754725 アドバイザ機能 このリスクマネージャーは、リスクの管理を支援します。 -取引のために -1日あたり - 1週間 - ひと月ほど 制御することもできます 1)取引時の最大許容ロット 2)1日あたりの最大注文数 3)1日あたりの最大利益 4)エクイティを引き受ける利益を設定する それだけではありません。設定で自動設定を指定した場合、アドバイザーはデフォルトのSLとTPを設定することもできます。
MT5からTelegramに完全にカスタマイズ可能なシグナルを送信して、シグナルプロバイダーになりましょう!この製品は、使いやすく視覚的に魅力的なグラフィカルインターフェースで提供されています。設定をカスタマイズして、数分で製品を使用開始できます! ユーザーガイド + デモ  | MT4バージョン  | Discordバージョン デモを試したい場合は、ユーザーガイドをご覧ください。 MT5からTelegramへの送信者は、ストラテジーテスターでは動作しません。 MT5からTelegramへの機能 多数のオプションを使用して、シグナルを完全にカスタマイズします シグナルの前後に独自のカスタムメッセージを追加します。これには、タグ、リンク、チャンネルなどが含まれます シグナル内の絵文字を追加、削除、カスタマイズします。また、すべて削除することもできます。 シンボルまたはマジックナンバーで送信する取引をフィルタリングします 特定のシンボルの送信を除外します 特定のマジックナンバーの送信を除外します シグナルと一緒に送信する取引の詳細をカスタマイズします シグナルと一緒にスクリーンショ
ワンクリックで取引できるトレーディングパネル。ポジションと注文の操作!チャートまたはキーボードから取引。 当社の取引パネルを使用すると、チャートから直接シングルクリックで取引を実行でき、標準の MetaTrader コントロールよりも 30 倍高速に取引操作を実行できます。 パラメータと関数の自動計算により、トレーダーにとって取引がより速く、より便利になります。 グラフィックのヒント、情報ラベル、取引取引に関する完全な情報はチャート MetaTrader にあります。 MT4のバージョン 完全な説明   +DEMO +PDF 購入する方法 インストールする方法     ログファイルの取得方法     テストと最適化の方法     Expforex のすべての製品 手動取引用の取引パネル。チャート(チャートウィンドウ)またはキーボードから取引できます。  開閉、リバース、ロックポジションと注文を処理する МetaТrader5 のメインオーダーのトレーディングコントロールパネル:売買、売却、売却、売却、売却、閉じる、削除、修正、トレーリングストップ、ストップロス、takep
この製品は、ニュースタイム中にすべてのエキスパートアドバイザーと手動チャートをフィルタリングするため、急激な価格変動によるマニュアルトレードのセットアップの破壊や他のエキスパートアドバイザーによって入力された取引について心配する必要はありません。この製品には、ニュースのリリース前にオープンポジションとペンディングオーダーを処理できる完全な注文管理システムも付属しています。 The News Filter  を購入すると、将来のエキスパートアドバイザーのためにビルトインのニュースフィルターに頼る必要はなく、今後はすべてのエキスパートアドバイザーをここからフィルタリングできます。 ニュース選択 ニュースソースは、Forex Factoryの経済カレンダーから取得されます。 USD、EUR、GBP、JPY、AUD、CAD、CHF、NZD、CNYなど、任意の通貨数に基づいて選択できます。 Non-Farm(NFP)、FOMC、CPIなどのキーワード識別に基づいて選択することもできます。 影響レベルによってフィルタリングするニュースを選択することができ、低、中、高の影響範囲から選択できます
DrawDown Limiter
Haidar, Lionel Haj Ali
5 (18)
Drawdown Limiter EA You are in the right place if you were searching for Drawdown control, Drawdown limiter, Balance protection, Equity Protection or Daily Drawdown Limit related to Prop Firm, FTMO, or Funded account trading, or if you want to protect your trading account. Have you suffered from controlling your drawdown when trading funded accounts? This EA is meant for you. Prop firms usually set a rule called “Trader Daily Drawdown”, and if it is not respected, you are disqualified.  I am an
Attention: this is a multicurrency EA, which trades by several pairs from one chart!  Therefore, in order to avoid duplicate trades, it is necessary to attach EA only to one chart, ---> all trading in all pairs is conducted only from one chart! we can trade simultaneously in three different pairs, as by default (EURUSD + GBPUSD + AUDUSD), which take into account the correlation when entering the market for all three; we can trade only EURUSD (or any currency pair) and at the same time take into
-25% discount ($149 -> $111) Everything for chart Technical Analysis indicator mt5 in one tool Draw your supply demand zone with rectangle and support resistance with trendline and get alerts to mobile phone or email alert -  Risk reward indicator mt5 Video tutorials, manuals, DEMO download   here .   Find contacts on my   profile . 1.   Extended rectangles and trendlines Object will be extended to the right edge of the chart when price will draw new candles on chart. This is rectangle extend
News Trade EA MT5
Konstantin Kulikov
4.5 (10)
僕自身が数年間使っている便利なロボットをご紹介します。半自動モードでも完全自動モードでもお使いいただけます。 当プログラムは経済指標カレンダーで発表されるニュースをもとにした取引の柔軟な設定が可能です。戦略テスターでは確認不可です。実際の取引のみです。端末の設定メニューを開いて許可URLリストにニュースサイトを追加する必要があります。サービス > 設定 > エキスパート・アドバイザーをクリックしてください。”次のURLの WebRequestを許可する:"にチェックを入れてください。次のURLを追加してください(空白は削除します): https://  nfs.faireconomy.media 設定のモニタリングはデフォルトで完全自動モードで行われます: https://www.mql5.com/ja/signals/1447007 。似たような結果を得たい場合は任意のタイムフレームの GBPUSDチャートにエキスパート・アドバイザーを関連付けてください。(タイムフレームの種類は問いません。) 当該エキスパート・アドバイザーのためのカスタマイズ設定セットを作る場合は、ブ
ニュースイベントの洞察でトレードを強化 トレードの世界では、ニュースイベントが市場価格に大きな影響を与えることがあります。これらのイベントが価格変動にどのように影響するかを理解することは、ボラティリティの高い時期にトレードを管理するために重要です。News Tool EA は、過去および今後のニュースイベントに関する洞察を提供し、情報に基づいたトレードの意思決定を支援します。 このEAは、ストラテジーテスターでは実行できません。 ユーザーガイド 主な機能: 歴史的影響分析 過去の特定のニュースイベントに対して価格変動がどのように反応したかを理解します。イベントがしばしば強気または弱気のトレンドに従うかを分析し、調整可能な時間枠でポイントまたはパーセンテージの平均価格影響を表示します。ビジュアルグラフを使用して、ニュースイベントと価格反応を並べて観察し、より深い市場の洞察を得ることができます。 リアルタイムニュースの統合 MT5内で直接、今後のニュースイベントのライブアップデートを受け取ります。特定のイベントや重要度レベルに対するアラートを設定し、通貨や関連性でイベントをフィルタ
RSI Divergence Scanner is a multi-timeframe and multi-symbol dashboard and alert that checks all timeframes and symbols to find regular and hidden divergences between price chart and RSI indicator. This divergence scanner is integrated with support and resistance zones so you can check the RSI divergences in the most important areas of the chart to find trend reversals in price chart. Download demo version   (works on M4,M5,M6,M12,H3,H8 timeframes) Full description of scanner parameters ->   cli
作者のその他のプロダクト
WalkForwardOptimizer MT5
Stanislav Korotky
3.86 (7)
WalkForwardOptimizer library allows you to perform rolling and cluster walk-forward optimization of expert advisers (EA) in MetaTrader 5. To use the library include its header file WalkForwardOptimizer.mqh into your EA source code, add call provided functions as appropriate. Once the library is embedded into EA, you may start optimization according to the procedure described in the User guide . When it's finished, intermediate results are saved into a CSV file and some special global variables.
Order Book, known also as Market Book, market depth, Level 2, - is a dynamically updated table with current volumes of orders to buy and to sell specific financial instument at price levels near Bid and Ask. MetaTrader 5 provides the means for receiving market book from your broker, but in real time only, without access to its history. The library OrderBook History Library reads market book state in the past from archive files, created by OrderBook Recorder . The library can be embedded into you
AutomaticZigZag
Stanislav Korotky
4.5 (2)
This is a non-parametric ZigZag providing 4 different methods of calculation. Upward edge continues on new bars while their `highs` are above highest `low` among previous bars, downward edge continues on next bars while their `lows` are below lowest `high` among previous; Gann swing: upward edge continues while `highs` and `lows` are higher than on the left adjacent bar, downward edge continues while `highs` and `lows` are lower than on the left adjacent bar. Inside bars (with lower `high` and
FREE
This indicator displays volume delta (of either tick volume or real volume) encoded in a custom symbol, generated by special expert advisers, such as RenkoFromRealTicks . MetaTrader does not allow negative values in the volumes, this is why we need to encode deltas in a special way, and then use CustomVolumeDelta indicator to decode and display the deltas. This indicator is applicable only for custom instruments generated in appropriate way (with signed volumes encoded). It makes no sense to ap
FREE
Order Book, known also as Market Book, market depth, Level 2, - is a dynamically updated table with current volumes of orders to buy and to sell specific financial instument at price levels near Bid and Ask. MetaTrader 5 provides the means for receiving market book from your broker, but in real time only, without access to its history. This expert adviser OrderBook History Playback allows you to playback the market book events on the history using files, created by OrderBook Recorder . The exper
FREE
This indicator provides a true volume surrogate based on tick volumes. It uses a specific formula for calculation of a near to real estimation of trade volumes distribution , which may be very handy for instruments where only tick volumes are available. Please note that absolute values of the indicator do not correspond to any real volumes data, but the distribution itself, including overall shape and behavior, is similar to real volumes' shape and behavior of related instruments (for example, c
Order Book, known also as Market Book, market depth, Level 2, - is a dynamically updated table with current volumes of orders to buy and to sell specific financial instument at price levels near Bid and Ask. MetaTrader 5 provides the means for receiving market book from your broker in real time. The expert OrderBook Recorder records market book changes and stores them in local files for further usage in indicators and expert adviser, including testing in the tester. The expert stores market book
FREE
HZZM
Stanislav Korotky
4 (1)
This is an adaptive ZigZag based on modification of  HZZ indicator (original source code is available in this article ). Most important changes in this version: two additional indicator buffers added for zigzag evolution monitoring - they show cross signs at points where zigzag direction first changes; zigzag range (H) autodetection on day by day basis; time-dependent adjustment of zigzag range. Parameters: H - zigzag range in points; this parameter is similar to original HZZ, but it can take 0
FREE
This script allows performing a walk-forward analysis of trading experts based on the data collected by the WalkForwardLight MT5 library. The script builds a cluster walk forward report and rolling walk forward reports that refine it, in the form of a single HTML page. This script is optional, as the library automatically generates the report immediate after the optimization in the tester is complete. However, the script is convenient because it allows using the same collected data to rebuild th
FREE
This is a demo version of a non-trading expert , which utilizes so called the custom symbols feature ( available in MQL as well ) to build renko charts based on historical quotes of selected standard symbol and to refresh renko in real-time according to new ticks. Also it translates real ticks to the renko charts, which allows other EAs and indicators to trade and analyze renko. Place the EA on a chart of a working instrument. The lesser timeframe of the source chart is, the more precise resulti
FREE
OrderBook Utilities is a script, which performs several service operations on order book hob-files, created by OrderBook Recorder . The script processes a file for work symbol of the current chart. The file date is selected by means of the input parameter CustomDate (if it's filled in) or by the point where the script is dropped on the chart. Depending from the operation, useful information is written into the log, and optionally new file is created. The operation is selected by the input parame
FREE
The indicator calculates running total of linear weighted returns. It transforms rates into integrated and difference-stationary time series with distinctive buy and sell zones. Buy zones are shown in blue, sell zones in red. Parameters: period - number of bars to use for linear weighted calculation; default value - 96; smoothing - period for EMA; default value - 5; mode - an integer value for choosing calculation mode: 0 - long term trading; 1 - medium term trading; 2 - short term trading; defa
FREE
Comparator
Stanislav Korotky
4.75 (4)
This indicator compares the price changes during the specified period for the current symbol and other reference symbol. It allows to analyze the similar movements of highly correlated symbols, such as XAUUSD and XAGUSD, and find their occasional convergences and divergences for trading opportunities. The indicator displays the following buffers: light-green thick line - price changes of the current symbol for TimeGap bars; light-blue thin line - price changes of the reference symbol ( LeadSymbo
FREE
WalkForwardDemo is an expert adviser (EA) demonstrating how the built-in library WalkForwardOptimizer (WFO) for walk-forward optimization works. It allows you to easily optimize, view and analyze your EA performance and robustness in unknown trading conditions of future. You may find more details about walk-forward optimization in Wikipedia . Once you have performed optimization using WFO, the library generates special global variables (saved in an "archived" file with GVF-extension) and a CSV-f
FREE
Time And Sales Layout indicator shows traded buy and sell volumes right on the chart. It provides a graphical representation of most important events in the time and sales table. The indicator downloads and processes a history of real trade ticks. Depending from selected depth of history, the process may take quite some time. During history processing the indicator displays a comment with progress percentage. When the history is processed, the indicator starts analyzing ticks in real time. The l
Order Book, known also as Market Book, market depth, Level 2, - is a dynamically updated table with current volumes of orders to buy and to sell specific financial instument at price levels near Bid and Ask. MetaTrader 5 provides the means for receiving market book from your broker, but in real time only, without access to its history. The indicator OrderBook Cumulative Indicator accumulates market book data online and visualizes them on the chart. In addition, the indicator can show the market
This indicator provides a statistical analysis of price changes (in points) versus time delta (in bars). It calculates a matrix of full statistics about price changes during different time periods, and displays either distribution of returns in points for requested bar delta, or distribution of time deltas in bars for requested return. Please, note, that the indicator values are always a number of times corresponding price change vs bar delta occurred in history. Parameters: HistoryDepth - numbe
FREE
SOMFX1Builder
Stanislav Korotky
5 (1)
If you like trading by candle patterns and want to reinforce this approach by modern technologies, this script is for you. In fact, it is a part of a toolbox, that includes a neural network engine implementing Self-Organizing Map (SOM) for candle patterns recognition, prediction, and provides you with an option to explore input and resulting data. The toolbox contains: SOMFX1Builder  - this script for training neural networks; it builds a file with generalized data about most characteristic pric
FREE
This indicator shows price changes for the same days in past years. D1 timeframe is required. This is a predictor indicator that finds D1 bars for the same days in past 8 years and shows their relative price changes on the current chart. Parameters: LookForward - number of days (bars) to show "future" price changes; default is 5; Offset - number of days (bars) to shift back in history; default is 0; ShowAverage - mode switch; true - show mean value for all 8 years and deviation bounds; false - s
FREE
This indicator predicts rate changes based on the chart display principle. It uses the idea that the price fluctuations consist of "action" and "reaction" phases, and the "reaction" is comparable and similar to the "action", so mirroring can be used to predict it. The indicator has three parameters: predict - the number of bars for prediction (24 by default); depth - the number of past bars that will be used as mirror points; for all depth mirroring points an MA is calculated and drawn on the ch
If you like trading crosses (such as AUDJPY, CADJPY, EURCHF, and similar), you should take into account what happens with major currencies (especially, USD and EUR) against the work pair: for example, while trading AUDJPY, important levels from AUDUSD and USDJPY may have an implicit effect. This indicator allows you to view hidden levels, calculated from the major rates. It finds nearest extremums in major quotes for specified history depth, which most likely form resistence or support levels, a
The indicator displays most prominent price levels and their changes in history. It dynamically detects regions where price movements form attractors and shows up to 8 of them. The attractors can serve as resistance or support levels and outer bounds for rates. Parameters: WindowSize - number of bars in the sliding window which is used for detection of attractors; default is 100; MaxBar - number of bars to process (for performance optimization); default is 1000; when the indicator is called from
This is an intraday indicator that uses conventional formulae for daily and weekly levels of pivot, resistance and support, but updates them dynamically bar by bar. It answers the question how pivot levels would behave if every bar were considered as the last bar of a day. At every point in time, it takes N latest bars into consideration, where N is either the number of bars in a day (round the clock, i.e. in 24h) or the number of bars in a week - for daily and weekly levels correspondingly. So,
Most of traders use resistance and support levels for trading, and many people draw these levels as lines that go through extremums on a chart. When someone does this manually, he normally does this his own way, and every trader finds different lines as important. How can one be sure that his vision is correct? This indicator helps to solve this problem. It builds a complete set of virtual lines of resistance and support around current price and calculates density function for spatial distributi
The indicator draws a histogram of important levels for several major currencies attached to the current cross rates. It is intended for using on charts of crosses. It displays a histogram calculated from levels of nearest extremums of related major currencies. For example, hidden levels for AUDJPY can be detected by analyzing extremums of AUD and JPY rates against USD, EUR, GBP, and CHF. All instruments built from these currencies must be available on the client. This is an extended version of
The indicator provides a statistic histogram of estimated price movements for intraday bars. It builds a histogram of average price movements for every intraday bar in history, separately for each day of week. Bars with movements above standard deviation or with higher percentage of buys than sells, or vice versa, can be used as direct trading signals. The indicator looks up current symbol history and sums up returns on every single intraday bar on a specific day of week. For example, if current
This is an easy to use signal indicator which shows and alerts probability measures for buys and sells in near future. It is based on statistical data gathered on existing history and takes into account all observed price changes versus corresponding bar intervals in the past. The statistical calculations use the same matrix as another related indicator - PointsVsBars. Once the indicator is placed on a chart, it shows 2 labels with current estimation of signal probability and alerts when signal
CCFpExtra is an extended version of the classic cluster indicator - CCFp. This is the MT4 version of indicator  CCFpExt available for MT5. Despite the fact that MT5 version was published first, it is MT4 version which was initially developed and tested, long before MT4 market was launched. Main Features Arbitrary groups of tickers or currencies are supported: can be Forex, CFDs, futures, spot, indices; Time alignment of bars for different symbols with proper handling of possibly missing bars, in
This is a signal indicator for automatic trading which shows probability measures for buys and sells for each bar. It is based on statistical data gathered on existing history and takes into account all observed price changes versus corresponding bar intervals in the past. The core of the indicator is the same as in PriceProbablility indicator intended for manual trading. Unlike PriceProbability this indicator should be called from MQL4 Expert Advisors or used for history visual analysis. The in
The main idea of this indicator is rates analysis and prediction by Fourier transform. Indicator decomposes exchange rates into main harmonics and calculates their product in future. You may use the indicator as a standalone product, but for better prediction accuracy there is another related indicator - FreqoMaster - which uses FreqoMeterForecast as a backend engine and combines several instances of FreqoMeterForecast for different frequency bands. Parameters: iPeriod - number of bars in the ma
フィルタ:
レビューなし
レビューに返信
バージョン 1.3 2021.02.18
Fixed a bug with incomplete delta calculations under certain conditions: depending from tick flags, some of the ticks could be skipped.
Added new feature: if a chart with the custom symbol does already exist, EA will automatically switch to it after settings change.
バージョン 1.2 2021.02.17
New parameter UsePriceChangeInDelta is added. It enables a special mode of volume delta calculation, when the price distance between consecutive ticks is taken into account for the volume estimation. It should be applied only for non-exchange instruments, where upward and downward price changes are translated by your broker with a bias (a skew to one side). For example, some cryptocurrencies or indices may have this issue. This is a specificity of the tick flow from some brokers or liquidity providers.

Parameter Reset is replaced with ResetID.
バージョン 1.1 2021.01.28
New option of volume delta calculation based on changes of the original symbol chart building price (bid or last) is added.
Minor bugfixes.