MultiPlatformC
- インディケータ
- Mikhail Savenkov
- バージョン: 1.8
- アップデート済み: 18 1月 2021
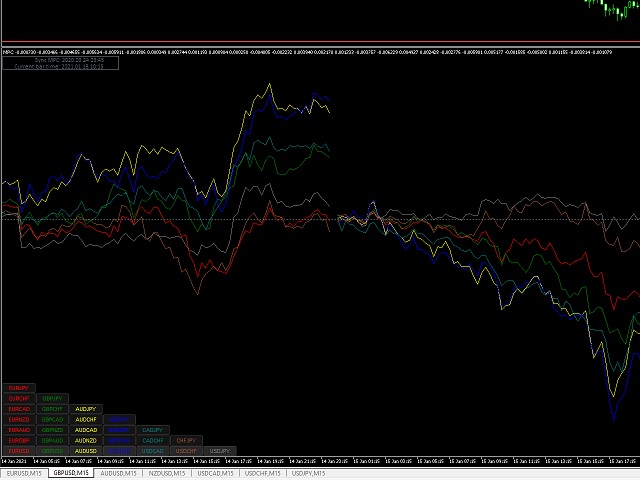
Мультивалютный индикатор в отдельном окне отображает движение валютных пар в пунктах с расхождением от начала дня.
Во время работы, динамически возможно включать и отключать различные пары прямо на графике.
При первом запуске, возможно, потребуется продолжительное время, пока загрузиться история для основных валютных пар.
Расчет всех кроссов происходит на основе мажоров.
Для валют CAD, CHF, JPY - график перевернут.
При повторном открытии, все настройки индикатора восстанавливаются автоматически.
Good indicator, thank you. But the lines disappears and it says indicator removed in the terminal log