Trend Alligator
- インディケータ
- Natasha Diedericks
- バージョン: 1.9
- アップデート済み: 28 9月 2022
- アクティベーション: 20
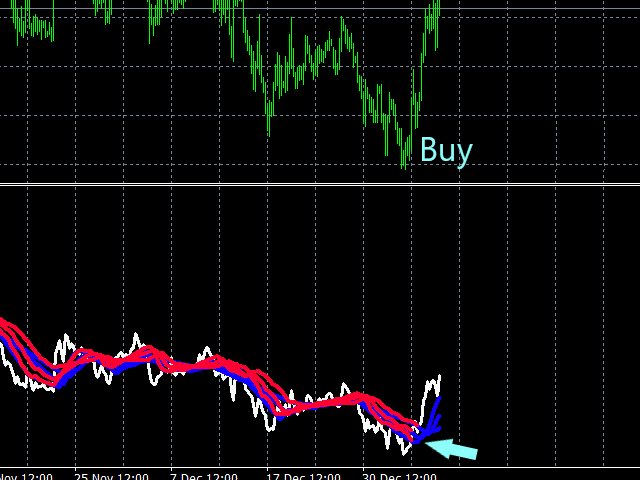
This indicator takes input from the Alligator indicator.
Great for scalping.
Great for identifying new trends.
This indicator can be used on all time frames and pairs.
Features alert functions.
Parameters:
Alerts
JawsPeriod
JawsShift
TeethPeriod
TeethShift
LipsPeriod
LipsShift
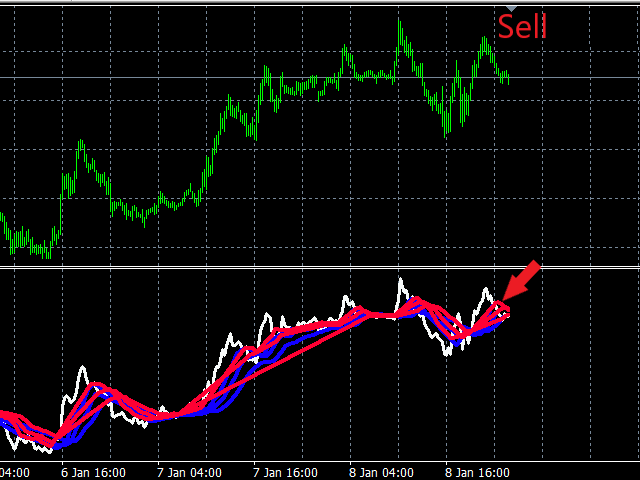
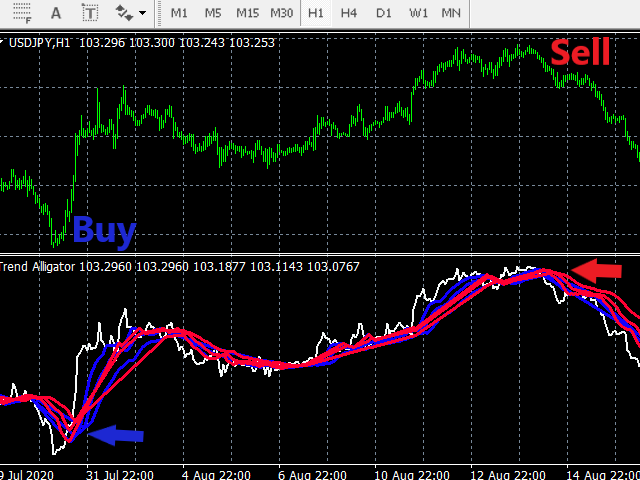
How to use:
Simply attach to any chart with default settings.
Sell when all 3 red lines cross above white line.
Buy when all 3 blue lines cross below white line.
Best results when checking the higher time frames (3 or more preferable).
Or use as you see fit for your strategy.
Can be used on all times frames.
Best results on Major Pairs, but can also be used on other pairs.
Important to note:
-
Please do not use this indicator haphazardly. Make sure it compliments your strategy.
-
Don't risk money you cannot afford to lose.
-
You use this indicator at your own risk. Please apply money management wisely.
-
Always test your strategy on a demo account before using a new indicator on a live account.

Very accurate and profitable indicator thank you