• 概要
  • レビュー
  • コメント
  • 最新情報

Indexes MT5

The stocks that make up the index are one of the drivers of the movement. Analyzing the financial performance of all elements of the index, we can assume further development of the situation.
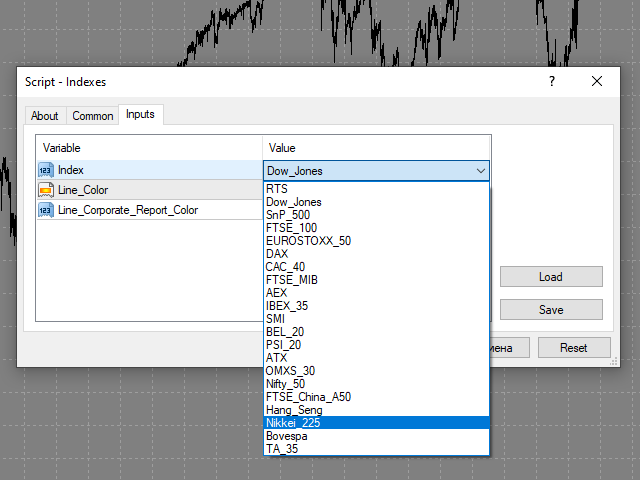
The program (script) displays corporate reports of shares that are part of the index selected in the settings. 

    "Indexes" cannot be tested in the tester (since there is no way to get information from the Internet).


    Information is downloaded from the site investing.com:

    • Report Date
    • Earnings per share (EPS)
    • Income (Revenue)
    • market capitalization


    The principle of operation:

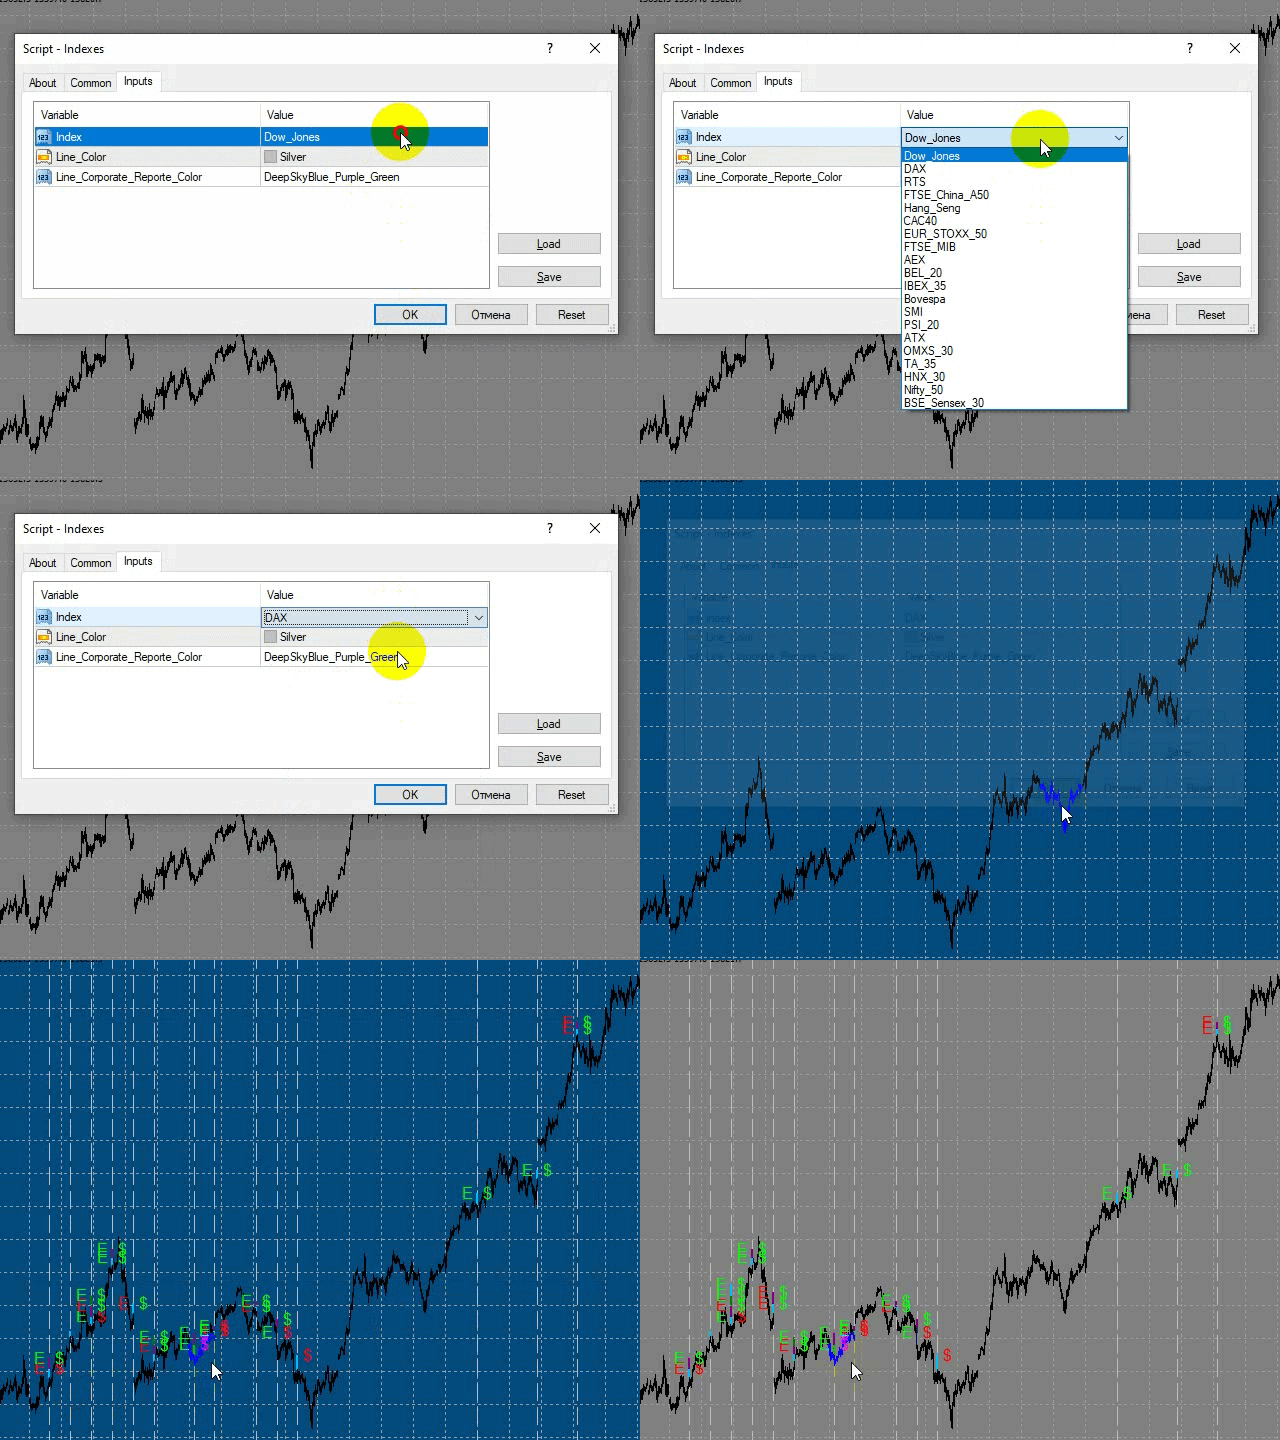
    • Searches for information about corporate reports of shares that are part of the index selected in the settings.
    • While searching for information, the background of the graph changes color to blue.
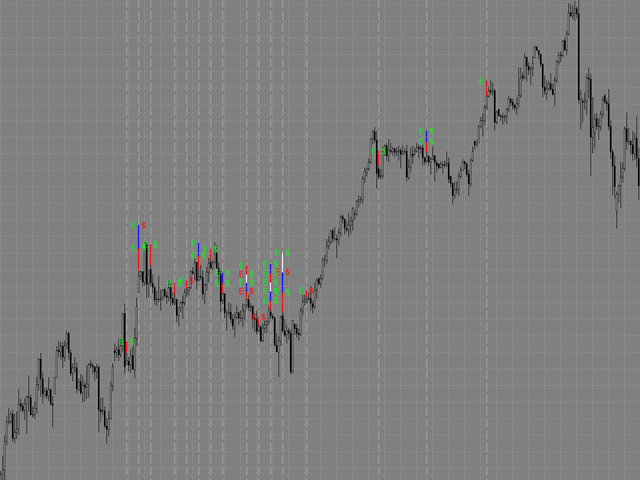
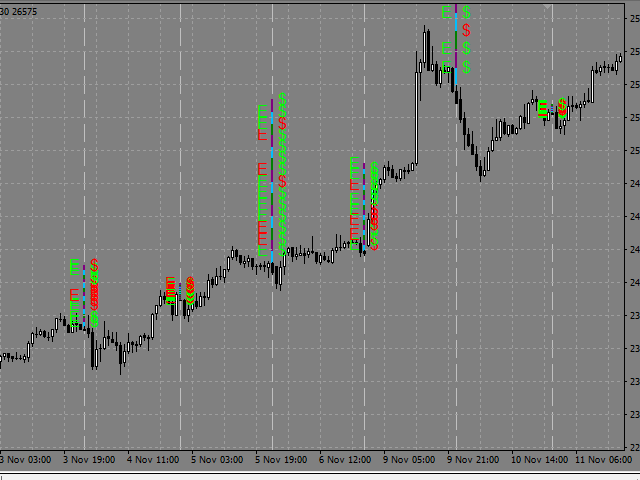
    • Plotting vertical lines corresponding to dates of the published corporate reports. The tooltip of each of the lines contains data on the appropriate corporate report.
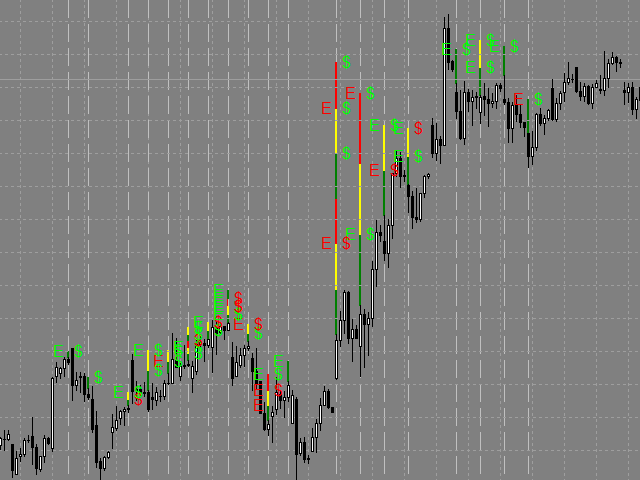
        • The E and $ marks are assigned to vertical lines:
        • if EPS value exceeds the forecast, the green E mark is used,
        • if expectations are not met, the red one is used;
        • if Revenue exceeds the forecast, the green $ mark is used,
        • if expectations are not met, the red one is used.
    • There can be several corporate reports in one day (displayed in different colors and higher than the previous one).
      • The program works in Russian and English.
      • In the settings, you can change the color of the lines.


      Before launching :

        The program and all the information used in it depend on the site investing.com and they work as long as it is possible to get information programmatically from the specified links.
        For more convenience, assign a hotkey to the script: right-click "Indexes" in the Navigator window -> Set hotkey -> select a suitable combination.


        おすすめのプロダクト
        If you wish to draw Support and Resistance lines, view: daily market opening, classical pivot levels, Fibonacci pivot levels, trend lines, Fibonacci levels, the remaining time to candle closing, and current spread. If you seek to place your orders with the exact lot that meets your desired stop loss risk. If you wish to do all this and more with just one click, then this is the perfect tool to use. This tool will allow you to feel more relaxed when deciding to open orders, as well as predicting
        Introduction to X3 Chart Pattern Scanner X3 Cherart Pattern Scanner is the non-repainting and non-lagging indicator detecting X3 chart patterns including Harmonic pattern, Elliott Wave pattern, X3 patterns, and Japanese Candlestick patterns. Historical patterns match with signal patterns. Hence, you can readily develop the solid trading strategy in your chart. More importantly, this superb pattern scanner can detect the optimal pattern of its kind. In addition, you can switch on and off individu
        QuantXMarketScanner is a multi assets indicator for MT5 - Mathematical model based on 7 custom moving averages indicators  - Adaptable on Currencies, Stocks and Crypto - Automatic setup, self optimized About QuantXsystem Products: –         Simple installation & integration into MT5   –         Unlimited License after purchase (for one user) –         Automatic pattern recognition to identify the best timing and price levels. –         Trading indicators are displayed directly and automatica
        革新的な MT5 インジケーター、DARWIN Assistant   をご紹介します。これは、トレーディングを成功させる世界への究極のゲートウェイです。精度と専門知識に基づいて設計された DARWIN Assistant   は、RSI、ストキャスティクス、CCI、トレンドなどの高度なテクニカル指標をすべての時間枠にわたって活用する特別な戦略に基づいて動作します。この最先端のインジケーターはエントリーのための最も正確なシグナルを提供し、比類のない自信を持って市場をナビゲートできるようにするため、並外れた取引体験に備えてください。 DARWIN Assistant   を使用すると、最も収益性の高い取引機会を検出するために細心の注意を払って調整された、重要な指標の包括的な分析にアクセスできるようになります。不確実性に別れを告げ、情報に基づいた意思決定の新時代を迎えましょう。 RSI、ストキャスティクス、CCI、トレンドを DARWIN Assistant   内でシームレスに統合することでその力を解き放ち、これまでにないほど市場のダイナミクスを鮮明に描きます。 DARWIN
        Naked Forex Big Shadow Indicator Big Shadow Indicator is a pattern recognition indicator for Forex, Stocks, Indices, Futures, Commodities and Cryptos. When you have a Big Shadow on your chart then this is a strong signal meaning that you might be ahead of a reversal. You can take other elements (momentum, trend, volatility, price action, fundamentals) to build a complete strategy and confirm your entries. Beware that you might not make money just following the arrows generated by the pattern r
        This Expert Advisor is applicable to plot wave charts as per the NeoWave  method (Neely Extension of Wave Theory).  NeoWave is a scientific, objective and revolutionary style of Elliott Wave Theory that was invented by Glenn Neely in 1990 in the “Mastering Elliott Wave” book. To start analyzing with this method, we need a particular chart called the Wave Chart or Cash Data chart . This is the first step for a good wave analysis. To draw this chart, Highs and Lows should be plotted in the order t
        Fx Levels Premium Indicator Support and Resistance are important concepts in trading. Fx Levels Premium was created to easily draw important levels of support and resistance for the active trader. The indicator will give you all important levels (support/resistance) to watch for a wide range of assets. Trading without these levels on your chart is like driving a car for a long journey without a roadmap. You would be confused and blind. Support and resistance levels should be used as guidel
        For those who trade false breakouts (FBo) levels. The False Breakout Finder (FBoFinder) service was written primarily for trading stocks and their CFDs on daily charts. It will search for you for various false breakouts of extremes on hundreds and thousands of instruments from the Watchlist, which will save you in the long run many hours of daily routine selection of securities before the market opens. In the process of enumerating instruments, securities with a ban on trading are ignored. If a
        Magic EA MT5
        Kyra Nickaline Watson-gordon
        Magic EA is an Expert Advisor based on Scalping, Elliot Waves and with filters such as RSI, Stochastic and 3 other strategies managed and decided with the robot smartly. Large number of inputs and settings are tested and optimized and embedded in the program thus inputs are limited and very simple. Using EA doesn't need any professional information or Forex Trading Knowledge. EA can trade on all symbols and all time frames, using special and unique strategies developed by the author. The EA
        Gold instrument scanner is the chart pattern scanner to detect the triangle pattern, falling wedge pattern, rising wedge pattern, channel pattern and so on. Gold instrument scanner uses highly sophisticated pattern detection algorithm. However, we have designed it in the easy to use and intuitive manner. Advanced Price Pattern Scanner will show all the patterns in your chart in the most efficient format for your trading. You do not have to do tedious manual pattern detection any more. Plus you
        ATrend
        Zaha Feiz
        4.86 (7)
        ATrend: その仕組みと使い方 仕組み MT5プラットフォーム向けの「ATREND」インジケーターは、テクニカル分析手法の組み合わせを利用して、トレーダーに堅牢な買いと売りのシグナルを提供するように設計されています。このインジケーターは主に、ボラティリティ測定のために平均真の範囲(ATR)を活用し、潜在的な市場動向を特定するためのトレンド検出アルゴリズムを併用しています。 購入後にメッセージを残すと、特別なボーナスギフトが贈呈されます。 主な特徴: - ダイナミックなトレンド検出: インジケーターは市場トレンドを評価し、シグナルを適宜調整することで、トレーダーが優位な市場環境に合わせて戦略を立てるのを支援します。     - ボラティリティ測定: ATRを使用することで、インジケーターは最適なストップロス(SL)とテイクプロフィット(TP)レベルを決定するために不可欠な市場ボラティリティを測定します。 - シグナルの視覚化: インジケーターは、チャート上に買いと売りのシグナルを視覚的に表示することで、トレーダーの意思決定を強化します。 操作手順 入力とセッティング - TimeF
        The best trend line auto trading expert advisor/utility. One or more trend lines of different timeframes in the same direction are easily placed on a chart to auto trade within a strong trading opportunity.   1.    AUTO TRADING / MANUAL TRADING Trendscout can place orders for you automatically. You have to enable “Auto trading” and also check the “Enable live trading” box at the parameter window. When price crosses the trend lines for the first time two massages are sent to your mobile phone or
        "Hunttern harmonic pattern finder" base on the dynamic zigzag with the notification and prediction mode This version of the indicator identifies 11 harmonic patterns and predicts them in real-time before they are completely formed. It offers the ability to calculate the error rate of Zigzag patterns depending on a risk threshold. It moreover sends out a notification once the pattern is complete. The supported patterns: ABCD BAT ALT BAT BUTTERFLY GARTLEY CRAB DEEP CRAB CYPHER SHARK THREE
        トレンドラインは、外国為替取引におけるテクニカル分析の最も重要なツールです。残念ながら、ほとんどのトレーダーはそれらを正しく描画していません。自動トレンドラインインジケーターは、市場のトレンドの動きを視覚化するのに役立つ本格的なトレーダー向けのプロフェッショナルツールです。 トレンドラインには、強気トレンドラインと弱気トレンドラインの2種類があります。 上昇トレンドでは、外国為替トレンドラインは価格変動の最低スイングポイントを介して描画されます。 少なくとも2つの「最低安値」を接続すると、トレンドラインが作成されます。 下降トレンドでは、トレンドラインは価格変動の最も高いスイングポイントを介して描画されます。 少なくとも2つの「最高値」を接続すると、トレンドラインが作成されます。 トレンドラインが壊れたとき? 弱気のろうそくが強気のトレンドラインの下で閉じ、ろうそくの高さがトレンドラインの上にあるとき、強気のトレンドラインは壊れます。 強気のろうそくが弱気のトレンドラインの上で閉じ、ろうそくの安値がトレンドラインの下にあるとき、弱気のトレ
        The Cipher Hybrid-HFT Gold Trader: The Power of Probability Theory and Price Action Principles The vast majority of technical indicators are the same age as dinosaurs. Also, many retail traders are not aware of this fact: most technical indicators are developed for the stock market - not for the forex and not for the metals market. The apparent fact that you can not achieve consistent success in the metal market with old technical indicator theories and with the tools developed for stock marke
        Quantum Trend Sniper
        Bogdan Ion Puscasu
        4.71 (49)
        ご紹介   クォンタム トレンド スナイパー インジケーターは 、トレンド反転を特定して取引する方法を変革する画期的な MQL5 インジケーターです。 13年以上の取引経験を持つ経験豊富なトレーダーのチームによって開発されました。     クォンタムトレンドスナイパーインジケーター   は、非常に高い精度でトレンドの反転を識別する革新的な方法で、あなたのトレーディングの旅を新たな高みに押し上げるように設計されています。 ***Quantum Trend Sniper Indicatorを購入すると、Quantum Breakout Indicatorを無料で入手できます!*** クォンタム ブレイクアウト インジケーターは、トレンドの反転を特定するとアラートを発し、矢印を示し、3 つのテイクプロフィットレベルを提案します。 初心者トレーダーにもプロのトレーダーにも適しています。 量子EAチャネル:       ここをクリック MT4のバージョン:       ここをクリック 推奨事項: 期間:すべての時間枠。最良の結果を得るには、M
        稼ぎと研究のためのツール。 トレーディングシグナルと戦略の中核は、価格予測パターンを形成するための著者のアルゴリズムに基づいています。どんな楽器にも使えます! MA「九尾の狐」に基づく制御システムが追加され、市場、機器、および作業期間に合わせて信号を可能な限り正確に更新および調整します。 対象:すべての市場のすべての商品(例外があります)。 対象者:ヘッジファンド、ファンドおよび資産運用会社、投資運用会社、投機家、投資家および利害関係者。 .................................................................................................................................................................................
        Drawdown Manager by Ofx
        Osama Essameldin Ibrahim Abdelaal
        In the ebb and flow of financial markets, the Drawdown Manager (by Ofx) stands out as an essential companion for traders utilizing grid and martingale strategies. This innovative tool is engineered to provide an analytical approach to managing trading drawdowns. By selectively utilizing floating and realized profits, the DDM tactically help traders control their drawdown exposure during market downturns. Its customizable settings empower traders with the flexibility to adjust operations accordi
        スペシャルキャンドル 成功した一目均衡表戦略を持つ最高の外国為替指標の1つを使いたいですか?この一目均衡表戦略に基づく素晴らしいインジケーターを利用できます。 MT4バージョンはこちらです。 第1戦略: この戦略では、まれに発生する類似した強いクロスを特定することが含まれます。 この戦略に最適な時間枠は、30分(30M)および1時間(H1)です。 30分間隔の適切なシンボルには以下が含まれます: • CAD/JPY • CHF/JPY • USD/JPY • NZD/JPY • AUD/JPY • EUR/USD • EUR/GBP 1時間のタイムフレームに適したシンボルには以下が含まれます: • GBP/USD • GBP/NZD • GBP/AUD • USD/CAD • USD/CHF • USD/JPY • EUR/AUD 第2戦略: この戦略では、トレンドと同じ方向に発生した強力なTenkunsenおよびKijunsenのクロスを特定することが含まれます。 この戦略に最適な時間枠は、1分(1M)から15分(15M)です
        Looking for reliable levels on a price chart? Already tired of searching for similar indicators? Are the levels not working out as they should? Then this is the indicator for you. Volume Prices Universal is a reliable indicator of horizontal volumes. What does it show? First of all, the main idea of ​​the indicator is to display at which price mark the price has been for the longest time. Thus, the display of price volumes on the price chart is formed. With the help of which you can very simp
        The Smooth Price technical indicator is used for plotting a smoothed line as close to the price of the financial instrument as possible, and serves to eliminate its noise components. The indicator is part of the Monarch trading system, but here it is presented as an independent technical analysis tool. The indicator is based on the cluster digital filter , which, unlike the ClusterSMA , is applied directly to the price time series. Smooth Price does not redraw (except the very last, zero bar) an
        A scalping indicator based on mathematical patterns, which on average gives signals with relatively small SL, and also occasionally helps to catch big moves in the markets (more information in the video) This indicator has three main types of notifications: The first type warns of a possible/upcoming signal on the next bar The second type indicates the presence of a ready signal to enter the market/open a position The third type is for SL and TP levels - you will be notified every time price r
        Airplane   Trend   entry points should be used as potential market reversal points. The indicator works using the cyclic-wave dependence function. Thus, all entry points will be optimal points where the movement changes. The simplest way to use the indicator is to open a trade in the direction of an existing trend. The best result is obtained by combining the indicator with fundamental news, it can act as a news filter, that is, it can show how the market reacts to this or that news. The de
        Fundamental Scanner is a Non-Repaint, Multi Symbol and Multi Time Frame Dashboard based on Fundamental Signals Indicator . Fundamental Signals Indicator has a powerful calculation engine that can predict market movement over 3000 pips (30000 points). The indicator is named fundamental because it can predict trends with large movements, no complicated inputs and low risk. Features : Multi-Symbol Support (Support automatic listing of market watch symbols) Multi-TimeFrame Support (Over 7
        まず第一に、この取引インジケーターは再描画されず、再描画されず、遅延しないことを強調する価値があります。これにより、手動取引とロボット取引の両方に理想的なものになります。 ユーザーマニュアル:設定、入力、戦略。 アトミックアナリストは、価格の強さとモメンタムを利用して市場でより良いエッジを見つけるためのPA価格アクションインジケーターです。ノイズや誤ったシグナルを除去し、取引ポテンシャルを高めるための高度なフィルターを備えています。複雑なインジケーターの複数のレイヤーを使用して、アトミックアナリストはチャートをスキャンし、複雑な数学的計算をシンプルなシグナルと色に変換します。これにより、どのような初心者トレーダーでも理解して使用し、一貫した取引の決定を行うことができます。 「アトミックアナリスト」は、新規および経験豊富なトレーダー向けにカスタマイズされた包括的な取引ソリューションです。プレミアムインジケーターとトップノッチの機能を1つの取引戦略に組み合わせ、すべてのタイプのトレーダーにとって汎用性のある選択肢にします。 デイリートレーディングとスキャルピング戦略:高速で正確な
        The indicator is designed to work on any trading platform. The program is based on proprietary algorithms and W.D.Ganna's mathematics, allowing you to calculate target levels of price movement based on three points with the highest degree of certainty. It is a great tool for stock trading. The indicator has three buttons: NEW - call up a triangle for calculation. DEL - delete the selected triangle. DELS - completely remove all constructions. The probability of achieving the goals is more than 80
        Introducing Your Ultimate Trading Edge: Dynamic Support & Resistance, Advance Entry Levels Indicator for MT5 platform Unlock the power of precision trading with our cutting-edge Dynamic Support & Resistance Indicator. Designed to give traders unparalleled clarity, this indicator is your roadmap to identifying exactly where to buy and sell, maximizing your potential for consistent, sustainable profits. Why Choose Our Indicator? Crystal Clear Entry and Exit Points : No more guesswork. Our indicat
        This indicator identifies and displays zones, as it were areas of strength, where the price will unfold. The indicator can work on any chart, any instrument, at any timeframe. The indicator has two modes. The indicator is equipped with a control panel with buttons for convenience and split into two modes. Manual mode: To work with manual mode, you need to press the NEW button, a segment will appear. This segment is stretched over the movement and the LVL button is pressed. The level is displayed
        Mt5TradeCopier
        Mcblastus Gicharu Ndiba
        Forex Trade copier MT5.  It copies forex trades, positions, orders from any accounts to any other account,  MT5 even multiple accounts. The unique copying algorithm exactly copies all trades from the master account to your client account. It is also noted for its high operation speed and Tough error handling. It also can copy from demo account to live account too. It is one of the best free trade copiers that can do ,  MT5 or to multiple accounts  MT5 to multiple accounts  Features of Trade Copi
        DYJ ChameleonTrend funciona com base no sistema Trend Following e Counter Trend. DYJ ChameleonTrend é um indicador de alta probabilidade. Este indicador usa um indicador Mix exclusivo que combina indicador sofisticado com discrição do usuário. Este indicador é um algoritmo de variância e ATR cruzado de adn Ma mais avançado. O indicador exibe duas setas direcionais coloridas e bolas de rolagem de tendência, indicando as melhores posições de entrada e saída para os traders. Entrada InpPeriod = 50
        このプロダクトを購入した人は以下も購入しています
        $450 (-20%) instead of $565 until 11/29 B e sure to watch this video before using A community for users, product discussion, update news, and first line of support  Use Webmoney For payments in cryptocurrencies. How I use this algo tool   Lazy Trader is NOT SUITABLE FOR SCALPING EVERY MINUTE MOVEMENT, ESPECIALLY IN CRYPTO. WITHOUT UNDERSTANDING WHAT IS HAPPENING ON THE CHART, THERE IS NO POINT IN BLINDLY HOPING FOR PROFITS! Lazy Trader does NOT USE openAI chat-gpt-4 technologies, which are ad
        YuClusters
        Yury Kulikov
        4.93 (42)
        Attention: You can view the program operation in the free version  YuClusters DEMO .  YuClusters is a professional market analysis system. The trader has unique opportunities to analyze the flow of orders, trade volumes, price movements using various charts, profiles, indicators, and graphical objects. YuClusters operates on data based on Time&Sales or ticks information, depending on what is available in the quotes of a financial instrument. YuClusters allows you to build graphs by combining da
        Mentfx Mmanage mt5
        Anton Jere Calmes
        4.25 (8)
        The added video will showcase all functionality, effectiveness, and uses of the trade manager. Drag and Drop Trade Manager. Draw your entry and have the tool calculate the rest. Advanced targeting and close portions of a trade directly available in tool (manage trades while you sleep). Market order or limit order on either side with factored spread. Just draw the entry, the tool does the rest. Hotkey setup to make it simple. Draw where you want to enter, and the stop loss, the tool calculates al
        The  Easy Strategy Builder (ESB)  is a " Do It Yourself " solution that allows you to create a wide range of the automated trading strategies without any line of codes. This is the world’s easiest method to automate your strategies that can be used in STP, ECN and FIFO brokers. No drag and drop is needed. Just by set conditions of your trading strategy and change settings on desired values and let it work in your account. ESB has hundreds of modules to define unlimited possibilities of strategi
        Trading Chaos Expert
        Gennadiy Stanilevych
        5 (10)
        This software has no equals in the world and represents a universal trade "console" covering trading signals, automated market entry, setting of Stop Loss and Take Profit, as well as Trailing Profit for multiple trades at the same time in a single open window. Intuitive control of the Expert Advisor in "three clicks" ensures a comprehensive use of all its functions on different computers, including tablets PCs. Interacting with additional signal indicators that mark the chart to give a real mark
        Binance Future用のMt5ボット(エキスパート) システムはBinanceFuture市場で稼働しています。 独自のコードに簡単に統合して、操作を自動化できます。 手動操作パネルが利用可能です。 ヘッジmod互換。 すべての操作は画面から手動で行うことができます。 これは、同時に多くの暗号通貨を制御するための最も効果的な方法です。 画面はバイナンス画面のテンプレートタイプです。 リンクからテンプレートファイルをダウンロードできます。 https://drive.google.com/file/d/1WHqGhym0QIK31l7kwfit9_tXb7YbqSuT/view?usp=sharing このプログラムはインストールが必要です。 https://www.mql5.com/tr/market/product/68694 https://www.mql5.com/tr/market/product/73887 パラメーター APIキー=バイナンスAPIキー シークレットキー=バイナンスシークレットキー
        Adam FTMO MT5
        Vyacheslav Izvarin
        5 (2)
        ADAM EA Special Version for FTMO Please use ShowInfo= false for backtesting ! Our 1st EA created using ChatGPT technology Trade only GOOD and checked PROP FIRMS  Default parameters for Challenge $100,000 Tested on EURUSD and GBPUSD only  Use 15MIN Time Frame Close all deals and Auto-trading  before Weekend at 12:00 GMT+3  Friday For Prop Firms MUST use special Protector  https://www.mql5.com/en/market/product/94362 -------------------------------------------------------------------------------
        Hedge Ninja
        Robert Mathias Bernt Larsson
        3 (2)
        Make sure to join our Discord community over at www.Robertsfx.com , you can also buy the EA at robertsfx.com WIN NO MATTER IN WHICH DIRECTION THE PRICE MOVES This robot wins no matter in which direction the price moves by following changing direction depending on in which direction price moves. This is the most free way of trading to this date. So you win no matter which direction it moves (when price moves to either of the red lines as seen on the screenshot, it wins with the profit target yo
        News Trade EA MT5
        Konstantin Kulikov
        4.5 (10)
        僕自身が数年間使っている便利なロボットをご紹介します。半自動モードでも完全自動モードでもお使いいただけます。 当プログラムは経済指標カレンダーで発表されるニュースをもとにした取引の柔軟な設定が可能です。戦略テスターでは確認不可です。実際の取引のみです。端末の設定メニューを開いて許可URLリストにニュースサイトを追加する必要があります。サービス > 設定 > エキスパート・アドバイザーをクリックしてください。”次のURLの WebRequestを許可する:"にチェックを入れてください。次のURLを追加してください(空白は削除します): https://  nfs.faireconomy.media 設定のモニタリングはデフォルトで完全自動モードで行われます: https://www.mql5.com/ja/signals/1447007 。似たような結果を得たい場合は任意のタイムフレームの GBPUSDチャートにエキスパート・アドバイザーを関連付けてください。(タイムフレームの種類は問いません。) 当該エキスパート・アドバイザーのためのカスタマイズ設定セットを作る場合は、ブ
        Unlimited Trade Copier Pro MT5 is a tool to copy trade remotely to multiple MT4, MT5 and cTrader accounts at different computers/locations over internet. This is an ideal solution for you if you are a signal provider and want to copy your trades to other receivers globally on your own rules. One provider can copy trades to multiple receivers and one receiver can get trade from multiple providers as well. The provider can even set the subscription expiry for each receiver, so that receiver will n
        Attention: this is a multicurrency EA, which trades by several pairs from one chart!  Therefore, in order to avoid duplicate trades, it is necessary to attach EA only to one chart, ---> all trading in all pairs is conducted only from one chart! we can trade simultaneously in three different pairs, as by default (EURUSD + GBPUSD + AUDUSD), which take into account the correlation when entering the market for all three; we can trade only EURUSD (or any currency pair) and at the same time take into
        INTRODUCTION : This Panel is made to detect the spike presence and opens trade transaction automatically after providing  a signal of control to operate autonomiousely the trade. It is a best scalper and a good spike catcher.   IMPORTANT : It is recommended to use Virtual Hosting Server VPS to optimize the methods implemented and to operate 24h a day. REQUIREMENTS : Relevant Terminal : Metatrader 5 - MT5. Brokers : Deriv Ltd and Others. Currency : Boom and Crash 1000 index Lot size : opti
        Trade on crypto exchanges in MT5! GRat_Crypto is a tool for manual and automated trading , including ANY available EA, ANY  cryptocurrency  on most popular crypto exchanges in the familiar MT5 environment 24/7. Features 1. ALL instruments of the 8 most popular crypto exchanges are available: Binance, BingX, Bybit, CommEX, Kraken,   KuCoin, MEXC and OKX . 2. The ability to place ANY type of order available in MT5, both market and pending, to modify orders and positions, to delete orders and clos
        In trading, losses are inevitable, but they can be managed effectively with the right tools. Lock Guard    can be used for insuring positions in manual trading or as an addition to another robot. It is a powerful tool for saving a trader's main positions because it can prevent losses from getting out of hand. Lock Guard is a trading tool that helps manage losses by automatically placing pending stop orders, which act as counter orders that become market orders when the price moves against t
        Trade like a time traveler thanks to latency arbitrage Everyone knows that the best way to make money in the markets is by knowing the future. Have you ever wished to know the future price of something in advance? Even if it were just a few days, hours, or minutes ahead? What if it were possible to know it but with less than a second of advance notice? That's precisely what the PZ Latency Arbitrage EA robot does. PZ Latency Arbitrage EA is your personal time machine: but it can only travel into
        News Trader Pro is a unique robot that allows you to trade the news by your predefined strategy. It loads every piece of news from several popular Forex websites. You can choose any news and preset the strategy to trade it, and then News Trader Pro will trade that news by selected strategy automatically when the news comes. News release gives opportunity to have pips since the price usually has big move at that time. Now, with this tool, trading news becomes easier, more flexible and more exciti
        Dear traders and investors! We present to you the MT5 Optimization Booster – an innovative product that will revolutionize your optimization experience on MetaTrader 5! The MT5 Optimization Booster is based on the innovative Quantum Swap Protocol (QSP) algorithm – a unique proprietary optimization strategy that forms the core of the product and elevates the process of finding optimal solutions to a new level. After the purchase , be sure to contact me . The product is designed to enhance the
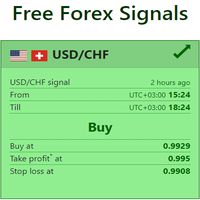
        Live Forex Signals サイト信号での取引用に設計されています   https://live-forex-signals.com/en と https://foresignal.com/en . Live Forex Signal for MetaTrader 4   https://www.mql5.com/en/market/product/81445 パラメータ サイトへのサブスクリプションを持っている場合は、ユーザー名とパスワードlive-forex-signals.com/foresignal.com サブスクリプションがない場合は、フィールドを空のままにします; オープンされているお得な情報へのコメント リスクリスクは、取引のための預金の割合として、リスク=0の場合、値ロットが使用されます 取引のためのロット固定ボリューム UseTakeProfitは、サイトから利益を取る使用します 当サイトからのご利用停止のご案内 F r e c h encysignalupdateinminute顧問のサイトへの訪問頻度を指定します MaximumSpreadFor
        FiboPlusWave Series products Ready-made trading system based on Elliott waves and Fibonacci retracement levels . It is simple and affordable. Display of the marking of Elliott waves (main or alternative option) on the chart. Construction of horizontal levels, support and resistance lines, a channel. Superposition of Fibonacci levels on waves 1, 3, 5, A Alert system (on-screen, E-Mail, Push notifications).    Features: without delving into the Elliott wave theory, you can immediately open one of
        PROTECT YOUR FTMO Account in a simplest way Must-Have Account Protector for any Prop-trading Account and Challenge MT4 / MT5 Expert Advisor that protects your Forex Prop Trading account from an unexpected drawdown! FTMO Protector  is a Tool that lets you manage trades and control your profit and loss across multiple Robots and currency pairs using a simple parameters and settings. Use as many EAs and Instruments you need, the Protector will: 1.   Calculate your midnight (01:00 System time) Balan
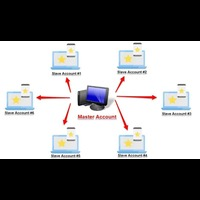
        The new version of  MirrorSoftware 2021  has been completely rewriten and optimized.  This version requires to be loaded only on a single chart because  it can detect all actions on every symbol and not only the actions of symbol where it is loaded. Even the  graphics and the configuration mode  have been completely redesigned. The MirrorSoftware is composed of two components (all components are required to work):  MirrorController  (free indicator): This component must be loaded into the MAST
        1. Record the price data for each Tick transaction. Data file contents: "Tick time", "ASK price", "BID price", "SPREAD SPREAD", "Tick quoted quantity". 2. Meanwhile, generate a quotation data file with a 1-minute period. Content of 1min data file: "ASK time", "ASK OPEN price", "ASK HIGH price", "ASK LOW price", "ASK CLOSE price", "BID time", "BID OPEN price", "BID HIGH price", "BID LOW price", "BID CLOSE price", "Tick quoted quantity". 3. Save all quotation data in one file every day, which is c
        私は連星の利用に対するその商用戦略をMT5で自動化しました、そして、我々のMt5BridgeBinaryで、私はそのBinary口座に命令を送りました、そして、私は以下をリストします:簡単なもののこの方法を操作し始めてください! 専門家のアドバイザーは、頑健さテストを最適化して、認識するために、作るのが簡単です;また、テストでは、その長期の収益性(我々がその最高の戦略をBinaryに接続するためにMt5BridgeBinaryをつくった理由です)を、我々は推定することができます。 特徴: - それは、私が望んだくらい多くの戦略を使用することができます。(専門家のアドバイザー)。 - 彼は、更なるプログラムを必要としません。 - 時間枠を輸入することなく、我々のEAを囲んでください。 - それは、すべての開いた活動を視覚化することができます。 - 彼だけは、すべての命令を受けるために1つのグラフだけの中で我々のEAを実行する必要があります。 - 我々のEAが働くように、それは複雑な構成を必要としません。 入場パラメータ: - メール:電子メールは、Binaryのその報告に関
        Xrade EA is an expert advisor as technical indicator. For short period trade it's the best for next previsions of the trend of the market. +--------------------------------------------------------------------------------------- Very Important Our robot(data anylizer) does'nt take a trade procedure. If using only our robot you must take positions by yoursels +--------------------------------------------------------------------------------------- The technical indiator provide for a give
        News: IDEA 2.0 is out with lot of features, like telegram bot notifications and Limits order! Check the changelog at bottom of page (*). Hi all, here you can find my Expert Advisor, called IDEA  (Intelligent Detection & managEr Algorithm) . In short, with this software you can: Have   a clear view of market status , with an indication of current trend. Simply add symbols you want to monitor to your market watch, and IDEA will notify you if some of them are in trend; Have an   automatic lots
        Technical confluence zones is a very popular tool for traders. This EA detects such zones by studying chart patterns, naked price levels, fib levels, SMA/EMA over multiple timeframes and more. The source data is loaded from Mytradingpet.com. To find out what are factored in when determining such zones, visit https://mytradingpet.com - a free service for all traders. The zones are color coded. Purple indicates the highest level of confluence.
        Oracle
        Denis Sotnikov
        5 (2)
        Эксперт - торговый помощник, созданный по одноимённой торговой стратегии Оракул в сотрудничестве с ее автором Нео. Определяет на графиках в автоматическом режиме разворотные импульсные модели и строит по ним Вилки Нео - авторский инструмент, позволяющий определять циклы движения цены и указывающий на ожидаемую цель TakeProfit . Поиск ведется на всех заданных периодах графиков одновременно с фильтрацией совпадений. Осуществляется фильтрация неверных Вилок с указанием кода ошибки. Утилита имеет
        Automatice sus estrategias comerciales con nuestra sencilla herramienta de creación de estrategias "similar a un rompecabezas".   Cree fácilmente estrategias que operen por usted en modo de piloto automático.   También puede cargar estrategias creadas por otras personas, como la clásica   Estrategia Martingala,   para usarla como muestra para su propia estrategia. Características clave Cree su estrategia a través de funciones simples de arrastrar y soltar, sin necesidad de conocimientos de pr
        Binance Full Trader is developed for connection to your Binance account and get data, draw price charts and trade easily with any strategy by an indicator. A user-friendly interface has developed for it and has tried to give access to the necessary information such as open orders and wallet balances. ·        There are two sample indicators (one for trade signal and another for price) that you can download it from these links: https://drive.google.com/file/d/1w2CGuu3rArWKMhS9LkepT9zhVkGR1AO7/vie
        As add-on to our professional divergence indicators we also created superb divergence scanners. These scanners give an overview of the different timeframes of the selected instruments and can save your tons of time. You can instantly see which instrument has a divergence on which timeframe. So no need to run through the charts manually anymore searching for good setups, with this scanner you see the whole market and you know where to look for a good trade opportunity. Even when you are not in fr
        作者のその他のプロダクト
        Ichimoku Map (instant look at the markets) - built on the basis of the legendary Ichimoku Kinko Hyo indicator. The task of the Ichimoku Map is to provide information about the market strength on the selected time periods and instruments, from the point of view of the Ichimoku indicator. The indicator displays 7 degrees of buy signal strength and 7 degrees of sell signal strength. The stronger the trend, the brighter the signal rectangle in the table. The table can be dragged with the mouse. T
        The indicator is a trading system for short-term trading. Scalper Assistant helps to determine the direction of the transaction, and also shows the entry and exit points. The indicator draws two lines (possible points for opening positions). At the moment of the breakdown of the upper line up (and when all trading conditions are met), an up arrow appears (a buy signal), as well as 2 goals. At the moment of the breakdown of the lower line down (and when all trading conditions are met), a do
        The indicator draws support and resistance lines on an important part of the chart for making decisions. After the trend line appears, you can trade for a breakout or rebound from it, as well as place orders near it. Outdated trend lines are deleted automatically. Thus, we always deal with the most up-to-date lines. The indicator is not redrawn . Settings: Size_History  - the size of the calculated history. Num_Candles_extremum  - the number of candles on each side of the extremum. Type_Ar
        The trading system is designed to work with gold on time periods: 30M, 1H. The indicator allows you to adjust to the market situation. Parameters for 1H :   PERIOD=9F ,   FILTER=300 .   Parameters for  30M :   PERIOD=22B ,   FILTER=450 .     A small adjustment to a specific broker is allowed .   If you change the amount of history displayed, you may also need to adjust the parameters. The indicator is not redrawn.     "Gold n XAU" uses different rules for entering a trade and different
        The indicator shows the market turning points (entry points). Reversals allow you to track rebound/breakout/testing from the reverse side of the lines of graphical analysis or indicators. Reversals can be an independent signal. The indicator allows you to determine reversals taking into account the trend and without it. You can choose a different period for the movement preceding the reversal, as well as the volatility coefficient. When plotting reversals, the indicator takes into account vola
        Measures the length of the selected movement in points, shows the duration of the movement, as well as the speed of movement.   Outputs the average value of each dimension. It is designed to calculate the expected target based on typical market movements. The intended goal will provide information about the ratio of the stop size to the possible profit and will allow you not to open positions with a small expected profit. It will also help you determine the point at which it is more logical t
        The indicator allows you to quickly switch from one instrument to another, from one time period to another using the keyboard or buttons on the monitor. Each command can be assigned a hot key from 0-9, a-Z (case-insensitive) and VK_OEM_COMMA ("<" on the keyboard) and VK_OEM_PERIOD (">" on the keyboard). This can help you to operate the maximum number of instruments that are available at your broker, analyze more instruments/periods in less time. This product cannot be tested in the tester , beca
        This indicator allows you to measure the profitability of each specific transaction (the ratio of Stop and Profit). The indicator allows you to adjust the ratio by step size and number of steps. You can build an unlimited number of ratios to compare the risks from different movements. Note: in MT4, the number of horizontal lines in a single ratio cannot exceed 32. Building a line : click the " Ratio " button and draw a line (mouse click - the first point of the line, where the mouse is relea
        The script displays info about the share's corporate reports and dividends. The data is downloaded from   investing.com : Report date Profit per share (EPS) Revenue Market capitalization Amount of dividends Date of payment of dividends Dividend income The product cannot be tested in the tester (since it is not possible to receive data from the Internet). Before launching:  Add 2   URL   https://ru.investing.com/earnings-calendar/Service/getCalendarFilteredData  and   https://ru.investing.com/
        The Envelopes indicator determines the presence of a trend or flat. It has 3 types of signals, shows the probable retracement levels and levels of the possible targets. The Fibonacci coefficients are used in the indicator's calculations. Signals (generated when touching the lines or rebounding from lines): Trend - the middle line of the Envelopes has a distinct inclination; the lines below the channel's middle line are used for buy trades, the lines above the middle line and the middle line itse
        The indicator shows and highlights the chart candles, which are formed as a result of large players entering the market in large volumes. Such candles can also be formed after achieving a certainty on the market, when most of the participants hold positions in the same direction. The movement is likely to continue in that direction after such candles. The indicator highlights the significant candles from the existing ones on the chart; The indicator allows identifying the trends based on candles
        The indicator identifies the most suitable moment for entering the market in terms of market volatility, when the market has the strength to move (the signal is indicated by an arrow under the candle). For each of the signals, the presence of trends on the current and higher timeframes is determined, so that the signal is in the direction of the majority of positions opened on the market (denoted near the signal by abbreviations of timeframes with a trend present). The signal appears after the c
        The indicator displays the key support and resistance levels on the chart. The significance of these levels lies in that the price may reverse or strengthen the movement when passing such levels, since they are formed as a consequence of the natural reaction of market participants to the price movement, depending on which positions they occupied or did not have time to occupy. The psychology of the level occurrence: there always those who bought, sold, hesitated to enter or exited early. If the
        This indicator is a multitimeframe trading strategy. It has the levels for stop loss, take profit and entry point. The order level can also be set manually. The indicator uses the regularity of the market, which manifests itself on all instruments, and does not require adjustment of the parameters. The strategy uses a proprietary approach to determining: trend, volatility, hierarchy of timeframe significance, the size of the history period (the number of candles), which is important for making a
        Trend Sync
        Pavel Verveyko
        5 (1)
        The indicator shows the trend of 3 timeframes: higher timeframe; medium timeframe; smaller (current) timeframe, where the indicator is running. The indicator should be launched on a chart with a timeframe smaller than the higher and medium ones. The idea is to use the trend strength when opening positions. Combination of 3 timeframes (smaller, medium, higher) allows the trend to be followed at all levels of the instrument. The higher timeframes are used for calculations. Therefore, sudden change
        The indicator detects important peaks and troughs (extremes) on the chart. These points can be used to plot support/resistance levels and trend lines, as well as any other graphical analysis. These points can serve as reference points for setting trading orders. The indicator does not redraw . Settings: Size_History  - the size of the calculated history. Num_Candles_Right  - number of candles to the right of the peak or trough. Num_Candles_Left  - number of candles to the left of the pea
        The indicator draws support and resistance lines on an important part of the chart for making decisions. After the trend line appears, you can trade for a breakout or rebound from it, as well as place orders near it. Outdated trend lines are deleted automatically. Thus, we always deal with the most up-to-date lines. The indicator is not redrawn . Settings: Size_History  - the size of the calculated history. Num_Candles_extremum  - the number of candles on each side of the extremum. Type_Ar
        The indicator shows key volumes confirmed by the price movement. The indicator allows you to analyze volumes in the direction, frequency of occurrence, and their value. There are 2 modes of operation: taking into account the trend and not taking into account the trend (if the parameter Period_Trend = 0, then the trend is not taken into account; if the parameter Period_Trend is greater than zero, then the trend is taken into account in volumes). The indicator does not redraw . Settings Histo
        This trading system is based on market impulses of varying complexity.   To generate a signal, the indicator uses the moments when the direction of the pulse and the necessary section of the trend coincide. The indicator also takes into account the current market volatility. Stop_loss tags can be set with the parameter "0" or "1", then Stop_Loss will take into account market volatility.   Take_Profit tags can be set with the parameter "0", then Take_Profit will take into account market volat
        The stocks that make up the index are one of the drivers of the movement. Analyzing the financial performance of all elements of the index, we can assume further development of the situation. The program (script) displays corporate reports of shares that are part of the index selected in the settings.   "Indexes" cannot be tested in the tester (since there is no way to get information from the Internet). Information is downloaded from the site investing.com: Report Date Earnings per share
        The indicator builds a graphical analysis based on the Fibonacci theory. Fibo Fan is used for the analysis of the impulses and corrections of the movement. Reversal lines (2 lines at the base of the Fibonacci fan) are used to analyze the direction of movements. The indicator displays the of 4 the target line in each direction. The indicator takes into account market volatility. If the price is above the reversal lines, it makes sense to consider buying, if lower, then selling. You can op
        The indicator determines the state of the market: trend or flat. The state of the market is determined by taking into account volatility. The flat (trading corridor)is displayed in yellow. The green color shows the upward trend. The red color shows the downward trend. The height of the label corresponds to the volatility in the market. The indicator does not redraw . Settings History_Size   - the amount of history for calculation. Period_Candles  - the number of candles to calculate the
        The indicator plots flexible support and resistance levels (dots). A special phase of movement is used for construction. Levels are formed dynamically, that is, each new candle can continue the level or complete it. The level can provide resistance or support to the price even where it is no longer there. Also, support and resistance levels can change roles. The importance of levels is affected by: the amount of time the level is formed and the number of touches. The significance of these l
        The indicator is a trading system for short-term trading. Scalper Assistant helps to determine the direction of the transaction, and also shows the entry and exit points. The indicator draws two lines (possible points for opening positions). At the moment of the breakdown of the upper line up (and when all trading conditions are met), an up arrow appears (a buy signal), as well as 2 goals. At the moment of the breakdown of the lower line down (and when all trading conditions are met), a do
        The trading system is designed to work with gold on time periods: 30M, 1H. The indicator allows you to adjust to the market situation. Parameters for 1H :   PERIOD=9F ,   FILTER=300 .   Parameters for  30M :   PERIOD=22B ,   FILTER=450 .   A small adjustment to a specific broker is allowed .   If you change the amount of history displayed, you may also need to adjust the parameters. The indicator is not redrawn.     "Gold n XAU" uses different rules for entering a trade and different ru
        The indicator determines the most important component of any trading system - the possible exit point from the transaction. As the price moves, depending on the market situation, the indicator builds goals. The target becomes relevant when the price starts moving towards the target. If the movement is strong, then it may take a certain number of targets to stop or reverse price. The accumulation of targets is most likely able to stop the price. Some goals are executed several times. But the
        The indicator builds "psychological levels": levels of round numbers and intermediate levels of round numbers. Round numbers play an important role in forming support and resistance levels. There is a pattern in which the decline or growth of the price can stop at round numbers. The level whose price ends at 0 is the level of a round number of the first order. Intermediate level, this is the level between two round levels, for example, between 10 and 20 this is level 15. In the " Num_Zero
        Ichimoku Map (instant look at the markets) - built on the basis of the legendary Ichimoku Kinko Hyo indicator. The task of the Ichimoku Map is to provide information about the market strength on the selected time periods and instruments, from the point of view of the Ichimoku indicator. The indicator displays 7 degrees of buy signal strength and 7 degrees of sell signal strength. The stronger the trend, the brighter the signal rectangle in the table. The table can be dragged with the mouse. T
        The indicator displays a stock chart of a non-standard type, in which the price and time have the same value. The usual chart of Japanese candlesticks does not take into account all the information that the time analysis can give. Renko charts do not use all the information that price can give in relation to time. The "Chart Price and Time" indicator takes into account price and time equally and shows the predominance of price or time. Taking into account price and time equally gives an i
        The indicator tracks sharp volatility (moments when the market has shown increased activity and movement may occur), on the selected instruments and time periods. The information is displayed as colored rectangles. Thus, it is possible to assess at a glance which tool should be given priority attention. The indicator will be useful for scalpers when they need a quick reaction or for traders working with a large number of instruments. The indicator does not redraw. The indicator displays 8 degr
        フィルタ:
        レビューなし
        レビューに返信
        バージョン 1.1 2021.06.22
        correction of the information search algorithm