KTrade Data Statistics 5 CN
- インディケータ
- Kaijun Wang
- バージョン: 1.20
- アップデート済み: 24 11月 2020
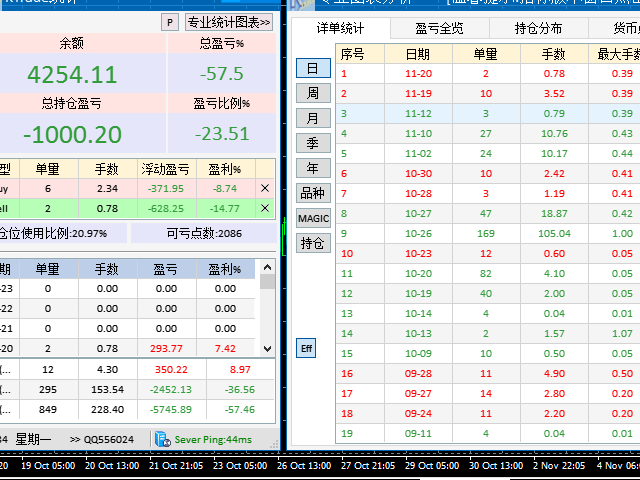
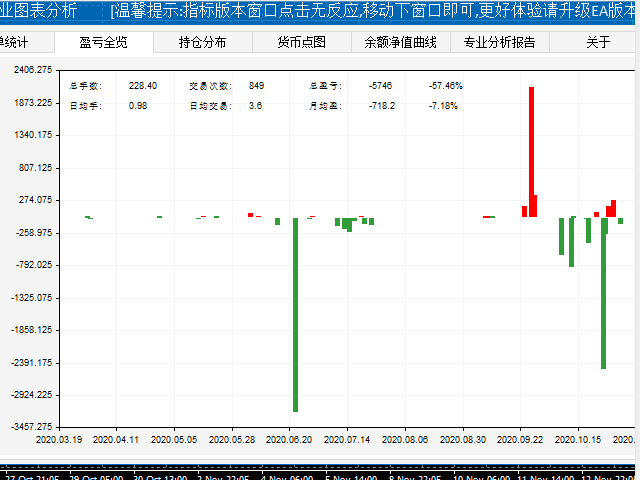
Indicators are professional data statistics, position orders, historical order analysis->>>>>>
<This version is in Chinese -> English version please move>
Necessary for traders: tools and indicators
| Waves automatically calculate indicators, channel trend trading | Perfect trend-wave automatic calculation channel calculation , MT4 | Perfect trend-wave automatic calculation channel calculation , MT5 |
| Local Trading copying | Easy And Fast Copy , MT4 | Easy And Fast Copy , MT5 |
| Local Trading copying For DEMO | Easy And Fast Copy , MT4 DEMO | Easy And Fast Copy , MT5 DEMO |
Strongly recommend trend indicators, automatic calculation of wave standard and MT5 version of automatic calculation of wave standard
Cooperation QQ:556024"
Cooperation wechat:556024"
Cooperation email:556024@qq.com"
Professional EA indicator writing.Mass angefertigt.
tongji bcuo