Engulfing 13EMA
- インディケータ
- Janelovey Rongomaiwahine Kappely
- バージョン: 2.1
- アップデート済み: 29 12月 2020
- アクティベーション: 12
Description:
The Engulfing 13EMA is a Multi Timeframe Indicator that scans Multiple Symbols which will help you to identify potential trade set ups.
As well as Forex, it can scan Crypto, Exotics, Metals, Indices, Energies or what ever else you have in your Market Watch list.
You also have the option to enable/disable the time frames you want to scan. (M1,M5,M15,M30,H1,H4,D1,W1,MN1)
All of these options are made possible from just ONE chart, from which the Indicator is attached
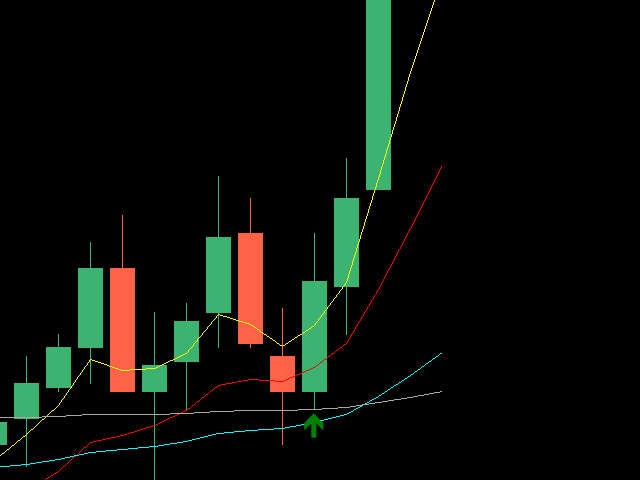
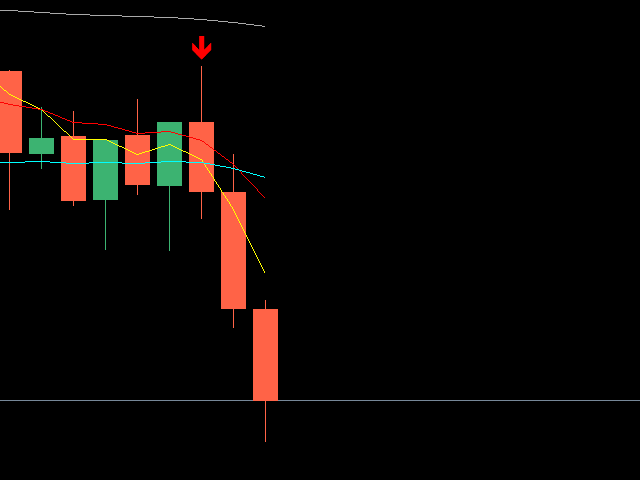
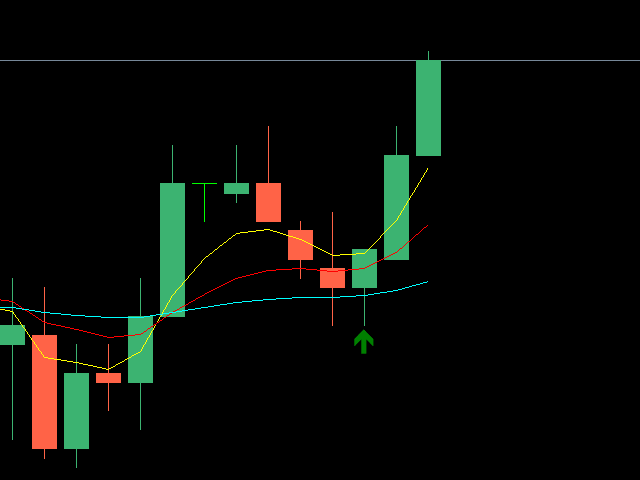
An alert is presented when the 13EMA passes through certain Engulfing candles, based on certain parameters with the 50EMA close by.
For each symbol alert, an individual chart will automatically open and a Green Up arrow or a Red Down arrow will present on the chart showing a potential trade set up.
There is a Chart Template file, that will need to be added to your MT4 and is preloaded with 5 different EMAs, which will help you determine the best Alerts.
Full Installation Instructions and Chart Template can be downloaded from the Discord Group.
https://discord.gg/U4dDcSYRvN
Settings:
By default, the following settings are applied
- All 28 Main Currency Pairs Enabled
- Pop Up Alert Enabled
- Sound Alert Enabled
- Open Chart on Signal Enabled
- Screen Shot Enabled
- M15, M30, H1, H4, D1, W1, MN1 Enabled
- 5 & 13 EMA Settings DO NOT need to be adjusted
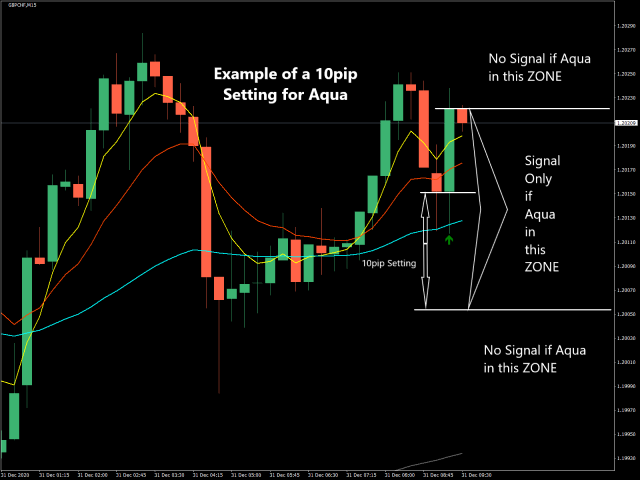
- 50EMA is set to 10pips from Engulfing Candle Body
Features:
- Choose between, 28 Main Currency Pairs, Custom Symbol List (Up to 36 Pairs) or All Market Symbols on your MT4 list including Exotics, Crypto, Metals, Indices and Commodities.
- The ability to enable/disable the time frames you want. (M1,M5,M15,M30,H1,D1,W1,MN1)
- Screen Shots are taken of all signals presented so you can analyse later.
- The Indicator will scan all pairs based on your settings and automatically load individual charts of all signals presented, ready for quick execution.
- No need to open several charts for every pair and timeframe you want an alert for. Indicator just gets attached to one chart ONLY and will scan every symbol and timeframe you select.
Note: This indicator should only be used as a guide only and proper analysis should be made by the trader.
There maybe slight variations in Alerts, depending on who your Broker is.