• 概要
  • レビュー
  • コメント
  • 最新情報

Trend Lines MT5

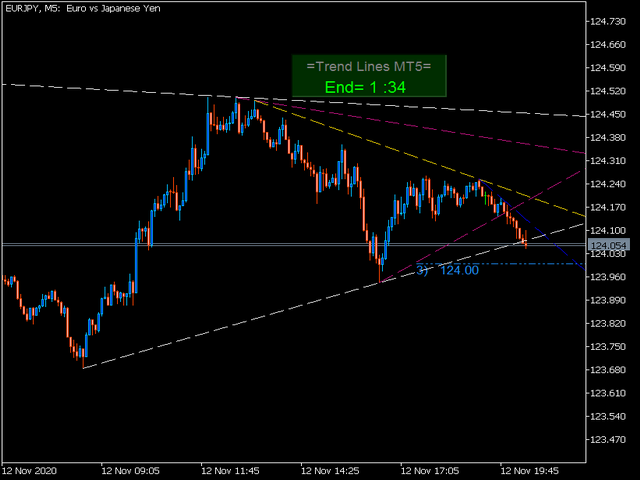
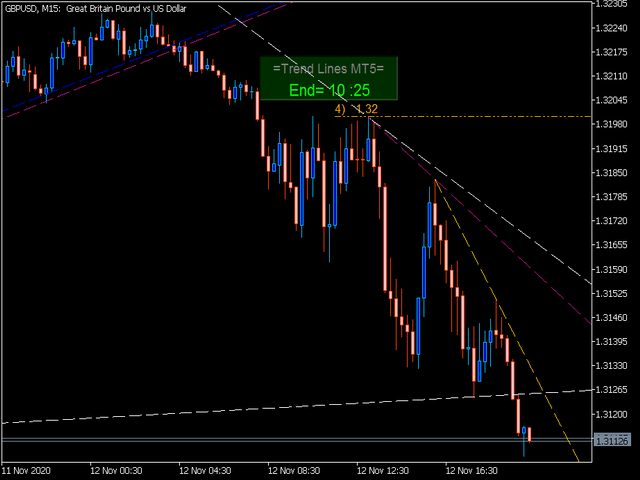
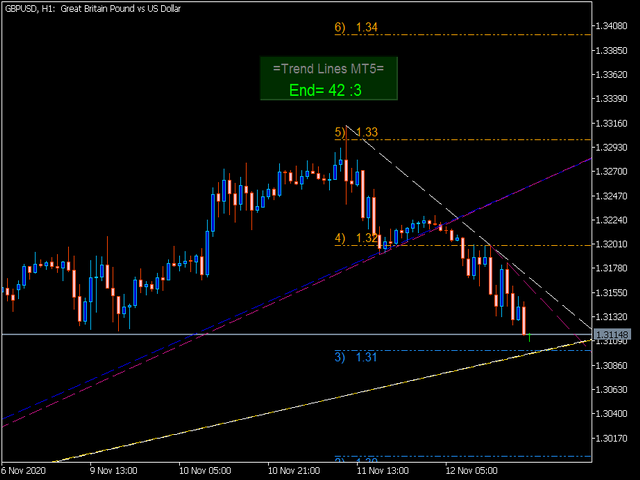
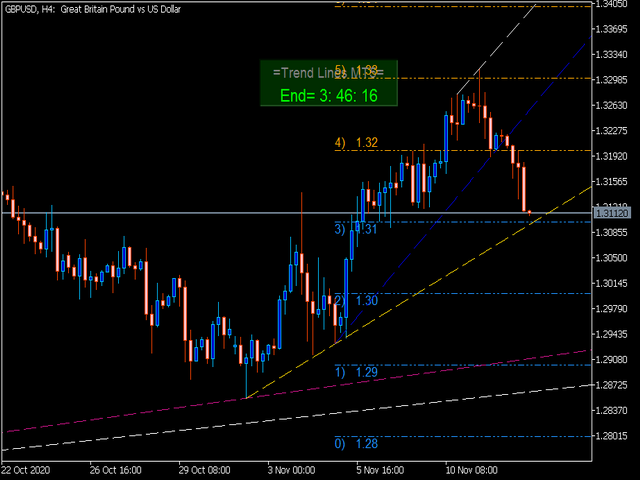
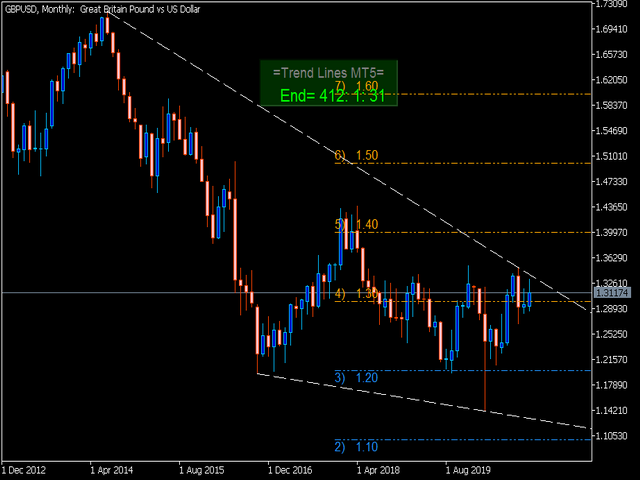
Индикатор MT5 строит классические трендовые линии по фракталам. Он предназначен для быстрого анализа финансовых инструментов. Работает на любых периодах и любых инструментах. Индикатор настроен на оптимальную работу на каждом периоде графика. Не нуждается в дополнительных настройках. Для лучшего восприятия линии окрашены в разные цвета.

  Дополнительно:

  • рисует круглые уровни кратные 100
  • отсчитывает время до окончания текущего периода. 

В меню свойства индикатора можно:

  • ShowRoundLevels=true/false    включить/отключить "Круглые уровни"
  • Show_Clock        =true/false     включить/отключить "Время до конца периода"

С благодарностью приму Ваши замечания и предложения по улучшению индикатора.

Не забудьте оставить вашу оценку.


おすすめのプロダクト
PULLBACK HUNTER What is every trader's cherished dream? To see without delay the places where the reversal will happen. This, of course, is from the category of magic, though... nothing is impossible. But for now I've prepared for you an indicator that marks in real time the end of corrections to the current movement or in short - catches pullbacks.What is the main point? Many people practice rebounds when the price moves in the direction of the open position. And they do them on the formation o
123パターン は、最も人気のある強力で柔軟なチャートパターンの1つです。このパターンは、3つの価格ポイントで構成されています。ボトム、ピークまたはバレー、および38.2%〜71.8%のフィボナッチリトレースメントです。パターンは、価格が最後のピークまたは谷、インディケーターが矢印をプロットし、アラートを上昇させ、取引を行うことができる瞬間を超えたときに有効と見なされます。 [ インストールガイド | 更新ガイド | トラブルシューティング | よくある質問 | すべての製品 ] クリアな取引シグナル カスタマイズ可能な色とサイズ パフォーマンス統計を実装します カスタマイズ可能なフィボナッチリトレースメントレベル 適切なストップロスおよび利益レベルを表示します インジケーターを使用して、継続パターンまたは反転パターンを見つけることができます 再描画および非再描画ではありません 電子メール/音声/視覚アラートを実装します 123パターン は、継続パターンまたは反転パターンとして現れます。物事を簡単にするために、このインジケーターを使用して、検索するパターンのタイプを選択でき
This Indicator help you to identify trends and patterns. It shows the short-term, medium-term and long-term trend at the same time on the screen. It supports every timeframe except monthly. This indicator NOT implement the ZigZag indicator, but it uses its own algorithm. Supported markets: -         Forex -         Metal -         Energies Spot -         in Energies Futures only o    US Crude Oils -         in Indices Spot only o    US Tech 100 Index o    UK 100 Index o    US Wall Street 30 I
The Trend Detect indicator combines the features of both trend indicators and oscillators. This indicator is a convenient tool for detecting short-term market cycles and identifying overbought and oversold levels. A long position can be opened when the indicator starts leaving the oversold area and breaks the zero level from below. A short position can be opened when the indicator starts leaving the overbought area and breaks the zero level from above. An opposite signal of the indicator can
This indicator can be considered as a trading system. It offers a different view to see the currency pair: full timeless indicator, can be used for manual trading or for automatized trading with some expert advisor. When the price reaches a threshold a new block is created according to the set mode. The indicator beside the Renko bars, shows also 3 moving averages. Features renko mode median renko custom median renko 3 moving averages wicks datetime indicator for each block custom notificatio
まず第一に、この取引インジケーターは再描画されず、再描画されず、遅延しないことを強調する価値があります。これにより、手動取引とロボット取引の両方に理想的なものになります。 ユーザーマニュアル:設定、入力、戦略。 アトミックアナリストは、価格の強さとモメンタムを利用して市場でより良いエッジを見つけるためのPA価格アクションインジケーターです。ノイズや誤ったシグナルを除去し、取引ポテンシャルを高めるための高度なフィルターを備えています。複雑なインジケーターの複数のレイヤーを使用して、アトミックアナリストはチャートをスキャンし、複雑な数学的計算をシンプルなシグナルと色に変換します。これにより、どのような初心者トレーダーでも理解して使用し、一貫した取引の決定を行うことができます。 「アトミックアナリスト」は、新規および経験豊富なトレーダー向けにカスタマイズされた包括的な取引ソリューションです。プレミアムインジケーターとトップノッチの機能を1つの取引戦略に組み合わせ、すべてのタイプのトレーダーにとって汎用性のある選択肢にします。 デイリートレーディングとスキャルピング戦略:高速で正確な
Hunter Trend: Arrow Indicator for Binary Options Trading Hunter Trend is an arrow indicator designed for trading binary options (turbo options) on the M1 timeframe, allowing for short-term trading opportunities. How to Trade with this Tool: Signals may appear when a candlestick forms. Once such a signal appears, wait for the closure of that candlestick. Upon the opening of a new candlestick, open a trade for 1-2 candlesticks in the indicated direction. In this case, for 1-2 minutes. A blue dot
トレンドラインは、外国為替取引におけるテクニカル分析の最も重要なツールです。残念ながら、ほとんどのトレーダーはそれらを正しく描画していません。自動トレンドラインインジケーターは、市場のトレンドの動きを視覚化するのに役立つ本格的なトレーダー向けのプロフェッショナルツールです。 トレンドラインには、強気トレンドラインと弱気トレンドラインの2種類があります。 上昇トレンドでは、外国為替トレンドラインは価格変動の最低スイングポイントを介して描画されます。 少なくとも2つの「最低安値」を接続すると、トレンドラインが作成されます。 下降トレンドでは、トレンドラインは価格変動の最も高いスイングポイントを介して描画されます。 少なくとも2つの「最高値」を接続すると、トレンドラインが作成されます。 トレンドラインが壊れたとき? 弱気のろうそくが強気のトレンドラインの下で閉じ、ろうそくの高さがトレンドラインの上にあるとき、強気のトレンドラインは壊れます。 強気のろうそくが弱気のトレンドラインの上で閉じ、ろうそくの安値がトレンドラインの下にあるとき、弱気のトレ
The Trend Complete indicator is a signal indicator and has interesting properties. It should be taken into account that this indicator reflects extremes and should be used as an additional one, and another instrument should be used for the entry point. Searches for and displays pivot points on the price chart. Trend indicators are one of the main tools for analyzing trends in the Forex market. The indicator is able to transmit all types of signals to the user: messages, E-mail and Push! The g
Rubdfx Spike Indicator 1.5: Updated for Strategic Trading The Rubdfx Spike Indicator is developed to aid traders in identifying potential market reversals and trends. It highlights spikes that indicate possible upward or downward movements, helping you observe when a trend may continue. A trend is identified when a buy or sell spike persists until the next opposite spike appears. Key Features: Versatility: Any Timeframe Adaptability: Designed   to work on all Timeframes however Recommended for
The Market Reversal Catcher indicator looks for market reversal points or major pullback. To do this, it analyzes previous price movements and using a flexible algorithm for estimating the probability of a reversal, also gives recommendations on entry points and sets recommended profit targets for positions opened on a signal. Market Reversal Cather User Guide -   Read Version for MetaTrader 4 - here The indicator is very easy to use and does not require a lot of information to understand how it
MT4版  |  FAQ Owl Smart Levels Indicator は、 Bill Williams の高度なフラクタル、市場の正しい波構造を構築する Valable ZigZag、エントリの正確なレベルをマークする Fibonacci レベルなどの一般的な市場分析ツールを含む 1 つのインジケーター内の完全な取引システムです。 利益を得るために市場と場所に。 戦略の詳細な説明 インジケータを操作するための指示 顧問-取引助手 プライベートユーザーチャット ->購入後に私に書いて、私はプライベートチャットにあなたを追加し、あなたはそこにすべてのボーナスをダウンロードすることができます 力はシンプルさにあります! Owl Smart Levels 取引システムは非常に使いやすいので、専門家にも、市場を勉強し始めて自分で取引戦略を選択し始めたばかりの人にも適しています。 戦略と指標に秘密の数式や計算方法が隠されているわけではなく、すべての戦略指標は公開されています。 Owl Smart Levels を使用すると、取引を開始するためのシグナルをすばやく確認し、注文を出すため
"Pattern 123" is an indicator-a trading system built on a popular pattern, pattern 123. This is the moment when we expect a reversal on the older trend and enter the continuation of the small trend, its 3rd impulse. The indicator displays signals and markings on an open chart. You can enable/disable graphical constructions in the settings. The indicator has a built-in notification system   (email, mobile terminal, standard terminal alert). "Pattern 123" has a table that displays signals fr
Special Channel channel indicator is a classic indicator of a family of channel indicators, the use of which allows the trader to respond in time to the price out of the channel set for it. This corridor is built on the basis of the analysis of several candles, starting from the last, as a result of which the extrema of the studied interval are determined. It is they who create the channel lines. Trading in the channel is one of the most popular Forex strategies; its simplicity allows even be
プレミアムレベルは、正しい予測の精度が80%を超える独自の指標です。 この指標は、最高のトレーディングスペシャリストによって2か月以上テストされています。 あなたが他のどこにも見つけられない作者の指標! スクリーンショットから、このツールの正確さを自分で確認できます。 1は、1キャンドルの有効期限を持つバイナリーオプションの取引に最適です。 2はすべての通貨ペア、株式、商品、暗号通貨で機能します 手順: 赤い矢印が表示されたらすぐにダウントレードを開き、青い矢印が表示されたら閉じます。青い矢印の後に開くこともできます。 試してテストしてください!推奨設定はデフォルトです! 日足チャートで最高の精度を示します! インディケータは、2600 Pipsの収益性に対して、約10Pipsという非常に小さなマージンを使用します。
Terra Infinity is a flat indicator. This improved version of the CalcFlat indicator has three additional lines that significantly increase its effectiveness. Unlike its predecessor with two static levels, Terra Infinity adds three dynamic lines above the main histogram, which are interpreted as follows: base signal line, minimum signal line, maximum signal line. These lines are formed using the additional parameter Avg, which is the average value of the histogram. Averaging produces a line
Donchian Channel DC is the indicator of Donchian Channels, that plots maximum and minimum values of a specific period, besides mean value line. It´s possible to configure simple period for analysis and the indicator will plot all three values. You can trade with this indicator as trend or reversal, according to each strategy. Do not let to test others indicators as soon as others expert advisors.
Your Pointer is no ordinary Forex channel. This corridor is built on the basis of the analysis of several candles, starting from the last one, as a result of which the extremes of the studied interval are determined. They are the ones who create the channel lines. Like all channels, it has a middle line as well as a high and low line. This channel is worth watching for its unusual behavior. The use of the Your Pointer indicator allows the trader to react in time to the price going beyond the bo
Point Black
Ignacio Agustin Mene Franco
Black Card Pack indicator 5/1 point black It has the strategy of professional bollingers where each arrow gives you a different entry signal. It is used to operate in m1 and in d1 It is used for scalping and intraday, modified for forex markets ! suitable for all pairs modified for synthetic index markets suitable for all pairs! Ideal for volatility and jumps!
シンプルでありながら効果的なポジション取引戦略であるオーダーブロックの個人的な実装。価格範囲がブレイクアウトの反対方向に違反されていない場合、トレーダーは市場に参入するか、最後の注文ブロックの方向で取引を探す必要があります。わかりやすくするために、開いたブロックは描かれていません。 [ インストールガイド | アップデートガイド | トラブルシューティング | FAQ | すべての製品 ] 強気のオープンブロックは、新鮮な市場の安値の後の最初の強気のバーです 弱気のオープンブロックは、新鮮な市場の高値の後の最初の弱気のバーです 開いているブロックが壊れると信号が表示され、注文ブロックになります オーダーブロックが反対側に折れると、反転ブロックになります インジケーターはすべての種類のアラートを実装します 塗り直しや裏塗りはしません 入力パラメータ 期間:新鮮な高値または安値を作成するために必要なバーの量。値が小さいほど、信号が多くなります。 最小ATRフィルター:ATRの乗数として表される、オーダーブロックバーの最小ボディサイズ。 最大ATRフィルター:ATRの乗数として表
Bars Black
Ignacio Agustin Mene Franco
Black Card Pack indicators. Bars Black indicator 5/5 of the pack It has a strategy of breaking bars as the indicator is called, It is very easy to use, although you can see it in the photo when you break the ema bars down to get into position up is the same! It works for all temporalities, it is used to hunt big trends and scalp suitable for forex and synthetic indices works on all pairs of both!
This is an advanced multi-timeframe version of the popular Hull Moving Average (HMA) Features Two lines of the Hull indicator of different timeframes on the same chart. The HMA line of the higher timeframe defines the trend, and the HMA line of the current timeframe defines the short-term price movements. A graphical panel with HMA indicator data from all timeframes at the same time . If the HMA switched its direction on any timeframe, the panel displays a question or exclamation mark with a tex
Supertrend indicator uses a combination of a moving average and average true range to detect the trend of a trading instrument. Supertrend indicator for MetaTrader 5 easily shows the trend as a line following the price. Triple SuperTrend Histo indicator  calculate  three supertrends to show the trend as a histogram. Changing the color from red to green means you can BUY , from green to red means you can SELL . Description of the method of drawing a histogram. The price is above the EMA 20
The indicator determines the state of the market: trend or flat. The state of the market is determined by taking into account volatility. The flat (trading corridor)is displayed in yellow. The green color shows the upward trend. The red color shows the downward trend. The height of the label corresponds to the volatility in the market. The indicator does not redraw . Settings History_Size   - the amount of history for calculation. Period_Candles  - the number of candles to calculate the
Highly configurable MFI indicator. Features: Highly customizable alert functions (at levels, crosses, direction changes via email, push, sound, popup) Multi timeframe ability Color customization (at levels, crosses, direction changes) Linear interpolation and histogram mode options Works on strategy tester in multi timeframe mode (at weekend without ticks also) Adjustable Levels Parameters: MFI Timeframe:  You can set the current or a higher timeframes for MFI. MFI Bar Shift:   you can set th
FREE
Ultra KZM
Nattapat Jiaranaikarn
Ultra KZM is an Expert Advisor that using the unique trading operation. It's strategy is based on the combination of grid and correlation system which is the new method that I invented and developed for a long time. You can see Live Signal from these links : (delete space) 1.  https: //www .myfxbook.com/portfolio/ultra-kzm-eurjpyeurchf/10224608 2.  https: //www .myfxbook.com/portfolio/ea-ultra-kzm-real-account/10374382 Note that this EA should run in ECN swap-free account. When you backtest
Indicator and Expert Adviser  EA Available in the comments section of this product. Download with Indicator must have indicator installed for EA to work. Mt5 indicator alerts for bollinger band and envelope extremes occurring at the same time. Buy signal alerts occur when A bullish candle has formed below both the lower bollinger band and the lower envelope  Bar must open and close below both these indicators. Sell signal occur when A bear bar is formed above the upper bollinger band and upp
The Half ma arrow indicator for the MetaTrader 5 trading terminal is a simple but effective tool that gives a signal about a change in the current trend. The Half ma indicator looks like a solid dynamic line that changes color at the points where the trend changes. At these points, the indicator draws arrows of the corresponding color and direction.The Half ma arrow indicator for the MT5 terminal is not an independent source of input signals. It will be most effective to use it as a trend filte
Looking for reliable levels on a price chart? Already tired of searching for similar indicators? Are the levels not working out as they should? Then this is the indicator for you. Volume Prices Universal is a reliable indicator of horizontal volumes. What does it show? First of all, the main idea of ​​the indicator is to display at which price mark the price has been for the longest time. Thus, the display of price volumes on the price chart is formed. With the help of which you can very simp
CCI Indicator Super   is based on Pending Position strategy ( PPS ) and a very advanced secretive trading algorithm. The strategy of  CCI Indicator Super    is a combination of a secretive custom indicator, Trendlines, Support & Resistance levels ( Price Action ) and most important secretive trading algorithm mentioned above. DON'T BUY AN EA WITHOUT ANY REAL MONEY TEST OF MORE THAN 3 MONTHS, IT TOOK ME MORE THAN 100 WEEKS(MORE THAN 2 YEARS) TO TEST BONNITTA EA ON REAL MONEY AND SEE THE RESULT
このプロダクトを購入した人は以下も購入しています
まず第一に、このトレーディングシステムがノンリペイント、ノンリドロー、ノンラグのインジケーターであることを強調する価値がある。これにより、手動取引とロボット取引の両方に理想的なものになっています。 オンラインコース、マニュアル、プリセットのダウンロード。 「スマートトレンドトレーディングシステム MT5」は、新規および経験豊富なトレーダー向けにカスタマイズされた包括的なトレーディングソリューションです。10以上のプレミアムインジケーターを組み合わせ、7つ以上の堅実なトレーディング戦略を備えており、多様な市場状況に対応する多目的な選択肢となっています。 トレンドフォロー戦略:トレンドを効果的に乗り越えるための正確なエントリーとストップロス管理を提供します。 リバーサル戦略:潜在的なトレンドの反転を特定し、トレーダーがレンジ相場を活用できるようにします。 スキャルピング戦略:高速で正確なデイトレードおよび短期取引のために設計されています。 安定性:すべてのインジケーターはノンリペイント、ノンリドロー、ノンラグであり、信頼性の高いシグナルを保証します。 カスタマイズ:個々の取引の嗜好に合わせ
TPSpro TREND PRO は 、市場を自動的に分析し、トレンドとその各変化に関する情報を提供し、再描画せずに取引にエントリーするためのシグナルを提供するトレンド指標です。 インジケーターは各ローソク足を使用し、個別に分析します。上向きまたは下向きのさまざまな衝撃を指します。通貨、仮想通貨、金属、株、指数の取引への正確なエントリーポイント! バージョンMT5                   インジケーターの完全な説明     RFI LEVELS インジケーター と併用することをお勧めします。 主な機能: レンダリングなしで正確な入力信号! シグナルが表示されると、それは関連性を維持します。これは、シグナルを提供してからそれを変更し、その結果、入金された資金が失われる可能性があるリドローインジケーターとの重要な違いです。より高い確率と精度で市場に参入できるようになりました。矢印が表示された後、ターゲットに到達する (利益確定) か反転シグナルが表示されるまで、ローソク足に色を付ける機能もあります。 STOP-LOSS/TAKE-PROFITゾーンの表示 エントリーポイン
最初のパルスレベルを反転 (RFI)     指示する     ロシア     -        utilizar con   el indicador の ESP 推奨事項 -   TPSpro トレンド プロフェッショナル版 -   MT5のバージョン 最も重要なことは、将来においても最も重要なことです。 機能のプリンシパル: ゾーンのほとんどは、ベンダーとコンプラドールによってアクティブ化されます。 状況を直感的に把握できるよう、初期の衝動を修正します。 LOGIC AI: MUESTRA zonas (círculos) parabuscar puntos de entrada cuando se activa una plantilla 視覚的に優れた視覚効果があり、最も重要な機能がすべて揃っていることに注意してください。 優れたニベレス/ゾーンの視覚化 (modo MTF) 世界で最も人気のある場所/ゾーンです。これを使用するのに最適な方法です (   TPSproTREND PRO   )。 アルゴリズム プロフェッショナル セパラド パソ ア パソ パラ オペラ それは
これはMT5のインジケーターで、再描画なしで取引に参入するための正確なシグナルを提供します。 外国為替、暗号通貨、金属、株式、インデックスなど、あらゆる金融資産に適用できます。かなり正確な見積もりを提供し、取引を開始して終了するのに最適な時期を教えてくれます。1つのシグナルを処理しただけでインジケーターの元が取れた例の 動画 (6:22)をご覧ください。Entry PointsPro インジケーターの助けを借りたほとんどのトレーダーの最初の1週間の結果が改善しています。 Telegramグループ に登録してください。Entry Points Proインジケーターのメリットは次の通りです。 再描画のないエントリーシグナル 再描画されるインジケーターでは一度表示されたシグナルが削除されて大きな金銭的損失につながることがありますが、これと異なり、表示されて確認されたシグナルは消えることがありません。 エラーなしの取引開始 インジケーターアルゴリズムによって取引を開始する(資産を売買する)理想的な瞬間を見つけることができます。それを使用するすべてのトレーダーの成功率が向上します。
まず第一に、この取引ツールはノンリペイント、ノンリドロー、ノンラグの指標であり、プロの取引に理想的ですことを強調する価値があります。 オンラインコース、ユーザーマニュアル、デモ。 スマートプライスアクションコンセプトインジケーターは、新米から経験豊富なトレーダーまで、非常 に強力なツールです。Inner Circle Trader AnalysisやSmart Money Concepts Trading Strategiesなど、20以上の有用な指標を1つに組み合わせています。このインジケーターはスマートマネーコンセプトに焦点を当て、大手機関の取引方法を提供し、彼らの動きを予測するのに役立ちます。 特に、流動性分析に優れており、機関がどのように取引しているかを理解しやすくしています。市場のトレンドを予測し、価格の動きを慎重に分析するのに優れています。機関の戦略とトレードを合わせることで、市場の動向についてより正確な予測ができます。このインジケーターは多目的であり、市場構造を分析し、重要な注文ブロックを特定し、さまざまなパターンを認識するのに優れています。 このインジ
Quantum Trend Sniper
Bogdan Ion Puscasu
4.92 (48)
ご紹介   クォンタム トレンド スナイパー インジケーターは 、トレンド反転を特定して取引する方法を変革する画期的な MQL5 インジケーターです。 13年以上の取引経験を持つ経験豊富なトレーダーのチームによって開発されました。     クォンタムトレンドスナイパーインジケーター   は、非常に高い精度でトレンドの反転を識別する革新的な方法で、あなたのトレーディングの旅を新たな高みに押し上げるように設計されています。 ***Quantum Trend Sniper Indicatorを購入すると、Quantum Breakout Indicatorを無料で入手できます!*** クォンタム ブレイクアウト インジケーターは、トレンドの反転を特定するとアラートを発し、矢印を示し、3 つのテイクプロフィットレベルを提案します。 初心者トレーダーにもプロのトレーダーにも適しています。 量子EAチャネル:       ここをクリック MT4のバージョン:       ここをクリック 推奨事項: 期間:すべての時間枠。最良の結果を得るには、M
mql5と Telegramの モーニング・ブリーフィングで、詳細とスクリーンショットを含む毎日のマーケット・アップデートをご覧 ください! FX Power MT5 NGは 、長年の人気を誇る通貨強度計FX Powerの次世代モデルです。 この次世代ストレングスメーターは何を提供するのでしょうか?初代FXパワーの魅力すべて プラス GOLD/XAUの強さ分析 より正確な計算結果 個別に設定可能な分析期間 カスタマイズ可能な計算上限値により、さらに優れたパフォーマンスを実現 もっと見たい人のための特別なマルチインスタンス設定 すべてのチャートでお好みの色を無限に設定可能 数え切れないほどの通知オプションにより、重要なことを見逃すことはありません。 Windows 11とmacOSのスタイルで角を丸くした新しいデザイン 魔法のように動くインジケーターパネル FXパワーの主な機能 すべての主要通貨の強さの完全な履歴 すべての時間枠における通貨の強さの履歴 すべてのブローカーとチャートで同一の計算結果 100%信頼できるリアルタイム計算 -> リペイントなし ドロップダウン・リストから
FX Volume MT5
Daniel Stein
4.94 (17)
mql5と Telegramの モーニング・ブリーフィングで、詳細とスクリーンショットを含む毎日のマーケット・アップデートをご覧 ください! FX Volumeは、ブローカーの視点から市場のセンチメントをリアルに洞察する、最初で唯一の出来高インジケーターです。 ブローカーのような機関投資家が外国為替市場でどのようなポジションをとっているか、COTレポートよりもはるかに速く、素晴らしい洞察を提供します。 この情報をチャート上で直接見ることは、あなたの取引にとって真のゲームチェンジャーであり、画期的なソリューションです。 以下のようなユニークなマーケットデータ洞察から利益を得てください。 比率は 、通貨のロングポジションとショートポジションの比率をパーセントで表示します。 比率の変化は 、選択した期間内のロング比率とその変化率を表示します。 Volumes Totalは 、通貨の取引量(ロングとショート)の合計をロット単位で表示します。 Volumes Long :全通貨のロングポジションの取引量を表示します。 Volumes(ショート )は、全通貨のショートポジションの取引量を表示
Step into the realm of Forex trading with confidence and precision using XQ, a cutting-edge Forex indicator designed to elevate your trading game to unprecedented heights. Whether you're a seasoned trader or just stepping into the world of currency exchange, XQ Forex Indicator empowers you with the insights and signals needed to make informed trading decisions. The signal conditions are a combination of three indicators, and XQ Forex Indicator only display  medium and long-term trends . The ind
このダッシュボードは、選択されたシンボルの最新の利用可能なハーモニックパターンを表示するので、時間を節約し、より効率的に /   MT4バージョン 。 無料インジケーター:   Basic Harmonic Pattern インジケーター列 Symbol : 選択したシンボルが表示されます。 Trend :   強気または弱気 Pattern : パターンの種類(ガートレー、バタフライ、バット、カニ、サメ、サイファー、ABCD) Entry : エントリー価格 SL: ストップロス価格 TP1: 1回目の利食い価格 TP2: 2回目の利食い価格 TP3:   3回目の利食い価格 Current price :   現在値 Age (in bars):    最後に描画されたパターンの年齢 主な入力項目 Symbols:   "28 Major Currency Pairs "または "Selected Symbols "から選択。 Selected Symbols:   カンマで区切られた監視したいシンボル("EURUSD,GBPUSD,XAUUSD")。ブローカーが
note: this indicator is for METATRADER4, if you want the version for METATRADER5 this is the link:  https://www.mql5.com/it/market/product/108106 TRENDMAESTRO ver 2.4 TRENDMAESTRO recognizes a new TREND in the bud, he never makes mistakes. The certainty of identifying a new TREND is priceless. DESCRIPTION TRENDMAESTRO identifies a new TREND in the bud, this indicator examines the volatility, volumes and momentum to identify the moment in which there is an explosion of one or more of these data a
Gartley Hunter Multi - An indicator for searching for harmonic patterns simultaneously on dozens of trading instruments and on all possible timeframes. Manual (Be sure to read before purchasing) | Version for MT4 Advantages 1. Patterns: Gartley, Butterfly, Shark, Crab. Bat, Alternate Bat, Deep Crab, Cypher 2. Simultaneous search for patterns on dozens of trading instruments and on all possible timeframes 3. Search for patterns of all possible sizes. From the smallest to the largest 4. A
サポート線と抵抗線のプロットにうんざりしていませんか? サポートレジスタンス は、非常に興味深いひねりを加えてチャート内のサポートとレジスタンスラインを自動検出およびプロットするマルチタイムフレームインジケーターです。価格レベルは時間とともにテストされ、その重要性が高まるにつれて、ラインは太くなり、暗くなります。 [ インストールガイド | 更新ガイド | トラブルシューティング | よくある質問 | すべての製品 ] 一晩でテクニカル分析を強化 チャートを閲覧せずに重要な価格レベルを検出 一目ですべての価格レベルの相対的な強さを認識する すべての取引で最大30時間のプロットラインを節約 インジケーターは、すべての価格レベルの年齢を表示します インジケーターは再描画されていません 過去および現在の価格レベルは近接によって崩壊し、現在の市場行動に合わせて調整されます。動作は、必ずしもピークではない場所に線が引かれます。 価格レベルは、時間とともに拒否されるにつれて、より暗く、より広くなります ノイズを避けるために、重要でない価格レベルは定期的にクリアされます カスタマイズ可能な時間枠の
Matrix Arrow Indicator MT5
Juvenille Emperor Limited
5 (14)
マトリックスアローインジケーターMT5は、すべてのシンボル/商品(外国為替、商品、暗号通貨、インデックス、株式)で使用できる100%再描画されていないマルチタイムフレームインジケーターに続くユニークな10in1トレンドです。マトリックスアローインジケーターMT5は、初期段階で現在のトレンドを判断し、最大10の標準インジケーターから情報とデータを収集します。 平均方向移動指数(ADX) 商品チャネルインデックス(CCI) クラシック平研アシキャンドル 移動平均 移動平均収束発散(MACD) 相対活力指数(RVI) 相対力指数(RSI) 放物線SAR ストキャスティクス ウィリアムズのパーセント範囲 すべてのインジケーターが有効な買いまたは売りシグナルを与えると、対応する矢印がチャートに印刷され、次のろうそく/バーの開始時に強い上昇トレンド/下降トレンドを示します。ユーザーは、使用するインジケーターを選択し、各インジケーターのパラメーターを個別に調整できます。マトリックスアローインジケーターMT5は選択されたインディケーターからのみ情報を収集し、それらのデータのみに基づいてアローを印
The Volumebyprice.com Indicator for MetaTrader 5 features Volume Profile and Market Profile TPO (Time Price Opportunity). Volume and TPO histogram bar and line charts. Volume Footprint charts. TPO letter and block marker collapsed and split structure charts. Static, dynamic and flexible range segmentation and compositing methods with relative and absolute visualizations. Session hours filtering and segment concatenation with Market Watch and custom user specifications. Graphical layering, posit
Volatility Trend System - a trading system that gives signals for entries. The volatility system gives linear and point signals in the direction of the trend, as well as signals to exit it, without redrawing and delays. The trend indicator monitors the direction of the medium-term trend, shows the direction and its change. The signal indicator is based on changes in volatility and shows market entries. The indicator is equipped with several types of alerts. Can be applied to various trading in
Was: $299  Now: $99   Supply Demand uses previous price action to identify potential imbalances between buyers and sellers. The key is to identify the better odds zones, not just the untouched ones. Blahtech Supply Demand indicator delivers functionality previously unavailable on any trading platform. This 4-in-1 indicator not only highlights the higher probability zones using a multi-criteria strength engine, but also combines it with multi-timeframe trend analysis, previously confirmed swings
Gold TMAF MTF - これは最高の株式テクニカル指標です。指標のアルゴリズムは、資産の値動きを分析し、ボラティリティと潜在的なエントリーゾーンを反映しています。 最高の指標シグナル: - 売りの場合 = TMA2の赤い上限がTMA1の赤い上限の上にある場合 + 上記の赤いフラクタル指標 + 同じ方向に黄色のSRシグナル矢印。 - 買いの場合 = TMA2の青い下限線がTMA1の青い下限線より下にある場合 + 下からの青いフラクタル指標 + 同じ方向の水色のSRシグナル矢印。 このインディケータの利点 1. このインディケータは、高精度のシグナルを生成します。 2. 確定した矢印シグナルは再描画されませんが、フラクタルシグナルは半周期再描画されます。 3. どのブローカーのMetaTrader 5取引プラットフォームでも取引できます。 4. あらゆる資産(通貨、金属、暗号通貨、株式、指数など)を取引できます。 5. M30-H1タイムフレーム(中期取引)で取引するのがよい。 6. 各トレーダーがインディケータを自分用に簡単にカスタマイズできるよ
TPA True Price Action indicator reveals the true price action of the market makers through 100% non-repainting signals strictly at the close of a candle! TPA shows entries and re-entries, every time the bulls are definitely stronger than the bears and vice versa. Not to confuse with red/green candles. The shift of power gets confirmed at the earliest stage and is ONE exit strategy of several. There are available now two free parts of the TPA User Guide for our customers. The first "The Basics"
ご紹介     Quantum Breakout PRO は 、ブレイクアウト ゾーンの取引方法を変革する画期的な MQL5 インジケーターです。 13年以上の取引経験を持つ経験豊富なトレーダーのチームによって開発されました。     クォンタム ブレイクアウト プロ   は、革新的でダイナミックなブレイクアウト ゾーン戦略により、あなたのトレーディングの旅を新たな高みに押し上げるように設計されています。 クォンタム ブレイクアウト インジケーターは、5 つの利益ターゲット ゾーンを備えたブレイクアウト ゾーン上のシグナル矢印と、ブレイクアウト ボックスに基づいたストップロスの提案を提供します。 初心者トレーダーにもプロのトレーダーにも適しています。 量子EAチャネル:       ここをクリック 重要!購入後、インストールマニュアルを受け取るためにプライベートメッセージを送ってください。 推奨事項: 時間枠: M15 通貨ペア: GBPJPY、EURJPY、USDJPY、NZDUSD、XAUUSD アカウントの種類: ECN、Raw、またはス
Order Block Hunter MT5
Noha Mohamed Fathy Younes Badr
5 (1)
Order block hunter indicator is the best indicator for  hunt the order blocks that area where there has been a large concentration of limit orders waiting to be executed Order blocks are identified on a chart by observing previous price action and looking for areas where the price experienced significant movement or sudden changes in direction .This indicator does that for you by using very complicated codes and helps you to take the best areas To buy and sell because it make marks at the best a
Was: $249  Now: $99   Market Profile defines a number of day types that can help the trader to determine market behaviour. A key feature is the Value Area, representing the range of price action where 70% of trading took place. Understanding the Value Area can give traders valuable insight into market direction and establish the higher odds trade. It is an excellent addition to any system you may be using. Inspired by Jim Dalton’s book “Mind Over Markets”, this indicator is designed to suit the
If you want to find good trading opportunities, then you must trade near the Trend Line. This allows you to have a tighter         stop loss   on your trades — which improves your       risk to reward . But that’s not all… Because if you combine Trend Line with Support and Resistance, that’s where you find the best trading opportunities. Now you might wonder: “So when do I enter a trade?” Well, you can use reversal     candlestick patterns   (like the   Hammer, Bullish Engulfing, etc.) as your e
ゴールド ATR MTF - これは優良株のテクニカル指標です。 インジケーター ATR (Average True Range) のアルゴリズムは、資産価格の動きを分析し、指定された時間枠 (D1) の始値の指定されたパーセンテージ (%) で対応するレベルを描画することでボラティリティを反映します。 シンボルの価格変動方向のインジケーター (赤および/または青 D1 H4) および矢印シグナルは、快適で収益性の高い日中取引および/またはスキャルピングのための追加的かつ不可欠な補助です。 1 日あたりの利益は、外国為替シンボルの場合は 20 ピップスから、ゴールド シンボルの場合は 50 ピップスからです。 インジケーターの機能: これは、マジック、トレンド方向検出器、および快適で収益性の高い取引のための 2 つのトレンド矢印のブロックを備えたスーパー インジケーターです。 チャート上にブロックを切り替えるための赤いボタンが表示されます。 マジックはインジケーター設定で設定されているため、異なるブロックを表示する 2 つのチャートにインジケーターをインストールできます。
当社の革新的なベーシック・ローソク足パターン・ダッシュボードは、チャート上の有益なローソク足パターンを自動的に識別するために特別に設計されています。このダッシュボードは、リアルタイムで価格チャートをスキャンし、古典的なものから複雑なものまで、幅広いローソク足パターンを検出する高度なアルゴリズムを使用しています。さらに、検出されたパターンをさまざまな時間枠で視覚化できる使いやすいインターフェイスを備えており、十分な情報に基づいた意思決定を簡単に行うことができます /  MT4バージョン 無料インディケータ:   Basic Candlestick Patterns 含まれるハーモニック・パターン 強気パターン Hammer  Inverse hammer Bullish engulfing Morning star 3 White soldiers 弱気パターン Hanging man Shooting star Bearish engulfing Evening star 3 Black crows インジケーターの列 Symbol:   選択したシンボル
Elliot Waves Analyzer Pro calculates Elliot Waves to Help Identify Trend direction and Entry Levels. Mainly for Swing Trading Strategies. Usually one would open a Position in trend direction for Wave 3 or a Correction for Wave C . This Indicator draws Target Levels for the current and next wave. Most important Rules for Elliot Wave Analysis are verified by the Indicator.  The Pro version analyzes Multiple Timeframes and shows the Subwaves and Target-Levels.   For an Overview  " Elliot Waves Anal
Bill Williams Advanced is designed for automatic chart analysis using Bill Williams' "Profitunity" system. The indicator analyzes four timeframes at once. Manual (Be sure to read before purchasing) Advantages 1. Automatically analyzes the chart using the "Profitunity" system of Bill Williams. The found signals are placed in a table in the corner of the screen. 2. Equipped with a trend filter based on the Alligator indicator. Most of the system signals are recommended to be used only accordi
MT5 trend indicator with a probability of reaching a profit of 70-90%! Works without redrawing and delays. Trend Master PRO shows good results on all trading instruments: currencies, metals, indices, stocks, cryptocurrencies. Recommended timeframe: H1-H4. More information about the indicator is here :  https://www.mql5.com/en/blogs/post/744748 Recommendations for use Use automatic period detection           The main feature of the indicator is the self-optimization function.             Th
The indicator very accurately determines the levels of the possible end of the trend and profit fixing. The method of determining levels is based on the ideas of W.D.Gann, using an algorithm developed by his follower Kirill Borovsky. Extremely high reliability of reaching levels (according to K. Borovsky  - 80-90%) Indispensable for any trading strategy – every trader needs to determine the exit point from the market! Precisely determines targets on any timeframes and any instruments (forex, met
これはほぼ間違いなく、MetaTraderプラットフォームで見つけることができる最も完全な調和価格形成自動認識インジケーターです。 19種類のパターンを検出し、フィボナッチプロジェクションをあなたと同じように真剣に受け止め、潜在的逆転ゾーン(PRZ)を表示し、適切なストップロスとテイクプロフィットレベルを見つけます。 [ インストールガイド | 更新ガイド | トラブルシューティング | よくある質問 | すべての製品 ] 19の異なる調和価格形成を検出します プライマリ、派生および補完フィボナッチ投影(PRZ)をプロットします 過去の価格行動を評価し、過去のすべてのパターンを表示します この指標は、独自の品質とパフォーマンスを分析します 適切なストップロスとテイクプロフィットのレベルを表示します ブレイクアウトを使用して適切な取引を通知します すべてのパターン比をグラフにプロットします 電子メール/音声/視覚アラートを実装します スコット・M・カーニーの本に着想を得て、この指標は最も純粋で急を要するトレーダーのニーズを満たすように設計されています。ただし、トレードを
作者のその他のプロダクト
MT4.  Показывает процент коррекции цены к предыдущей волне, процент превышения цены над предыдущим пиком или впадиной волны. Помечает волны. Диапазон волн регулируется параметром на графике, путём ввода в поле цифры от 5 до 300. Рисует уровни Фибоначчи от вершин или впадин предыдущей волны, а так же в противоположную сторону от текущей вершины или впадины волны.
ProCanal
Uladzimir Izerski
4 (4)
MT4. Многофункциональный индикатор  автоматически определяет и рисует волновые каналы, а также линии поддержки и сопротивления. Показывает тренд младшего периода и границу пробоя старшего. Это не стандартный канал. Работает совершенно по новому принципу.  В алгоритм  построения канала заложен принцип закона золотого сечения. Работает на графиках любого инструмента. Для лучшего восприятия каналы окрашены в разные цвета. канал с синим фоном - основной вверх. канал с красный фоном - основной канал
MT5. Определяет торговые каналы   и флет  актуальные на текущий момент. Принцип построения канала основан на волновой теории поведения цены. Индивидуальная разработка. Канал можно рассматривать как тренд. С закрашенным фоном это основные импульсные каналы. Коррекционные каналы без фона. Границы пробитых каналов выделены трендовыми линиями. Они будут являться линиями поддержки и сопротивления.   Это не стандартные каналы. Они вычисляются по новому принципу. В алгоритм заложена закономерность пове
MT5. Распознаёт боковой тренд (флет) на ранней стадии и рисует его границы, на любом таймфрейме, на любом инструменте, до смены тенденции. Индикатор основан на анализе характеристик волн, заранее предупреждает о возможном боковом тренде (Flat). Вершины волн помечены   буквой с цифрой по моей разработанной волновой системе.  Индикатор   предскажет флет раньше чем мы его увидим на графике. Не требует сложной настройки параметров. Адаптирован под 2,4 и 3,5 знаковые котировки. При первой загрузке и
ProFlat
Uladzimir Izerski
5 (2)
MT4。平らな形成の始まり、その存在から完成までのこのチャネルの高さを示します。 インディケータは、フラット(横向きのトレンド)の可能性について事前に警告します。 チャートに表示される前にフラットを予測します。 横向きの傾向は、形成の初期段階で決定されます。 横向きのトレンド境界は緑色の長方形でマークされています。 指標は波の特性の分析に基づいています、 あらゆる時間枠、あらゆる機器で機能します。 チャートが開いている時間枠を分析します。 1つのチャートに2つのレベルが存在する可能性があります。 インジケーターの設定は必要ありません。 さらに、古典的なトレンドラインを描画します。 トレンドラインは、インジケーター設定で無効にすることができます。
ProZZcom
Uladzimir Izerski
4 (2)
Control over the indicator is performed by changing only one parameter directly on the chart. Innovative and precise algorithm for plotting the ZigZag peaks. The "ProZZcom" indicator plots a graphical layout, which allows to quickly find the points for accurate entries and for placing short stop orders. It also predicts a possible flat in the early stages, shows the trend direction and correction in the wave, draws the round levels, draws the Fibonacci level lines. The indicator works on any ins
Индикатор MT4  для профессионалов. Задача индикатора - определить будущее поведение цены. Он определяет и рисует на графике: вершины и низинки волн в выбранном диапазоне цен линии прогнозируемых каналов на которых задерживается цена зоны вероятного горизонтального канала( флета) уровни Фибоначчи уровни на круглых значениях цены уникальные линии по вершинам волн. процент коррекции или импульса текущей и предыдущей волны время до окончания текущего бара. Принцип работы основан на разработанной но
Graf Assistant
Uladzimir Izerski
5 (3)
Индикатор MT4 выполняет комплекс задач в одной программе. Предназначен для быстрого всестороннего графического анализа цены на финансовых рынках. Включает в себя функции построения различных трендовых линий, каналов, волн, свечей, уровней фибо, круглых уровней, ZZ. Определяет флет, волновые и канальные паттерны, процентное отношение коррекционных волн. Отсчитывает время до окончания текущего периода. Все функции включаются и выключаются кнопками на панели графика.  Выводить на экран можно как од
フィルタ:
レビューなし
レビューに返信
バージョン 1.1 2022.08.17
Исправлены ошибки.