Retracement Watcher
- インディケータ
- Christian Ricard
- バージョン: 1.0
- アクティベーション: 5
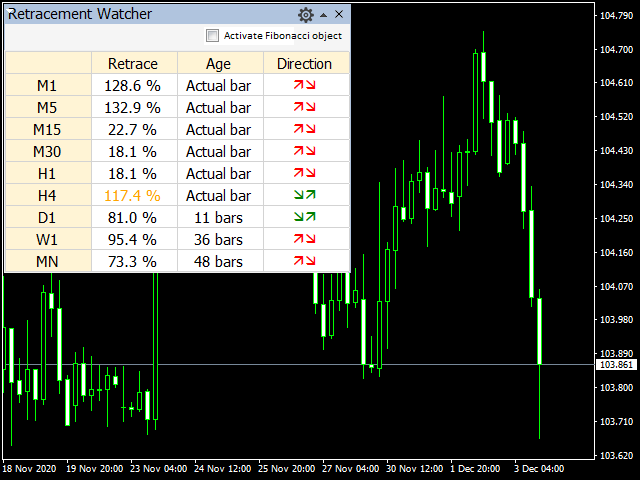
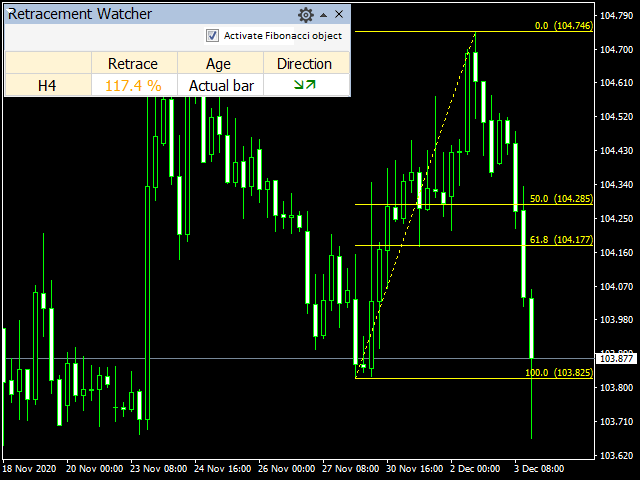
This indicator watch the Fibonacci retracement for levels and timeframes selected by the trader.
In the workload of day trading, having your eyes on all the timeframes to validate some information, for Fibonacci traders, is really time consuming and requires constant focus. With this in mind, this tool allows you to have your attention on other trading details while this one monitors the retracements of each timeframe in real time.
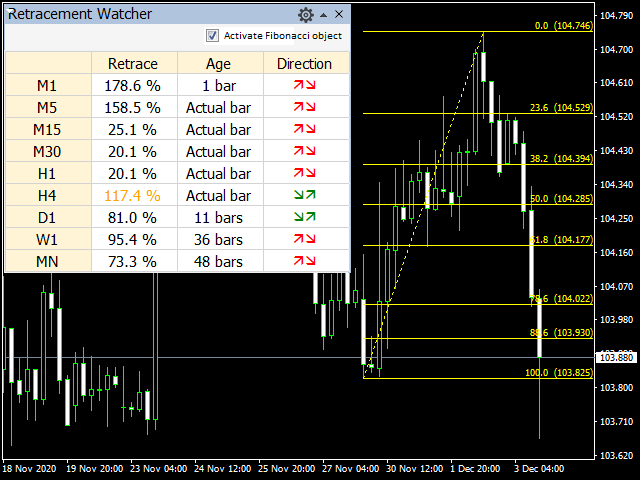
In the charts, this indicator data (retracement %, age of the retracement and direction of the possible rebound) is represented inside a panel who can be moved freely as needed. in addition, this one allow you to activate the Fibonacci tool with the selected levels and allows you to send alerts if desired. For more, the retracement number changes color when the price looks to be rejected by a selected level of a precise timeframe. The alerts/notifications are based on these events: 1) When price reach a selected level. 2) When then looks to be rejected by a selected level when time reach 75-90% of a precise timeframe. This tool is base on ZigZag indicator and the settings can be changed according to your needs.
This version include:
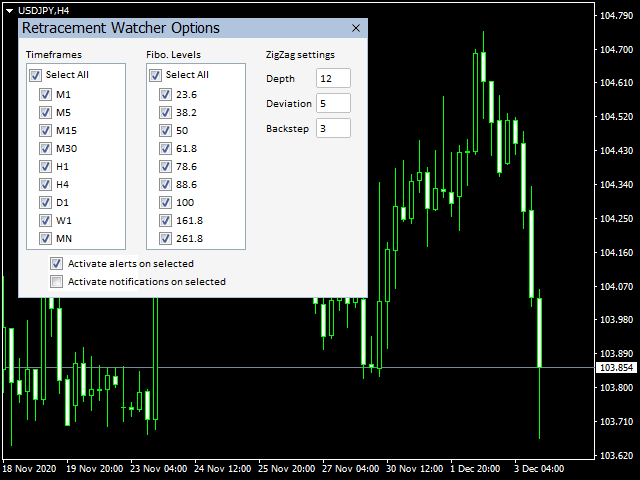
- Option panel for easy selections
- Possibility to enable/disable de Fibonacci tool from the panel
- Access the data of all desired timeframes at the same
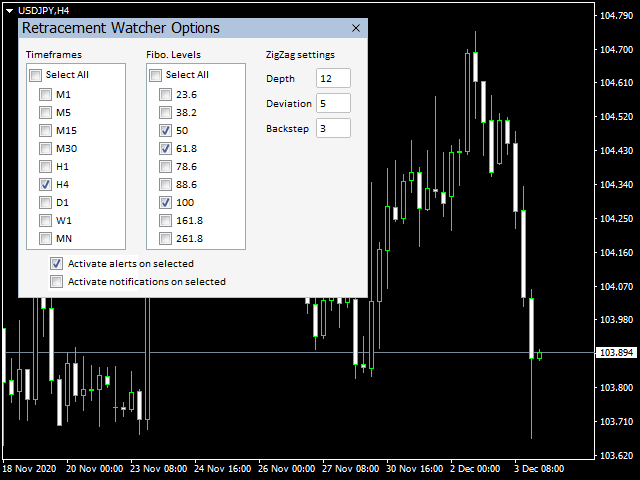
- Select the desired timeframes and Fibonacci levels
- Retracement % in real time
- Alerts and notifications if desire
Indicator Inputs:
- Fibonacci object color
- Possible rejection color
Options panel Inputs:
- Selection of timeframes
- Selection of Fibonacci levels
- ZigZag Depth, Deviation and Backstep
- Alert (on/off)
- Notifications (on/off)
*************************************************************
Hey traders!! Give me your feeds! We are a community here and we have the same objective.... make some money from the market. The more your feed me, the more I can respond on your needs.
Sincerely yours,
Chris
*************************************************************