• 概要
  • レビュー
  • コメント
  • 最新情報

RaptorT Cumulative and Cumulative Volume Delta

RaptorT: Cumulative Volume and Cumulative Volume Delta (Buying Selling Pressure)


Introduction

RaptorT CV & CVD (CVD is also known as Buying/selling Pressure or Book Pressure) offers two basic and meaningful indicators for trading having volumes as main index and weigh of the market interest. It gives good insights in combination with VWAP line and its four upper and lower standard deviations, developing PVP (Peak Volume Price, the equivalent of the POC for the old Market Profile), Volume Profile and Volume Profile Delta as well as standard RSI and MACD for divergences identification, oversold/oversell areas and other analysis. RaptorT CV & CVD are calculated from each single tick of the set period of time.

WARNING: since RaptorT CV & CVD uses rough data and the calculation is based on the detection and bufferization of each single tick and the related data, the user BEFORE downloading and install the indicator shall ensure under its responsibility that the broker and data feeder on which he/she is connected provides ticks data, direction (ask/bid) of the tick and volumes of the tick. In case real volumes are not available the indicator can work with volumes calculated on ticks counting as typical drawback. Besides, if the user desires to display the indicator on a past time range with respect the moment on which he started the MT5 application, for instance the past 24 hours, he/she must ensure that the broker and data feeder allow at downloading full past ticks data set.


RaptorT CV & CVD indicator characteristics

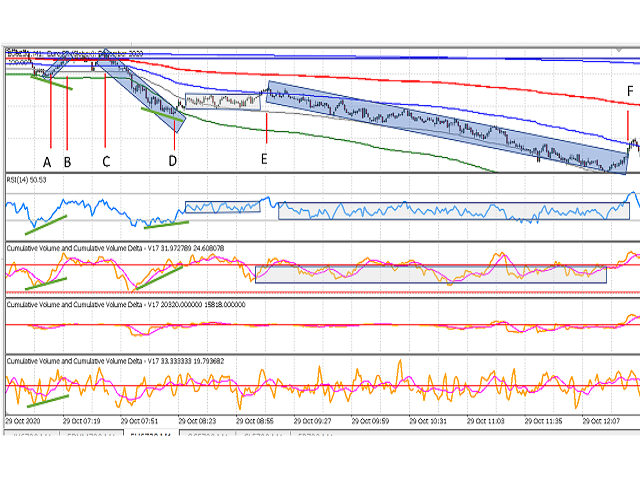
·       Cumulative Volume: the line is composed by dots representing the sum of the exchanged real or tick volumes in the last N seconds, where N is a parameter that the user can freely set. The mobile sum is useful to reduce local variations on the time dimension and to show the increasing and decreasing trend of exchanged volumes. The CV indicator allows also to show the average over M periods, where a period is equal to the candlestick selected timeframe. For instance, on M.1 timeframe, a CV with N=180s and with enabled average line on M=8 will show the sum of exchanged volumes over the last 180s, i.e. 3 candles, and the average of this line calculated over the last 8 line dots equal to the last 8 minutes. CV is always not negative; the lowest exchanged volume is 0.


·       Cumulative Volume Delta: the line is composed by the difference of ask volumes and bid volumes in the considered period. This indicator has a sign since could be negative or positive. Since the calculation considers the sum of the last N seconds, not necessarily equal to the CV one, what matter is the direction of the CVD indicator (increasing or decreasing) rather than its sign (negative or positive). Obviously, a positive sign over an increasing CVD trend is a further confirmation of possible increasing price trend because there are much more sellers in the market than buyers. Unidirectional trades (not buy, not ask, but ask/buy) are helved and summed to ask and bid volumes, so that making the difference they are neglected. The user can enable the average line that is calculated in the same way of the CV indicator. The user can choose three ways of calculation of the CVD indicator

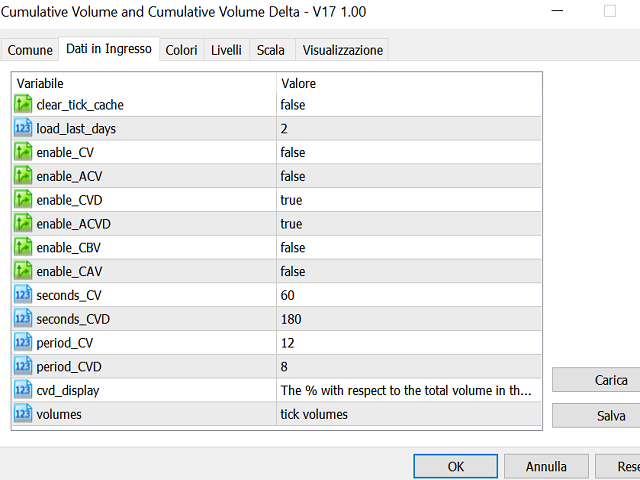
o   Actual: simply the difference of ask and bid volumes in the considered period of time.

o   Percentage: the difference is divided by the total volume and multiplied by 100. This amplify the CVD trend despite the total exchanged volumes. CVD curves are magnified.

o   Actual x Volume: this innovative way of visualization highlights strong trends toward ask or bid direction when they happen in combination with meaningful total traded volumes. If the total traded volume is low, the Actual x Volume line is compressed around the zero. The calculation of the CVD Actual is a bit different, on candlestick time slot and then summed, to overcome false directions that could happen with very high volumes traded.

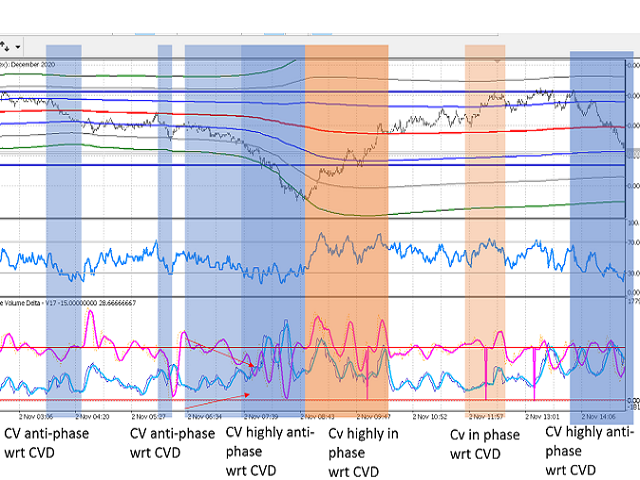
Important note: the trader uses these indicators over its own full responsibility knowing that the following observations could be not always true. The following observations are intended just to give an incipit for each trader exploration of its own way of CV & CVD usage. The traders are invited to share their experience of usage of this indicator for the knowledge growing of the whole traders community.


おすすめのプロダクト
Market Profile Introducing the Market Profile MetaTrader Indicator—your gateway to mastering market dynamics with precision and insight. This powerful tool delivers a classic Market Profile analysis, revealing price density over time and highlighting crucial levels, including the value area and control value for any trading session.  Compatible with timeframes from M1 to D1, it adapts to daily, weekly, monthly, or even intraday sessions, offering you unmatched flexibility. Lower timeframes pro
このインジケーターを使用すると、フィボナッチレベルのラベルを大きなフォントサイズで表示できます。 。 最大 25 のフィボナッチレベルをサポートします - フィボナッチを描画するとすぐに、入力パラメータとして追加したレベルが、選択した色とフォントの大きなフォント サイズで表示されます。 カスタマイズ可能なオプション: 1.フィボテキストフォント 2.フィボテキストサイズ 3.フィボテキストの色 3. 各レベルに説明を追加します 4. アンカーや度数などのその他のオプション このインジケーターを使用すると、フィボナッチレベルのラベルを大きなフォントサイズで表示できます。 。 最大 20 のフィボナッチレベルをサポートします - フィボナッチを描画するとすぐに、入力パラメータとして追加したレベルが、選択した色とフォントの大きなフォント サイズで表示されます。 カスタマイズ可能なオプション: 1.フィボテキストフォント 2.フィボテキストサイズ 3.フィボテキストの色 3. 各レベルに説明を追加しま
Candle EA MT5
Mansour Babasafary
4.37 (43)
This expert is based on patterns The main patterns of this specialist are candlestick patterns Detects trends with candlestick patterns It has a profit limit and a loss limit, so it has a low risk The best time frame to use this expert is M30 time frame The best currency pairs to use with this expert is the EURUSD, GBPUSD, AUDUSD, USDCAD currency pairs Attributes: Can be used in the EURUSD, GBPUSD, AUDUSD, USDCAD  currency pairs Can be used in M30, H1, H4 time frames Has profit limit an
This indicator allows you to enjoy the two most popular products for analyzing request volumes and market deals at a favorable price: Actual Depth of Market Chart Actual Tick Footprint Volume Chart This product combines the power of both indicators and is provided as a single file. The functionality of Actual COMBO Depth of Market AND Tick Volume Chart is fully identical to the original indicators. You will enjoy the power of these two products combined into the single super-indicator! Below is
Mean Reversion Supply Demand Indicator Mean Reversion Supply Demand is the indicator to detect the important supply demand zone in your chart. The concept of supply demand trading relies on the quantity mismatching between buying and selling volumes in the financial market. Typically, supply demand zone serves to predict the turning point. The wave pattern, for any supply demand zone to work as an successful trade, looks like the price must touch the base zone, move away and then return to zone
インディケータは現在のクオートを作成し、これを過去のものと比較して、これに基づいて価格変動予測を行います。インジケータには、目的の日付にすばやく移動するためのテキスト フィールドがあります。 オプション: シンボル - インジケーターが表示するシンボルの選択; SymbolPeriod - 指標がデータを取る期間の選択; IndicatorColor - インジケータの色; HorisontalShift - 指定されたバー数だけインディケータによって描画されたクオートのシフト; Inverse - true は引用符を逆にします。false - 元のビュー。 ChartVerticalShiftStep - チャートを垂直方向にシフトします (キーボードの上下矢印)。 次は日付を入力できるテキストフィールドの設定で、「Enter」を押すとすぐにジャンプできます。
Was: $249  Now: $99   Market Profile defines a number of day types that can help the trader to determine market behaviour. A key feature is the Value Area, representing the range of price action where 70% of trading took place. Understanding the Value Area can give traders valuable insight into market direction and establish the higher odds trade. It is an excellent addition to any system you may be using. Inspired by Jim Dalton’s book “Mind Over Markets”, this indicator is designed to suit the
The Market Structure Analyzer is a powerful tool designed for traders who follow market structure and smart money concepts. This comprehensive indicator provides a suite of features to assist in identifying key market levels, potential entry points, and areas of liquidity. Here's what it offers: 1. Swing High/Low Detection : Accurately identifies and marks swing highs and lows, providing a clear view of market structure. 2. Dynamic Supply and Demand Zones: Draws precise supply and demand zo
ICT Kill zone and Macros Indicator mark and display the following zone times on the chart: Kill zones   Kill zone Forex Asian London Open New York Open London Close Central Bank Dealing range Kill zone Indices Asian London Open New York AM New York Lunch New York PM Power Hour Macros London 1 London 2 New York Am 1 New York AM 2 New York Lunch New York PM 1 New York PM 2 Silver bullet London Open New York AM New York PM Sessions Asian London New York Chart The display of  Kill zone ,
AW Candle Patterns
AW Trading Software Limited
AWキャンドルパターンインジケーターは、強力なキャンドルパターンスキャナーと組み合わせた高度なトレンドインジケーターの組み合わせです。これは、最も信頼性の高い30のローソク足パターンを認識して強調表示するための便利なツールです。さらに、それは色付きのバーに基づく現在の傾向分析器です。     サイズ変更と配置が可能なプラグインマルチタイムフレームトレンドパネル。トレンドフィルタリングに応じてパターンの表示を調整する独自の機能。 利点: キャンドルパターンを簡単に識別 結果を再描画しません 内蔵のマルチタイムトレンドパネル 無効なパターンタイプ(1、2、3キャンドル) パターン表示時のトレンドフィルタリングの調整 MT4 version  表示されるパターンのリスト: ハンマーパターン ピンアップ/ピンダウン 弱気なハラミ/強気なハラミ 弱気のハラミクロス/強気のハラミクロス ピボットポイント反転アップ/ピボットポイント反転ダウン ダブルバーローとハイクローズ/ダブルバーローとロークローズ 終値反転アップ/終値反転ダウン ニュートラルバー/       2つのニュートラルバー ダブルイン
Welcome to the Ultimate Harmonic Patterns recognition indicator that is focused to detect advanced patterns. The Gartley pattern, Bat pattern, and Cypher pattern  are popular technical analysis tools used by traders to identify potential reversal points in the market. Our Ultimate Harmonic Patterns recognition Indicator is a powerful tool that uses advanced algorithms to scan the markets and identify these patterns in real-time. With our Ultimate Harmonic Patterns recognition Indicator, you
URガンマ (機械学習システムで見られる同様の計算を利用) UR Gamma は、従来の WaveTrend インジケーターを新しく改善したものを提供する最先端の財務分析ツールです。 高度なデジタル信号処理技術を組み込むことにより、UR Gamma は、従来の WaveTrend アルゴリズムの制限の一部に対処し、価格行動の傾向を特定および測定するためのより正確で堅牢で動的なアプローチを提供します。 UR ガンマを使用する利点: ミニマルなセットアップ すべてのデータはバックグラウンドで計算されており、ユーザー向けの出力は 1 つだけで、明確かつ適切です。 疲労を示唆する背景レベル あらゆる種類のアセットに調整されます。 ツールの最新情報を入手できる特別な電報チャットがあり、何か不足していると感じた場合はリクエストを送信することもできます! なぜURガンマ? 目標は、0 を中間点として、-1 と 1 の間で確率分布を振動させることです。 これを実現するために、アクティベーション関数と呼ばれる機械学習の手法を使用してデータを変換します。 そのような関数の 1 つ
どんなツール(シンボル)でも、グラフのどんな期間でも、買いと売りのフィボナッチレベルの自動的な作成とフォローアップ。 FiboPlus は、次のものを表示している: アップかダウン方向、 ありそうな 値動きのフィボナッチレベル。 エントリーポイントは「アップ矢印」、「ダウン矢印」アイコンで示され、情報はボタンにて再度表示されている。(SELL, BUY) 0から100までのレベルで限られた直角的エリア。トレードは、一つのレベルから他のレベルへ(トレンドなし)。 特長 値動きの予測、市場エントリーポイント、オーダーのための stop loss とtake profit。 作成済みのトレードシステム。 管理ボタンは、フィボナッチオプションの度リラかを選択できるようにする。 買いか売りのオプションを非表示にする。 グラフの他の期間を参照する。 「+」と「―」ボタンは、レベルの自動的再計算しながらグラフを大きく・小さくする。 何のフィボナッチレベルでも。 何の色でも表示。 ボタンをグラフの便利な場所に移動。 パラメーター Language (Russian, English, Deu
これは、フィボナッチから派生したハーモニックパターンのユーザーが利用できる最も完全なツールです。 完全にカスタマイズ可能:レベル、色、線種、太さ。 研究に応じて使用されるフィボナッチレベルを選択してください。 デフォルトでは、ツールには、尊重されることが証明されているフィボナッチレベルがすでにありますが、ユーザーはこれを自由に変更できます。 フィボナッチレベル、長方形(塗りつぶしありまたは塗りつぶしなし)、および境界のある水平線の描画方法の色、線種、太さを選択します。 フィボナッチ撤回:4セット(最大25レベル、最大26レベル、最大27レベル、最大28レベル)、それぞれ異なるショートカットで実行可能。 フィボナッチプロジェクション:最大10レベルの1セットで、特定のショートカットで実行できます。 長方形:長方形が自動的にプロットされる間隔を定義し、特定のショートカットで実行可能にします。 制限された水平線、特定のショートカットで実行可能。 ショートカットを修正しました:プロットされたすべてのオブジェクトを削除し、オブジェクトをさかのぼって削除し、長
This is a multi-symbol and multi-timeframe table-based indicator designed for a candlestick patterns detection with 46 patterns for META TRADER 5. Each formation has own image for easier recognition. Here you find most popular formations such as "Engulfing", "Hammer", "Three Line Strike", "Piercing" or Doji - like candles. Check my full list of patterns on my screenshots below. Also you can not only switch all bearish or bullish patterns from input, but also select formation for a specified symb
Mine Farm is one of the most classic and time-tested scalping strategies based on the breakdown of strong price levels. Mine Farm is the author's modification of the system for determining entry and exit points into the market... Mine Farm - is the combination of great potential with reliability and safety. Why Mine Farm?! - each order has a short dynamic Stop Loss - the advisor does not use any risky methods (averaging, martingale, grid, locking, etc.) - the advisor tries to get
Индикатор "Benefit Predictor" Это высокоточный инструмент для прогнозирования разворота цены на любом финансовом инструменте и любом таймфрейме. Этот продукт появился благодаря годам опыта и исследований в области анализа цен и других временных рядов, используя продвинутые методы машинного обучения и математического анализа. Особенности продукта : Готовая торговая система, подходит как для ручной торговли, так и для использования в торговых роботах. Не перерисовывается после появления сигна
指示する     ロシア     -        utilizar con   el indicador の ESP 推奨事項 -   TPSpro トレンド プロフェッショナル版 -   MT5のバージョン 最も重要なことは、将来においても最も重要なことです。 機能のプリンシパル: ゾーンのほとんどは、ベンダーとコンプラドールによってアクティブ化されます。 状況を直感的に把握できるよう、初期の衝動を修正します。 LOGIC AI: MUESTRA zonas (círculos) parabuscar puntos de entrada cuando se activa una plantilla 視覚的に優れた視覚効果があり、最も重要な機能がすべて揃っていることに注意してください。 優れたニベレス/ゾーンの視覚化 (modo MTF) 世界で最も人気のある場所/ゾーンです。これを使用するのに最適な方法です (   TPSproTREND PRO   )。 アルゴリズム プロフェッショナル セパラド パソ ア パソ パラ オペラ それは、オペラハウスやコントラ・デ・エラの指導におい
No Demand No Supply MT5
Trade The Volume Waves Single Member P.C.
No Demand No Supply   This indicator identifies   No Demand –No Supply candles to your chart and plots volume bars colored according to the signal. It can be applied to all timeframes or to a specific one only. It can also be used as regular volume indicator  with exceptional future of WEIGHTED VOLUME. Furthermore is has an alert notification, sound and email when a signals occurs. The indicator does not repaint but the alert will come on two candles back due to the definition of No Demand No Su
プレミアムレベルは、正しい予測の精度が80%を超える独自の指標です。 この指標は、最高のトレーディングスペシャリストによって2か月以上テストされています。 あなたが他のどこにも見つけられない作者の指標! スクリーンショットから、このツールの正確さを自分で確認できます。 1は、1キャンドルの有効期限を持つバイナリーオプションの取引に最適です。 2はすべての通貨ペア、株式、商品、暗号通貨で機能します 手順: 赤い矢印が表示されたらすぐにダウントレードを開き、青い矢印が表示されたら閉じます。青い矢印の後に開くこともできます。 試してテストしてください!推奨設定はデフォルトです! 日足チャートで最高の精度を示します! インディケータは、2600 Pipsの収益性に対して、約10Pipsという非常に小さなマージンを使用します。
To get access to MT4 version please click here . This is the exact conversion from TradingView: "[SHK] Schaff Trend Cycle (STC)" by "shayankm". This is a light-load processing indicator. This is a non-repaint indicator. Buffers are available for processing in EAs. All input fields are available. You can message in private chat for further changes you need. Thanks for downloading
123パターン は、最も人気のある強力で柔軟なチャートパターンの1つです。このパターンは、3つの価格ポイントで構成されています。ボトム、ピークまたはバレー、および38.2%〜71.8%のフィボナッチリトレースメントです。パターンは、価格が最後のピークまたは谷、インディケーターが矢印をプロットし、アラートを上昇させ、取引を行うことができる瞬間を超えたときに有効と見なされます。 [ インストールガイド | 更新ガイド | トラブルシューティング | よくある質問 | すべての製品 ] クリアな取引シグナル カスタマイズ可能な色とサイズ パフォーマンス統計を実装します カスタマイズ可能なフィボナッチリトレースメントレベル 適切なストップロスおよび利益レベルを表示します インジケーターを使用して、継続パターンまたは反転パターンを見つけることができます 再描画および非再描画ではありません 電子メール/音声/視覚アラートを実装します 123パターン は、継続パターンまたは反転パターンとして現れます。物事を簡単にするために、このインジケーターを使用して、検索するパターンのタイプを選択でき
Fibonacci theft is an ultrascalping system that uses Fibonacci levels to launch a scalping system that allows theft   a few pips from the market. This system allows the use of fibonacci levels, predetermined levels or a level chosen by the user. It also presents the option of using or not volume and impulse filters. Being a very aggressive scalping system, it should only be used in pairs with a low spread and low commissions. This system is suitable for small accounts and can be used with onl
IceFX VelocityMeter Mini is a very unique indicator on MetaTrader 4 platform which measures the speed of the Forex market . It is not a normal volume or other measurement indicator because IceFX VelocityMeter Mini is capable to understand market speed movements which are hidden in ticks and those valuable information cannot be read in an ordinary way from the candles. The software monitors the received ticks (frequency, magnitude of change) within a specified time range, analyzes these info and
無限からの通貨の強さを測定するためのこの革新的な指標は、長い間取引されているダフ屋やトレーダーにとって不可欠な助手です。 通貨の強さ/弱さを分析するためのシステムは、世界の主要なトレーダーによって市場で長い間知られており、使用されてきました。 任意の裁定取引は、この分析なしでは完全ではありません。 私たちの指標は、互いに関連して基本通貨の強さを簡単に決定します。 これは、インスタント分析を可能にし、最強のエントリポイントを検索し、すべてまたは現在の通貨ペアの折れ線グラフが表示されます。 インジケータは直感的で、すぐに見つけて任意のペアに切り替えることができ、地下室とメインチャートの両方に配置できるモバイルパネルがあります。 通貨の強さの変化の通知のタイマーモードは、トレーダーに電話で通知を受け取る機会を与えます。  通貨パワーメーターインフィニティ指標を使用するためのいくつかの戦略: 1. 通貨の強さの線形表示のチャートを使用して、交差点を新興トレンドの信号として検索します 2. トレンド反転信号が表示された後、強い通貨の方向に頭皮 3. 通貨の強さの発散分析を使用して、
The Volume by Price Indicator for MetaTrader 5 features Volume Profile and Market Profile TPO (Time Price Opportunity). Volume and TPO histogram bar and line charts. Volume Footprint charts. TPO letter and block marker collapsed and split structure charts. Static, dynamic and flexible range segmentation and compositing methods with relative and absolute visualizations. Session hours filtering and segment concatenation with Market Watch and custom user specifications. Graphical layering, positio
More stable MetaTrader 4 version is available here:  Lot Calculator Tool . This tool helps you to automatically calculate and manage risk, conveniently place orders visually, schedule orders, trail stops, move them to break-even and more. Features Place market or pending orders using draggable lines Schedule orders Calculate and limit risk using various methods See current spread See time till next candle Set custom order comments Trail stops Move stops to break-even See order profit/loss in
Was: $299  Now: $99   Supply Demand uses previous price action to identify potential imbalances between buyers and sellers. The key is to identify the better odds zones, not just the untouched ones. Blahtech Supply Demand indicator delivers functionality previously unavailable on any trading platform. This 4-in-1 indicator not only highlights the higher probability zones using a multi-criteria strength engine, but also combines it with multi-timeframe trend analysis, previously confirmed swings
Description: The Volume Profile displays detailed informations of historical trading activities at certain price levels (Market Profile). Locate the areas with the best prices in the market and get an advantage over other market participants. Features: Customizable Market Profile Shows the "fair" Value Area with 70% of all Volume Shows critical low volume zones Shows VPOC, VAL and VAH Points integrated resource management to reduce the load while working with multiple charts Works on all tim
Auto Fib Retracements
Ross Adam Langlands Nelson
4.2 (5)
Automatic Fibonacci Retracement Line Indicator. This indicator takes the current trend and if possible draws Fibonacci retracement lines from the swing until the current price. The Fibonacci levels used are: 0%, 23.6%, 38.2%, 50%, 61.8%, 76.4%, 100%. This indicator works for all charts over all timeframes. The Fibonacci levels are also recorded in buffers for use by other trading bots. Any comments, concerns or additional feature requirements are welcome and will be addressed promptly. 
FREE
このプロダクトを購入した人は以下も購入しています
TPSpro TREND PRO は 、市場を自動的に分析し、トレンドとその各変化に関する情報を提供し、再描画せずに取引にエントリーするためのシグナルを提供するトレンド指標です。 インジケーターは各ローソク足を使用し、個別に分析します。上向きまたは下向きのさまざまな衝撃を指します。通貨、仮想通貨、金属、株、指数の取引への正確なエントリーポイント! バージョンMT5                   インジケーターの完全な説明     RFI LEVELS インジケーター と併用することをお勧めします。 主な機能: レンダリングなしで正確な入力信号! シグナルが表示されると、それは関連性を維持します。これは、シグナルを提供してからそれを変更し、その結果、入金された資金が失われる可能性があるリドローインジケーターとの重要な違いです。より高い確率と精度で市場に参入できるようになりました。矢印が表示された後、ターゲットに到達する (利益確定) か反転シグナルが表示されるまで、ローソク足に色を付ける機能もあります。 STOP-LOSS/TAKE-PROFITゾーンの表示 エントリーポイン
まず第一に、このトレーディングシステムがノンリペイント、ノンリドロー、ノンラグのインジケーターであることを強調する価値がある。これにより、手動取引とロボット取引の両方に理想的なものになっています。 オンラインコース、マニュアル、プリセットのダウンロード。 「スマートトレンドトレーディングシステム MT5」は、新規および経験豊富なトレーダー向けにカスタマイズされた包括的なトレーディングソリューションです。10以上のプレミアムインジケーターを組み合わせ、7つ以上の堅実なトレーディング戦略を備えており、多様な市場状況に対応する多目的な選択肢となっています。 トレンドフォロー戦略:トレンドを効果的に乗り越えるための正確なエントリーとストップロス管理を提供します。 リバーサル戦略:潜在的なトレンドの反転を特定し、トレーダーがレンジ相場を活用できるようにします。 スキャルピング戦略:高速で正確なデイトレードおよび短期取引のために設計されています。 安定性:すべてのインジケーターはノンリペイント、ノンリドロー、ノンラグであり、信頼性の高いシグナルを保証します。 カスタマイズ:個々の取引の嗜好に合わせ
まず第一に、この取引インジケーターは再描画されず、再描画されず、遅延しないことを強調する価値があります。これにより、手動取引とロボット取引の両方に理想的なものになります。 ユーザーマニュアル:設定、入力、戦略。 アトミックアナリストは、価格の強さとモメンタムを利用して市場でより良いエッジを見つけるためのPA価格アクションインジケーターです。ノイズや誤ったシグナルを除去し、取引ポテンシャルを高めるための高度なフィルターを備えています。複雑なインジケーターの複数のレイヤーを使用して、アトミックアナリストはチャートをスキャンし、複雑な数学的計算をシンプルなシグナルと色に変換します。これにより、どのような初心者トレーダーでも理解して使用し、一貫した取引の決定を行うことができます。 「アトミックアナリスト」は、新規および経験豊富なトレーダー向けにカスタマイズされた包括的な取引ソリューションです。プレミアムインジケーターとトップノッチの機能を1つの取引戦略に組み合わせ、すべてのタイプのトレーダーにとって汎用性のある選択肢にします。 デイリートレーディングとスキャルピング戦略:高速で正確な
Gold Stuff mt5
Vasiliy Strukov
4.92 (167)
Gold Stuff mt5 は、金専用に設計されたトレンド指標であり、あらゆる金融商品にも使用できます。 インジケーターは再描画せず、遅れません。 推奨時間枠 H1. 設定と個人的なボーナスを得るために、購入後すぐに私に連絡してください!  トレンド スキャナーの強力なサポートを利用して、無料のインジケーターを入手し、プライバシーを守ります。あーみー!   設定 矢印を描く - オンオフ。 チャートに矢印を描く。 アラート - 可聴アラートのオンオフ。 メール通知 - オンオフ。 電子メール通知。 プチ通知 - オンオフ。 プッシュ通知。 次に、色域を調整します。 Gold Stuff mt5 は、金専用に設計されたトレンド指標であり、あらゆる金融商品にも使用できます。 インジケーターは再描画せず、遅れません。 推奨時間枠 H1. 設定と個人的なボーナスを得るために、購入後すぐに私に連絡してください!   設定 矢印を描く - オンオフ。 チャートに矢印を描く。 アラート - 可聴アラートのオンオフ。 メール通知 - オンオフ。 電子メール通知。 プチ通
Quantum Trend Sniper
Bogdan Ion Puscasu
4.8 (49)
ご紹介   クォンタム トレンド スナイパー インジケーターは 、トレンド反転を特定して取引する方法を変革する画期的な MQL5 インジケーターです。 13年以上の取引経験を持つ経験豊富なトレーダーのチームによって開発されました。     クォンタムトレンドスナイパーインジケーター   は、非常に高い精度でトレンドの反転を識別する革新的な方法で、あなたのトレーディングの旅を新たな高みに押し上げるように設計されています。 ***Quantum Trend Sniper Indicatorを購入すると、Quantum Breakout Indicatorを無料で入手できます!*** クォンタム ブレイクアウト インジケーターは、トレンドの反転を特定するとアラートを発し、矢印を示し、3 つのテイクプロフィットレベルを提案します。 初心者トレーダーにもプロのトレーダーにも適しています。 量子EAチャネル:       ここをクリック MT4のバージョン:       ここをクリック 推奨事項: 期間:すべての時間枠。最良の結果を得るには、M
mql5と Telegramの モーニング・ブリーフィングで、詳細とスクリーンショットを含む毎日のマーケット・アップデートをご覧 ください! FX Power MT5 NGは 、長年の人気を誇る通貨強度計FX Powerの次世代モデルです。 この次世代ストレングスメーターは何を提供するのでしょうか?初代FXパワーの魅力すべて プラス GOLD/XAUの強さ分析 より正確な計算結果 個別に設定可能な分析期間 カスタマイズ可能な計算上限値により、さらに優れたパフォーマンスを実現 もっと見たい人のための特別なマルチインスタンス設定 すべてのチャートでお好みの色を無限に設定可能 数え切れないほどの通知オプションにより、重要なことを見逃すことはありません。 Windows 11とmacOSのスタイルで角を丸くした新しいデザイン 魔法のように動くインジケーターパネル FXパワーの主な機能 すべての主要通貨の強さの完全な履歴 すべての時間枠における通貨の強さの履歴 すべてのブローカーとチャートで同一の計算結果 100%信頼できるリアルタイム計算 -> リペイントなし ドロップダウン・リストから
WHY IS OUR FXACCCURATE LS MT5 THE PROFITABLE ? PROTECT YOUR CAPITAL WITH RISK MANAGEMENT Gives entry, stop and target levels from time to time. It finds Trading opportunities by analyzing what the price is doing during established trends. POWERFUL INDICATOR FOR A RELIABLE STRATEGIES We have made these indicators with a lot of years of hard work. It is made at a very advanced level. Established trends provide dozens of trading opportunities, but most trend indicators completely ignore them!
このダッシュボードは、選択されたシンボルの最新の利用可能なハーモニックパターンを表示するので、時間を節約し、より効率的に /   MT4バージョン 。 無料インジケーター:   Basic Harmonic Pattern インジケーター列 Symbol : 選択したシンボルが表示されます。 Trend :   強気または弱気 Pattern : パターンの種類(ガートレー、バタフライ、バット、カニ、サメ、サイファー、ABCD) Entry : エントリー価格 SL: ストップロス価格 TP1: 1回目の利食い価格 TP2: 2回目の利食い価格 TP3:   3回目の利食い価格 Current price :   現在値 Age (in bars):    最後に描画されたパターンの年齢 主な入力項目 Symbols:   "28 Major Currency Pairs "または "Selected Symbols "から選択。 Selected Symbols:   カンマで区切られた監視したいシンボル("EURUSD,GBPUSD,XAUUSD")。ブローカーが
まず第一に、この取引ツールはノンリペイント、ノンリドロー、ノンラグの指標であり、プロの取引に理想的ですことを強調する価値があります。 オンラインコース、ユーザーマニュアル、デモ。 スマートプライスアクションコンセプトインジケーターは、新米から経験豊富なトレーダーまで、非常 に強力なツールです。Inner Circle Trader AnalysisやSmart Money Concepts Trading Strategiesなど、20以上の有用な指標を1つに組み合わせています。このインジケーターはスマートマネーコンセプトに焦点を当て、大手機関の取引方法を提供し、彼らの動きを予測するのに役立ちます。 特に、流動性分析に優れており、機関がどのように取引しているかを理解しやすくしています。市場のトレンドを予測し、価格の動きを慎重に分析するのに優れています。機関の戦略とトレードを合わせることで、市場の動向についてより正確な予測ができます。このインジケーターは多目的であり、市場構造を分析し、重要な注文ブロックを特定し、さまざまなパターンを認識するのに優れています。 このインジ
スイングトレーディング は、トレンドの方向のスイングと可能な反転スイングを検出するように設計された最初のインジケーターです。トレーディングの文献で広く説明されているベースラインスイングトレーディングアプローチを使用します。インディケータは、いくつかの価格と時間のベクトルを調査して、全体的なトレンドの方向を追跡し、市場が売られ過ぎまたは買われ過ぎて修正の準備ができている状況を検出します。 [ インストールガイド | 更新ガイド | トラブルシューティング | よくある質問 | すべての製品 ] むち打ちを起こさずに市場スイングの利益 インジケーターは常にトレンドの方向を表示します 色付きの価格帯は機会のベースラインを表します 色付きのダッシュは、可能な反転スイングを表します この指標は、独自の品質とパフォーマンスを分析します 複数時間枠のダッシュボードを実装します カスタマイズ可能なトレンドおよびスイング期間 電子メール/サウンド/プッシュアラートを実装します インジケータは再描画またはバックペインティングではありません Swing Tradingとは Swing Tradi
これはMT5のインジケーターで、再描画なしで取引に参入するための正確なシグナルを提供します。 外国為替、暗号通貨、金属、株式、インデックスなど、あらゆる金融資産に適用できます。かなり正確な見積もりを提供し、取引を開始して終了するのに最適な時期を教えてくれます。1つのシグナルを処理しただけでインジケーターの元が取れた例の 動画 (6:22)をご覧ください。Entry PointsPro インジケーターの助けを借りたほとんどのトレーダーの最初の1週間の結果が改善しています。 Telegramグループ に登録してください。Entry Points Proインジケーターのメリットは次の通りです。 再描画のないエントリーシグナル 再描画されるインジケーターでは一度表示されたシグナルが削除されて大きな金銭的損失につながることがありますが、これと異なり、表示されて確認されたシグナルは消えることがありません。 エラーなしの取引開始 インジケーターアルゴリズムによって取引を開始する(資産を売買する)理想的な瞬間を見つけることができます。それを使用するすべてのトレーダーの成功率が向上します。
現在33%オフ 初心者にもエキスパートトレーダーにも最適なソリューション このインジケーターは独自の機能と新しい公式を多数内蔵しており、ユニークで高品質かつ手頃な取引ツールです。このアップデートでは、2つの時間枠ゾーンを表示できるようになります。より長いTFだけでなく、チャートTFとより長いTF(ネストゾーンを表示)の両方を表示できます。すべてのSupply Demandトレーダーの皆さんのお気に召すはずです。:) 重要情報の公開 Advanced Supply Demandの可能性を最大化するには、 https://www.mql5.com/ja/blogs/post/720245 にアクセスしてください。   エントリーまたはターゲットの正確なトリガーポイントを正確に特定できれば取引がどのように改善されるか想像してみてください。新しい基盤となるアルゴリズムに基づいて構築されているため、買い手と売り手の間の潜在的な不均衡をさらに簡単に特定できます。これは、最も強い需要と供給のゾーンと、過去のパフォーマンス(古いゾーンを表示)がグラフィカルに表現されるためです。これらの機能は、最適
WHY IS OUR FXACCCURATE TCT MT5 THE PROFITABLE ? Gives entry, stop and target levels from time to time. It finds Trading opportunities by analyzing what the price is doing during established trends. We have made these indicators with a lot of years of hard work. It is made at a very advanced level. Established trends provide dozens of trading opportunities, but most trend indicators completely ignore them! The trend reveals trading indicator represents an average of 10 different trades per trend
FX Volume MT5
Daniel Stein
4.93 (14)
mql5と Telegramの モーニング・ブリーフィングで、詳細とスクリーンショットを含む毎日のマーケット・アップデートをご覧 ください! FX Volumeは、ブローカーの視点から市場のセンチメントをリアルに洞察する、最初で唯一の出来高インジケーターです。 ブローカーのような機関投資家が外国為替市場でどのようなポジションをとっているか、COTレポートよりもはるかに速く、素晴らしい洞察を提供します。 この情報をチャート上で直接見ることは、あなたの取引にとって真のゲームチェンジャーであり、画期的なソリューションです。 以下のようなユニークなマーケットデータ洞察から利益を得てください。 比率は 、通貨のロングポジションとショートポジションの比率をパーセントで表示します。 比率の変化は 、選択した期間内のロング比率とその変化率を表示します。 Volumes Totalは 、通貨の取引量(ロングとショート)の合計をロット単位で表示します。 Volumes Long :全通貨のロングポジションの取引量を表示します。 Volumes(ショート )は、全通貨のショートポジションの取引量を表示
MetaForecast M5
Vahidreza Heidar Gholami
5 (2)
MetaForecastは、価格データのハーモニクスに基づいて、どんな市場の未来を予測し視覚化します。市場が常に予測可能ではありませんが、価格にパターンがある場合、MetaForecastは可能な限り正確な未来を予測できます。他の類似製品と比較して、MetaForecastは市場のトレンドを分析することでより正確な結果を生成することができます。 入力パラメータ Past size (過去のサイズ) MetaForecastが将来の予測を生成するために使用するバーの数を指定します。モデルは選択したバー上に描かれた黄色の線で表されます。 Future size (将来のサイズ) 予測すべき将来のバーの数を指定します。予測された将来は、ピンクの線で表示され、その上に青い回帰線が描かれます。 Degree (程度) この入力は、MetaForecastが市場で行う分析のレベルを決定します。 Degree 説明  0 Degree 0の場合、価格の全てのピークや谷、そして詳細をカバーするために、「Past size」の入力に大きな値を使用することが推奨されています。  1 (推奨) Degr
Gartley Hunter Multi - An indicator for searching for harmonic patterns simultaneously on dozens of trading instruments and on all possible timeframes. Manual (Be sure to read before purchasing) | Version for MT4 Advantages 1. Patterns: Gartley, Butterfly, Shark, Crab. Bat, Alternate Bat, Deep Crab, Cypher 2. Simultaneous search for patterns on dozens of trading instruments and on all possible timeframes 3. Search for patterns of all possible sizes. From the smallest to the largest 4. A
TPA True Price Action indicator reveals the true price action of the market makers through 100% non-repainting signals strictly at the close of a candle! TPA shows entries and re-entries, every time the bulls are definitely stronger than the bears and vice versa. Not to confuse with red/green candles. The shift of power gets confirmed at the earliest stage and is ONE exit strategy of several. There are available now two free parts of the TPA User Guide for our customers. The first "The Basics"
Golden Spikes Detector Acknowledgement and Dedications:  The name of this indicator was Inspired by an Original; Mr Grant Koopman; a Knowledgeable and experienced Synthetics trader. I dedicate this indicator to Mr Grant.  Overview: The Golden Spikes Premium is a groundbreaking trading indicator meticulously crafted for the Boom and Crash indices on the Deriv market. Tailored to meet the needs of discerning traders, this powerful tool operates exclusively on the one-minute timeframe, providin
The AT Forex Indicator MT5 is a sophisticated trading tool designed to provide traders with a comprehensive analysis of multiple currency pairs. This powerful indicator simplifies the complex nature of the forex market, making it accessible for both novice and experienced traders. AT Forex Indicator uses advanced algorithms to detect trends, patterns and is an essential tool for traders aiming to enhance their forex trading performance. With its robust features, ease of use, and reliable signal
note: this indicator is for METATRADER4, if you want the version for METATRADER5 this is the link:  https://www.mql5.com/it/market/product/108106 TRENDMAESTRO ver 2.4 TRENDMAESTRO recognizes a new TREND in the bud, he never makes mistakes. The certainty of identifying a new TREND is priceless. DESCRIPTION TRENDMAESTRO identifies a new TREND in the bud, this indicator examines the volatility, volumes and momentum to identify the moment in which there is an explosion of one or more of these data a
Matrix Arrow Indicator MT5
Juvenille Emperor Limited
5 (12)
マトリックスアローインジケーターMT5は、すべてのシンボル/商品(外国為替、商品、暗号通貨、インデックス、株式)で使用できる100%再描画されていないマルチタイムフレームインジケーターに続くユニークな10in1トレンドです。マトリックスアローインジケーターMT5は、初期段階で現在のトレンドを判断し、最大10の標準インジケーターから情報とデータを収集します。 平均方向移動指数(ADX) 商品チャネルインデックス(CCI) クラシック平研アシキャンドル 移動平均 移動平均収束発散(MACD) 相対活力指数(RVI) 相対力指数(RSI) 放物線SAR ストキャスティクス ウィリアムズのパーセント範囲 すべてのインジケーターが有効な買いまたは売りシグナルを与えると、対応する矢印がチャートに印刷され、次のろうそく/バーの開始時に強い上昇トレンド/下降トレンドを示します。ユーザーは、使用するインジケーターを選択し、各インジケーターのパラメーターを個別に調整できます。マトリックスアローインジケーターMT5は選択されたインディケーターからのみ情報を収集し、それらのデータのみに基づいてアローを印
The Trend Forecaster indicator utilizes a unique proprietary algorithm to determine entry points for a breakout trading strategy. The indicator identifies price clusters, analyzes price movement near levels, and provides a signal when the price breaks through a level. The Trend Forecaster indicator is suitable for all financial assets, including currencies (Forex), metals, stocks, indices, and cryptocurrencies. You can also adjust the indicator to work on any time frames, although it is recommen
このインディケータは、過去の価格行動を分析して市場の売買圧力を予測します。過去を振り返り、現在の価格周辺の価格のピークと谷を分析します。これは、最新の確認インジケータです。 [ インストールガイド | 更新ガイド | トラブルシューティング | よくある質問 | すべての製品 ] 市場での売買圧力を予測する フレンジーを売って買うことに巻き込まれないようにする 設定も最適化も不要 インジケーターはすべての時間枠で機能します 非常に使いやすい 潜在的な供給価格と需要価格は、多くの市場参加者が負けポジションを維持し、損益分岐点でそれらを清算することを望んでいる価格です。したがって、これらの価格レベルで大規模な活動があります。 需要と供給の両方が数値として定量化されます 供給が需要を上回る場合、販売圧力が予想されます 供給が需要を下回っている場合、購入圧力が予想されます 供給が需要を上回っている場合はショートを探してください 供給が需要を下回っている場合は、長期を探してください 入力パラメータ 範囲:過去のピークと谷を検索するための現在の価格のボラティリティ乗数。 著者 Ar
レンジと次の動きを特定     |    トレンドの最も早いシグナルと強さを得る     |    反転の前に明確な出口を得る     |    価格がテストするフィボ・レベルを見つける。   |  非リペイント、非遅延インディケータ - マニュアルおよび自動売買に最適 - すべての資産、すべての時間単位に対応 残り 5 部は $69   - 次は $99 購入後、あなたの 無料 TrendDECODER_Scannerを取得するために私に連絡してください。 MT4 バージョン: ここをクリック BladeSCALPER と PowerZONES を使った完全な方法を入手する どのようなものですか? TrendDECODERは、トレンド監視をシンプルかつ簡単にするための複数のイノベーションを集約したものです。 Projective TrendLine (投影トレンドライン) - 今後のトレンドのスピードリファレンス RealTime TrendLine vs. Projective TrendLine (リアルタイムトレンドライン vs. Projectiv
Introducing   Volume Orderflow Profile , a versatile tool designed to help traders visualize and understand the dynamics of buying and selling pressure within a specified lookback period. Perfect for those looking to gain deeper insights into volume-based market behavior! MT4 Version -  https://www.mql5.com/en/market/product/122656/ The indicator gathers data on high and low prices, along with buy and sell volumes, over a user-defined period. It calculates the maximum and minimum prices during t
ボリューム ブレイク オシレーターは、オシレーターの形で価格変動とボリューム トレンドを一致させるインジケーターです。 私はボリューム分析を戦略に統合したいと思っていましたが、OBV、マネー フロー インデックス、A/D、ボリューム加重 Macd など、ほとんどのボリューム インジケーターにいつもがっかりしていました。 そのため、このインジケーターを自分で作成し、その有用性に満足したので、市場に公開することにしました。 主な機能: ボリュームの増加 (ブレイク) によってサポートされる方向に価格が動くフェーズを強調します。 ボリュームの増加が止まり、市場が縮小するフェーズを強調します。 特に時間枠 (<=15 分) のデイトレードでは、価格もボリュームも動かないため、市場が将来の動きに備えられるフェーズを強調します。 ボリュームの増加によってサポートされていない場合、他のエキスパートアドバイザーからの偽のシグナルをフィルタリングします。 トレンドとレンジフェーズを非常に簡単に視覚化できます 入力パラメータ: 計算設定: 計算タイプ: FAST、NORMAL、S
AW Donchian Trend MT5
AW Trading Software Limited
5 (1)
AW Donchian Trend は、Donchian チャネルに基づくトレンド インジケーターです。このインジケーターは、TakeProfit レベルと StopLoss レベルを計算でき、シグナルの成功に関する高度な統計情報と、受信したシグナルに関する 3 種類の通知を備えています。 セットアップガイドと手順 - こちら     / MT4バージョン - こちら インジケーターを使った取引方法: AW Donchian Trend を使用した取引は、次の 3 つの簡単なステップで行えます。 ステップ1 - ポジションを開く M15時間枠で70%以上の成功率で買いシグナルを受信し、H1とD1でトレンドの方向を確認し、より高い時間枠でシグナルの方向とトレンドが一致したときにポジションを開きます。 ステップ2 - 定義       ストップロス     逆シグナルまたはストップロスレベルの動的計算によるストップロスの選択 ステップ3 - テイクプロフィット戦略の定義 戦略1: TP1に達したらポジション全体をクローズする 戦略2: TP1に到達したらポジションの50%をクローズし
Indicator for manual trading and technical analysis for Forex. It consists of a trend indicator with the opening level of the trading day and a arrow indicator for determining entry points. The indicator does not recolor; it works when the candle closes. Contains several types of alerts for signal arrows. Can be configured to work on any chart, trading instrument or time frame. The work strategy is based on searching for price movements along the trend.  To make " Buy " transactions
Introduction Harmonic Patterns are best used to predict potential turning point. Traditionally, Harmonic Pattern was identified manually connecting peaks and troughs points in the chart. Manual harmonic pattern detection is painfully tedious and not suitable for everyone. You are often exposed under subjective pattern identification with manual pattern detection. To avoid these limitations, Harmonic Pattern Plus was designed to automate your harmonic pattern detection process. The functionality
Renko is a well-known Japanese charting technique that removes time from the chart. Instead of drawing bars in constant intervals (time) as a normal chart would, a Renko chart does so only when price moves beyond a predefined amount. In a Renko chart, a bar is created when price exceeds the previous bar’s high or low by a predefined amount or what we call the Box Size. The result is a chart with equally sized bars running up or down in 45 degree angles. Such a chart offers the following advant
フィルタ:
レビューなし
レビューに返信
バージョン 1.1 2020.11.12
Issues fixing
- broken lines issue fixed
- discontinue minus infinite average lines issue fixed