• 概要
  • レビュー
  • コメント

Utam MTF Moving Average High Low Line

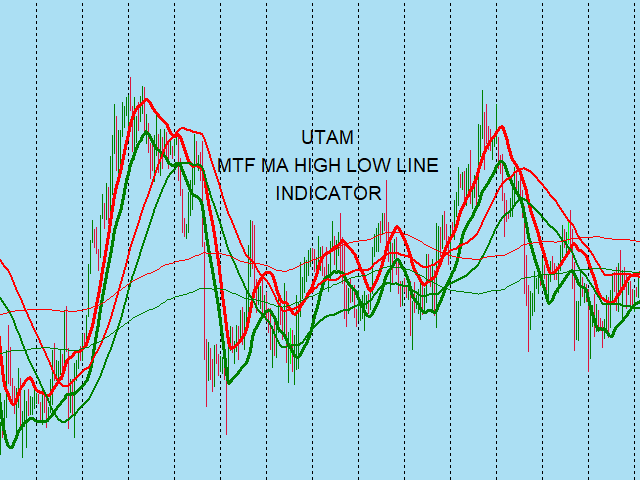
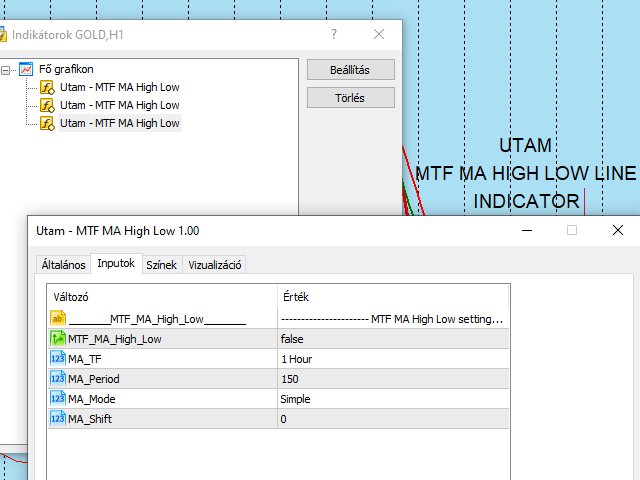
MTF Moving Average High Low line.

I use it in my MT5 and MT4 robots in the round.

Look at the robots and indicators I put up under my name.

Good luck trading! :)


MTF Moving Average (Mozgó Átlag) High (felső) Low (alsó) line (vonala).

MT5 és MT4 robotomban használom a fordulóban.

Nézd meg a nevem alatt milyen robotokat és indikátort raktam fel.

Sok sikert a kereskedéshez! :)


おすすめのプロダクト
This is an original, agile, and excellent trending system. Whether you are a beginner trading novice or a professional trader, this set of indicators can help you quickly and timely track the latest changes in market trends. It has the following characteristics: The method of use is extremely simple, plug and play, and the display of all trend analysis results is clear at a glance; There is no need to configure any functional parameters, the trend tracking indicator will automatically analyze th
Bolinger Professional Bands, Last indicator of the Safari Pack. in this last indicator we find a unique programming of bolinger bands where you can better catch the rebounds on the bands above and below, works for forex currency markets! synthetic index markets and also crypto! It works in all temporalities and all pairs! Good profit! World Inversor!!!!!
MT4版  |  FAQ Owl Smart Levels Indicator は、 Bill Williams の高度なフラクタル、市場の正しい波構造を構築する Valable ZigZag、エントリの正確なレベルをマークする Fibonacci レベルなどの一般的な市場分析ツールを含む 1 つのインジケーター内の完全な取引システムです。 利益を得るために市場と場所に。 戦略の詳細な説明 インジケータを操作するための指示 顧問-取引助手 プライベートユーザーチャット ->購入後に私に書いて、私はプライベートチャットにあなたを追加し、あなたはそこにすべてのボーナスをダウンロードすることができます 力はシンプルさにあります! Owl Smart Levels 取引システムは非常に使いやすいので、専門家にも、市場を勉強し始めて自分で取引戦略を選択し始めたばかりの人にも適しています。 戦略と指標に秘密の数式や計算方法が隠されているわけではなく、すべての戦略指標は公開されています。 Owl Smart Levels を使用すると、取引を開始するためのシグナルをすばやく確認し、注文を出すための
The Rise of Sky walker   is a trend indicator is a powerful indicator for any par and any timeframe. It doesn't requires any additional indicators for the trading setup.The indicator gives clear signals about opening and closing trades.This Indicator is a unique, high quality and affordable trading tool.  Can be used in combination with other indicators Perfect For New Traders And Expert Traders Low risk entries. Never repaints signal. Never backpaints signal. Never recalculates signal. Great Fo
Gator
Eric Mangeni Wakho
Introducing Gator Algo(Intelligent Algo) , an advanced Expert Advisor (EA) designed with a unique blend of Supply and Demand strategy to give you an edge in the market. It leverages the Hull and Stochastic Trend indicators for precision entries and exits. With built-in Telegram notifications, you'll stay informed on all trade actions in real-time. Gator Algo combines cutting-edge automation with a strategic approach that uses AI to help you maximize profits. Perfect for traders seeking a powerfu
Ichimoku Map (instant look at the markets) - built on the basis of the legendary Ichimoku Kinko Hyo indicator. The task of the Ichimoku Map is to provide information about the market strength on the selected time periods and instruments, from the point of view of the Ichimoku indicator. The indicator displays 7 degrees of buy signal strength and 7 degrees of sell signal strength. The stronger the trend, the brighter the signal rectangle in the table. The table can be dragged with the mouse. The
Manyal trading system, CovEchoTrend Robot, focuses on reliability and flexibility. By employing statistical analysis methods to study the relationships between the base indicator and market patterns, the system enables a deeper understanding of market processes. Intelligent pattern analysis: The application of statistical data processing helps identify key trend reversal points more accurately, signaling significant market shifts. Informed decision-making is based on the intersection of indicato
Didi Index Alert Plus Filter  Indicator developed by Brazilian and analyst Odir Aguiar (Didi), consists of "Moving Averages", known for the famous needles Didi, which allows the visualization of reversal points. The concept is very simple, when you insert 3 Moving Averages on display, one of three periods, an 8 and the other 20, there appears the formation of the indicator which works on an axis or center line 0. The needles occur when the intersection of averages comes closest to the line 0. W
概要 外国為替や金融市場では、迅速な反応と正確な意思決定が非常に重要です。しかし、標準のMetaTrader 5端末は最小でも1分のチャートしかサポートしておらず、トレーダーが市場の変動に敏感であることを制限しています。この問題を解決するために、 秒単位チャートキャンドルインジケーター を導入しました。このインジケーターを使用すれば、1秒から30秒の市場の動向をサブチャートで簡単に表示・分析できます。 主な機能 複数の秒単位タイムフレームのサポート :このインジケーターは、以下のタイムフレームを選択でき、さまざまな取引戦略に対応します: S1 : 1秒 S2 : 2秒 S3 : 3秒 S4 : 4秒 S5 : 5秒 S10 : 10秒 S15 : 15秒 S20 : 20秒 S30 : 30秒 リアルタイム更新 :秒単位チャートはリアルタイムで更新され、各瞬間に最新の市場情報を提供します。これにより、迅速な取引判断が可能になります。 ユーザーフレンドリーなインターフェース :インジケーターはサブチャートに表示され、直感的で使いやすいです。異なるタイムフレームに素早く切り替えて市場を迅速
MT5 EA trading system for BTCUSD T vack Beginners Use a brokerage firm with narrow spreads. trading style: Grid type time frame: 15min No indicators are needed on the chart. Known for its high trading direction analysis and high win rate using fundamental analysis It is a trading method that incorporates logic by combining half & half tralipi type EA. Half-and-half type holding long-term unrealized loss due to high price buying and bottom price selling,  which is a weak point of Tra
Noize Absorption Index - is the manual trading system that measures the difference of pressure between bears forces and bulls forces. Green line - is a noize free index that showing curent situation. Zero value of index shows totally choppy/flat market.Values above zero level shows how powerfull bullish wave is and values below zero measures bearish forces.Up arrow appears on bearish market when it's ready to reverse, dn arrow appears on weak bullish market, as a result of reverse expectation.
これはMACDに基づくトレンドフォローイングインディケーターで、200MAより上では買いのサイン、200MAより下では売りのサインを提供します。 MACDがゼロラインをクロスすると信号が生成されます。インディケーターはサポートとレジスタンスのレベルも表示し、これはストップロスとして使用できます。調整可能なパラメータにはMA期間、MACDの高速EMA、遅速EMA、サポートレジスタンスの間隔が含まれます。最近のローソク足の最低点と最高点にプロットされます。 デフォルトの設定: SR間隔:10 MA期間:200 Fast EMA:24 Slow EMA:26 アラーム機能も含まれています。 これらの値を変更すると、より頻繁または少ない信号が発生する可能性があり、最も効果的な構成を確定するためにテストすることが推奨されています。 1または4時間の時間枠が推奨されていますが、任意の時間枠で機能することができます。このインディケーターは、Forex、株式、商品などを含むすべての取引インストゥルメントで機能します。 他の製品もこちらでチェックしてください: https://www.mql5.com/
FREE
NET Z uses a very well-known trend reversal technique to determine position entry with slight modifications by using virtual trade techniques and virtual pending orders so that position entry is not too early or too late. Why NETZ? NET Z does not require complicated settings and is easy to use because user only need to upload a set file that is already available. Currently there are set files for 20 fx pairs. The best GRID EA with the ability to control risks. I will share my personal daily ro
移動平均線クロス、ボリンジャーと移動平均線のクロス、移動平均線の角度でサイン表示 MT5インジケータ こちらに サイト があります。 このインジケータは3つのパターンでサインを表示(切り替え可能)します。 ① 移動平均線のクロス ② ボリンジャーバンドと短期移動平均線とのクロス ③ ボリンジャーバンドと短期移動平均線とのクロスと、中期移動平均線と長期移動平均線の角度 ⓸ ボリンジャーバンドと短期移動平均線とのクロス(サインを交互に表示) 移動平均線のクロス 指定した短期移動平均線と長期移動平均線のゴールデンクロスでは買いサイン、デットクロスでは売りサインを表示します。 ディフォルトでは短期は5,長期は20となっています。 もちろん変更可能になります。 移動平均線の種類をEMA(指数平滑移動平均線)やSMMA(平滑化移動平均)などに変更可能で適する価格も変更可能になります。 ボリンジャーバンドと短期移動平均線のクロス ボリンジャーバンド(以降BB)と短期移動平均線のクロスでサインを表示します。 ディフォルトではBB+1σと5MAのゴールデンクロスで買いサイン、BB-1σと5MAのデット
MACD Alerts MT5
KEENBASE SOFTWARE SOLUTIONS
5 (1)
KT MACD Alerts is a personal implementation of the standard MACD indicator available in Metatrader. It provides alerts and also draws vertical lines for the below two events: When MACD crosses above the zero line. When MACD crosses below the zero line. Features It comes with an inbuilt MTF scanner, which shows the MACD direction on every time frame.  A perfect choice for traders who speculate the MACD crossovers above/below the zero line. Along with the alerts, it also draws the vertical lines
Indicator Description The indicator " TrendFusion " is designed for MetaTrader 5 and offers a comprehensive analysis by combining key technical indicators such as RSI, EMA, ATR, ADX, and MACD. It helps traders make informed decisions by visually representing these indicators and highlighting potential trading opportunities. This tool is especially useful for analyzing market dynamics across various assets, such as currency pairs or stocks. Functionality RSI (Relative Strength Index): Measures m
Please backtest with the exact balance of your live account before applying to real money. ==> If account balance is too low it may not trade at all! For MT4 version please contact via private message. martingale version is available here . Strategy description - Detect trend based on EMA18-EMA50-SMA200 alignment in three time frames: M15, H1, H4 - Trade in trend direction and exit when above alignment is broken. - The bot is tuned to trade XAUUSD(Gold). - The bot output is break even in rangin
FREE
Fibo Daily Channel Indicator The  Indicator is a powerful tool for traders, providing precise daily support and resistance levels based on Fibonacci retracement and extension calculations. This indicator automatically draws key pivot points (PP, R1, R2, S1, S2) as well as additional extension levels (R3, R4, S3, S4), helping traders identify potential reversal and breakout zones with ease. It includes customizable alerts and push notifications, allowing traders to receive updates whenever the pr
プレミアムレベルは、正しい予測の精度が80%を超える独自の指標です。 この指標は、最高のトレーディングスペシャリストによって2か月以上テストされています。 あなたが他のどこにも見つけられない作者の指標! スクリーンショットから、このツールの正確さを自分で確認できます。 1は、1キャンドルの有効期限を持つバイナリーオプションの取引に最適です。 2はすべての通貨ペア、株式、商品、暗号通貨で機能します 手順: 赤い矢印が表示されたらすぐにダウントレードを開き、青い矢印が表示されたら閉じます。青い矢印の後に開くこともできます。 試してテストしてください!推奨設定はデフォルトです! 日足チャートで最高の精度を示します! インディケータは、2600 Pipsの収益性に対して、約10Pipsという非常に小さなマージンを使用します。
多くの人が XAUUSD 取引を好みますが、私も例外ではありません。取引経験と努力を積んだ後、XAUUSD/XAUEUR/XAUGBP/XAUCHF /XAUJPY/XAUAUD などのすべての XAU 関連品種を取引するためにこの Apocalypse XAU EA を作成しました 。ただし、多くの人がすべての XAU 通貨ペアを取引する必要はなく、XAUUSD のみを取引する必要がある可能性があることを考慮すると、エントリーレベルの EA は非常に意味があります。そこで私は、XAUUSD 取引専用に設計された EA、Apocalypse Gold を作成することにしました。 信号表示およびディスカッショングループ: シグナル表示1:https:   //www.mql5.com/zh/signals/2223870 パラメータの設定方法がわからない場合、またはその他の質問がある場合は、ここをクリックしてください。     ここをクリック 99.9% の品質の履歴データのバックテスト、   2018 ~ 2024 年、ロットを修正 。 次の価格は799ドルです! 一度に 1 つの注
Flow Bookmap
Thalles Nascimento De Carvalho
Flow Bookmap: 市場のフローを視覚化し、あなたの取引を守る ️ 買い手と売り手に関する正確な情報で市場を支配したいですか? Flow Bookmapは、市場の動向を深く理解したいトレーダーのための究極のツールです。注文フローのデータをMT5チャートの直感的なインターフェースに変換し、迅速で安全な意思決定のために重要な関心領域を強調表示します。 仕組み Flow Bookmapは、市場での買い手と売り手の相互作用を解釈し、重要な不均衡(imbalances)を強調表示します: 買い手が支配的な場合、売り手がより有利な条件で価格を調整できるため、価格は下がる傾向があります。 売り手が支配的な場合、価格は反対の論理で上昇する傾向があります。 さらに、このインジケーターはリアルタイムでデータを収集しながら、グラフに直接情報をプロットします。つまり、インジケーターは計算が終了するにつれて、不均衡ゾーンや買い手と売り手の相互作用を構築し、発生している市場の状態を動的かつ正確に視覚化します。大きな関心を持つ価格帯は、グラフ上の防御ゾーンとして機能し、取引を保護します。
インジケーターについて このインジケーターは、金融商品の終値に対するモンテカルロシミュレーションに基づいています。モンテカルロ法とは、以前の観測結果に基づくランダムな数値を使用して、さまざまな結果の確率をモデル化するための統計的手法です。 どのように機能しますか? このインジケーターは、歴史的データに基づき、時間の経過とともにランダムに価格が変動する複数の価格シナリオを生成します。各シミュレーション試行は、 終値 の変動を考慮するためのランダム変数を使用し、与えられた期間における将来の市場変動を効果的に模倣します。 モンテカルロシミュレーションの利点 - モンテカルロシミュレーションは、複数の将来のシナリオに対して戦略をテストすることで、さまざまなトレード戦略のリスクを分析するのに役立ちます。 - 稀な極端なイベント(テールリスク)を含むさまざまな市場状況で戦略のパフォーマンスを把握することができます。 - 単一の予測に依存するのではなく、モンテカルロ法は関連する確率を伴う潜在的な結果の範囲を提供します。これにより、利益や損失の可能性を理解するのに役立ちます。 モンテカルロ法は、
Pick and Roll   it is a Secure Automated Software for trade 28 pairs ​​simultaneously. P ick and Roll It is optimized for 28 pairs of forex market Pick and Roll  system operation: 1: PREVIOUS   TREND 2: CONSOLIDATION 3:   RUPTURE D o not use this robot at the same time as others, it is a multi-value robot, therefore it manages 28 pairs simultaneously. The architecture is a Fully Automatic Autonomous Robot Expert capable of independently analyzing the market and making trading decisions     
Floating peaks oscillator - it the manual trading system. It's based on Stochastik/RSI type of oscillator with dynamic/floating  overbought and oversold levels. When main line is green - market is under bullish pressure, when main line is red - market is under bearish pressure. Buy arrow appears at the floating bottom and sell arrow appears at floating top. Indicator allows to reverse signal types. Main indicator's adjustable inputs : mainTrendPeriod; signalTrendPeriod; smoothedTrendPeriod; tre
Introducing Telos Dashboard Indicator – Your Ultimate Trading Companion Optimized For Forex! Note: This is a dashboard and won't work on the strategy tester, demoing it there is a waste. Instead get the main indicator or, use the demo of DynamicCOG to see how it works with arrows, though Telos is more refined and filtered than the DynamicCOG indicator.  Never Miss a Trading Opportunity Again! Welcome to the future of trading with the   Telos Dashboard Indicator ! Inspired by the highly accurate
SilverPulse AI
Babak Alamdar
3.93 (14)
新しい商品で取引を多様化すると、ポートフォリオがより強力になります    Live Signal 1    Live Signal 2 この価格はプロモーション期間中の一時的なもので、間もなく値上げされます 最終価格: 5000 $ 現在の価格では残りわずかです。次の価格は -->> 745 $  Welcome to the SiverPulse AI Hey, I'm SilverPulse AI! これは、Silver または XAG を XAGUSD、XAGEUR、XAGAUD などの完全なペアで取引する最初の最もスマートなロボットです。 私は毎日ニュースをチェックし、技術的、基本的、感情的な裏付けが得られる機会はすべて利用します。せっかちなトレーダーのポケットから患者のポケットにお金が落ちます! この市場では、賢い人々と競争することになります。彼らはあなたのお金を手に入れようとしており、あなたも彼らのお金を手に入れようとしています。最も正確で積極的な市場分析を使って、頑張ります!あなたの幸運を祈ります! Highlights: シンプルで使いやすい:各シンボルチャ
BeST_Breakout Strategy MT5 is an Metatrader Indicator based on a proprietary algorithm implementing a very powerful tool that can exploit every breakout leading to huge market movements.It timely locates the most likely points for Entering the Market as well as the most suitable Exit points and can be used successfully as a standalone Trading System which performance is often accompanied by very impressive statistics of % Success Ratio and Profit Factor .  The BeST_Breakout Strategy is a non-rep
This indicator is based on a mathematical formula which gives you the possibility to seek and find the right frequency of the movement, and to determine its key level; just adjust the frequency parameter! Simple and highly effective; using this indicator you can easily predict the next support and  resistance    levels of the day. Also, this indicator determines the range and the next two importants levels of the movement outside this range so far. SGFL3 and RGFL3  are levels with high certainty
数列の一つに「森林火災数列」があります。これは、最も美しい新しいシーケンスの 1 つとして認識されています。その主な特徴は、このシーケンスが線形トレンドを回避することです。最短のものであってもです。この指標の基礎を形成したのはこのプロパティです。 財務時系列を分析する場合、この指標は可能なすべての傾向オプションを拒否しようとします。そして失敗した場合にのみ、トレンドの存在を認識し、適切なシグナルを発します。このアプローチにより、新しいトレンドの始まりの瞬間を正しく判断できます。ただし、偽陽性の可能性もあります。それらの数を減らすために、このインジケーターに追加のフィルターが追加されました。新しいバーが開くとシグナルが生成されます。いずれの場合も再描画は発生しません。 指標パラメータ: Applied Price   - 適用価格定数; Period Main   - インディケータのメイン期間、その有効な値は 5 ~ 60 です。 Period Additional   - 追加の期間。このパラメーターの有効な値は 5 ~ 40 です。 Signal Filter   - 追加の信号
DESCRIPTION The EasyFollowerTrader-Bot3-DayTrade indicator only trades with the trend. Thus, the indicator will, at first, observe the trend of three averages synchronous with the selected time-frame. Then the indicator observes the trend of the daily chart. When these two charts are moving in the same direction, we have the highest probability of winnings. We will call this region the region of high probability of gain. In the region of high probability of gain, the indicator will indicate t
このプロダクトを購入した人は以下も購入しています
トレンド スクリーナー インジケーターでトレンド取引の力を解き放ちます。ファジー ロジックと複数通貨システムを活用した究極のトレンド取引ソリューションです。 ファジー ロジックを活用した革新的なトレンド インジケーターである Trend Screener を使用して、トレンド取引を向上させます。 これは、13 を超えるプレミアム ツールと機能、および 3 つの取引戦略を組み合わせた強力なトレンド追跡インジケーターであり、Metatrader をトレンド アナライザーにする多用途の選択肢となります。 期間限定オファー : トレンド スクリーナー インジケーターは、わずか 100 ドルで生涯ご利用いただけます。 (元の価格 50$ ) (オファー延長) Trend Screener の 100% 非再描画精度の揺るぎない精度を体験して、取引の決定が過去の価格変動の影響を受けないようにしてください。 マルチタイムフレームおよびマルチ通貨機能の多用途性を解放し、比類のない自信を持って外国為替、商品、暗号通貨、インデックスの世界を取引できるようにします。 Trend Screener の包括的な
Golden Trend Indicator MT5
Noha Mohamed Fathy Younes Badr
4.86 (14)
Golden Trend indicator  is The best indicator for predicting trend movement this indicator never lags and never repaints and never back paints    and give  arrow buy and sell    before the candle appear  and it will help you and  will make your trading decisions clearer its work on all currencies and  gold and crypto and all time frame This unique  indicator uses very secret algorithms to catch the  trends, so you can trade using this indicator and see the trend clear on charts  manual guide and
FX Volume MT5
Daniel Stein
4.72 (18)
FX Volume:ブローカー視点で捉える本物の市場センチメント クイック概要 トレード手法をさらに高めたいとお考えですか? FX Volume は、リテールトレーダーやブローカーのポジション状況をリアルタイムで提供します。これは、COTのような遅延レポートよりもはるかに早く知ることができます。安定した利益を目指す方も、さらなる優位性を求める方も、 FX Volume は大きな不均衡を見極め、ブレイクアウトを確認し、リスク管理を洗練させるのに役立ちます。今すぐ始めて、実際の出来高データがどのように意思決定を変革するかを体感してください! 1. FX Volume がトレーダーにとって非常に有益な理由 高精度の早期警戒シグナル • 各通貨ペアを売買しているトレーダー数を、他者よりも早く、ほぼリアルタイムで把握できます。 • FX Volume は、複数のリテールブローカーから得られる本物の出来高データを収集し、分かりやすい形式で提供する 唯一 のツールです。 強力なリスク管理 • ロングやショートの大きな偏り(インバランス)を特定し、潜在的なトレンド転換を見逃しません。ストップ
FX Power: 通貨の強弱を分析して、より賢い取引を実現 概要 FX Power は主要通貨と金の実際の強弱をあらゆる市場状況で理解するための必須ツールです。強い通貨を買い、弱い通貨を売ることで、 FX Power は取引の意思決定を簡素化し、高い確率の取引機会を見出します。トレンドを追従する場合でも、極端なデルタ値を使用して反転を予測する場合でも、このツールはあなたの取引スタイルに完全に適応します。ただ取引するだけではなく、 FX Power で賢く取引をしましょう。 1. なぜ FX Power がトレーダーにとって非常に有益なのか 通貨と金のリアルタイム強弱分析 • FX Power は主要通貨と金の相対的な強弱を計算し、マーケットダイナミクスに関する明確な洞察を提供します。 • どの資産がリードしているか、または後れを取っているかを監視して、取引するペアを賢く選びましょう。 マルチタイムフレームの包括的なビュー • 短期、中期、長期のタイムフレームで通貨と金の強弱を追跡し、マーケットトレンドに基づいて取引戦略を調整できます。 • スキャルピングからスイングトレード
Quantum TrendPulse を ご紹介します。これは、   SuperTrend   、   RSI   、および Stochastic のパワーを 1 つの包括的なインジケーターに組み合わせて、取引の可能性を最大限に引き出す究極の取引ツールです。精度と効率を求めるトレーダー向けに設計されたこのインジケーターは、市場のトレンド、勢いの変化、最適なエントリー ポイントとエグジット ポイントを自信を持って特定するのに役立ちます。 主な特徴: SuperTrend 統合: 現在の市場動向に簡単に追従し、収益性の波に乗ることができます。 RSI精度: 買われすぎと売られすぎのレベルを検出し、市場の反転のタイミングに最適で、SuperTrendのフィルターとして使用されます。 確率的精度: 確率的振動を活用して、変動の激しい市場で隠れたチャンスを見つけます。SuperTrend のフィルターとして使用されます。 マルチタイムフレーム分析:   M5 から H1 または H4 まで、さまざまなタイムフレームで市場を常に把握します。 カスタマイズ可能なアラート: カスタム取引条件が満たされ
IX Power: 指数、商品、暗号資産、外国為替市場の洞察を発見 概要 IX Power は、指数、商品、暗号資産、外国為替市場の強弱を分析するための多用途ツールです。 FX Power が全ての利用可能な通貨ペアデータを活用して外為ペアで最高の精度を提供する一方、 IX Power は基礎資産の市場データにのみ焦点を当てています。この特性により、 IX Power は非外為市場に最適であり、単純な外為分析にも信頼性の高いツールです。どのチャートでもスムーズに機能し、取引判断を向上させるための明確で実行可能な洞察を提供します。 1. IX Power がトレーダーにとって価値がある理由 複数市場での強弱分析 • IX Power は指数、商品、暗号資産、外為シンボルの強弱を計算し、それぞれの市場に合わせた洞察を提供します。 • US30、WTI、ゴールド、ビットコイン、または通貨ペアなどの資産を監視して取引機会を発見できます。 幅広い市場に適応 • 外為取引では、 FX Power が関連する全ての通貨ペアを分析することで比類のない精度を提供します。 • IX Power
FX Levels: あらゆる市場における非常に高精度なサポート&レジスタンス 概要 通貨ペア、株式指数、個別銘柄やコモディティなど、どのような市場でも信頼できるサポートとレジスタンスを特定したいですか? FX Levels は伝統的な “Lighthouse” メソッドと先進的な動的アプローチを融合し、ほぼ汎用的な精度を実現します。ブローカーの実務経験を活かし、自動化されたデイリー更新とリアルタイム更新を組み合わせることで、 FX Levels は反転ポイントを見つけ、利益目標を設定し、自信をもってトレードを管理するための手助けをします。今すぐ試してみて、サポート/レジスタンス分析の正確性がどれほどトレードを向上させるかを実感してください! 1. FX Levels がトレーダーにとって非常に有用な理由 非常に正確なサポート&レジスタンスゾーン • FX Levels は異なるブローカー環境でもほぼ同一のゾーンを生成するよう設計されており、データフィードの差異や時刻設定のずれによる不一致を解消します。 • つまり、どのブローカーを利用していても一貫したレベルが得られるため、戦
指示する     ロシア     -        utilizar con   el indicador の ESP 推奨事項 -   TPSpro トレンド プロフェッショナル版 -   MT5のバージョン 最も重要なことは、将来においても最も重要なことです。 機能のプリンシパル: ゾーンのほとんどは、ベンダーとコンプラドールによってアクティブ化されます。 状況を直感的に把握できるよう、初期の衝動を修正します。 LOGIC AI: MUESTRA zonas (círculos) parabuscar puntos de entrada cuando se activa una plantilla 視覚的に優れた視覚効果があり、最も重要な機能がすべて揃っていることに注意してください。 優れたニベレス/ゾーンの視覚化 (modo MTF) 世界で最も人気のある場所/ゾーンです。これを使用するのに最適な方法です (   TPSproTREND PRO   )。 アルゴリズム プロフェッショナル セパラド パソ ア パソ パラ オペラ それは、オペラハウスやコントラ・デ・エラの指導におい
TPSpro TREND PRO は 、市場を自動的に分析し、トレンドとその各変化に関する情報を提供し、再描画せずに取引にエントリーするためのシグナルを提供するトレンド指標です。 インジケーターは各ローソク足を使用し、個別に分析します。上向きまたは下向きのさまざまな衝撃を指します。通貨、仮想通貨、金属、株、指数の取引への正確なエントリーポイント! バージョンMT5                   インジケーターの完全な説明     RFI LEVELS インジケーター と併用することをお勧めします。 主な機能: レンダリングなしで正確な入力信号! シグナルが表示されると、それは関連性を維持します。これは、シグナルを提供してからそれを変更し、その結果、入金された資金が失われる可能性があるリドローインジケーターとの重要な違いです。より高い確率と精度で市場に参入できるようになりました。矢印が表示された後、ターゲットに到達する (利益確定) か反転シグナルが表示されるまで、ローソク足に色を付ける機能もあります。 STOP-LOSS/TAKE-PROFITゾーンの表示 エントリーポイントを
今、147ドル(いくつかの更新後に499ドルに増加します) - 無制限のアカウント(PCSまたはMac) RelicusRoad ユーザー マニュアル + トレーニング ビデオ + プライベート Discord グループへのアクセス + VIP ステータス 市場の新しい見方 RelicusRoad は、外国為替、先物、暗号通貨、株式、および指数の世界で最も強力な取引インジケーターであり、トレーダーに収益を維持するために必要なすべての情報とツールを提供します。初心者から上級者まで、すべてのトレーダーが成功するためのテクニカル分析と取引計画を提供します。これは、将来の市場を予測するのに十分な情報を提供する重要な取引指標です。意味をなさないチャート上のいくつかの異なる指標ではなく、完全な解決策を信じています.これは、信号、矢印 + 価格アクション情報を表示するオールインワンのインジケーターで、他に類を見ない非常に正確です。 強力な AI に基づいて、RelicusRoad は不足している情報とツールを提供して、あなたを教育し、トレーディングのプロ、成功したトレーダーにします。 ほと
サポートとレジスタンススクリーナーは、1つのインジケーター内に複数のツールを提供するMetaTraderの1つのレベルインジケーターにあります。 利用可能なツールは次のとおりです。 1.市場構造スクリーナー。 2.強気のプルバックゾーン。 3.弱気プルバックゾーン。 4.デイリーピボットポイント 5.毎週のピボットポイント 6.毎月のピボットポイント 7.ハーモニックパターンとボリュームに基づく強力なサポートとレジスタンス。 8.銀行レベルのゾーン。 期間限定オファー:HVサポートおよびレジスタンスインジケーターは、50ドルと生涯でのみご利用いただけます。 (元の価格125 $) MQL5ブログにアクセスすると、分析例を含むすべてのプレミアム指標を見つけることができます。 ここをクリックしてください。 主な機能 ハーモニックおよびボリュームアルゴリズムに基づく強力なサポートおよびレジスタンスゾーン。 ハーモニックおよびボリュームアルゴリズムに基づく強気および弱気のプルバックゾーン。  市場構造スクリーナー 毎日、毎週、毎月のピボットポイント。 ドキュメント すべてのサポートおよび
Bill Williams Advanced is designed for automatic chart analysis using Bill Williams' "Profitunity" system. The indicator analyzes four timeframes at once. Manual (Be sure to read before purchasing) Advantages 1. Automatically analyzes the chart using the "Profitunity" system of Bill Williams. The found signals are placed in a table in the corner of the screen. 2. Equipped with a trend filter based on the Alligator indicator. Most of the system signals are recommended to be used only according t
このダッシュボードは、選択されたシンボルの最新の利用可能なハーモニックパターンを表示するので、時間を節約し、より効率的に /   MT4バージョン 。 無料インジケーター:   Basic Harmonic Pattern インジケーター列 Symbol : 選択したシンボルが表示されます。 Trend :   強気または弱気 Pattern : パターンの種類(ガートレー、バタフライ、バット、カニ、サメ、サイファー、ABCD) Entry : エントリー価格 SL: ストップロス価格 TP1: 1回目の利食い価格 TP2: 2回目の利食い価格 TP3:   3回目の利食い価格 Current price :   現在値 Age (in bars):    最後に描画されたパターンの年齢 主な入力項目 Symbols:   "28 Major Currency Pairs "または "Selected Symbols "から選択。 Selected Symbols:   カンマで区切られた監視したいシンボル("EURUSD,GBPUSD,XAUUSD")。ブローカーがペアに接
まず第一に、この取引ツールはノンリペイント、ノンリドロー、ノンラグの指標であり、プロの取引に理想的ですことを強調する価値があります。 オンラインコース、ユーザーマニュアル、デモ。 スマートプライスアクションコンセプトインジケーターは、新米から経験豊富なトレーダーまで、非常 に強力なツールです。Inner Circle Trader AnalysisやSmart Money Concepts Trading Strategiesなど、20以上の有用な指標を1つに組み合わせています。このインジケーターはスマートマネーコンセプトに焦点を当て、大手機関の取引方法を提供し、彼らの動きを予測するのに役立ちます。 特に、流動性分析に優れており、機関がどのように取引しているかを理解しやすくしています。市場のトレンドを予測し、価格の動きを慎重に分析するのに優れています。機関の戦略とトレードを合わせることで、市場の動向についてより正確な予測ができます。このインジケーターは多目的であり、市場構造を分析し、重要な注文ブロックを特定し、さまざまなパターンを認識するのに優れています。 このインジケーター
これはMT5のインジケーターで、再描画なしで取引に参入するための正確なシグナルを提供します。 外国為替、暗号通貨、金属、株式、インデックスなど、あらゆる金融資産に適用できます。かなり正確な見積もりを提供し、取引を開始して終了するのに最適な時期を教えてくれます。1つのシグナルを処理しただけでインジケーターの元が取れた例の 動画 (6:22)をご覧ください。Entry PointsPro インジケーターの助けを借りたほとんどのトレーダーの最初の1週間の結果が改善しています。 Telegramグループ に登録してください。Entry Points Proインジケーターのメリットは次の通りです。 再描画のないエントリーシグナル 再描画されるインジケーターでは一度表示されたシグナルが削除されて大きな金銭的損失につながることがありますが、これと異なり、表示されて確認されたシグナルは消えることがありません。 エラーなしの取引開始 インジケーターアルゴリズムによって取引を開始する(資産を売買する)理想的な瞬間を見つけることができます。それを使用するすべてのトレーダーの成功率が向上します。 あら
FX Dynamic: カスタマイズ可能なATR分析でボラティリティとトレンドを把握 概要 FX Dynamic は平均的な真のレンジ(ATR)の計算を活用して、日次および日中ボラティリティに関する卓越した情報をトレーダーに提供する強力なツールです。80%、100%、130%などのボラティリティ閾値を設定することで、通常の範囲を超えた際にすぐに警告を受け取ったり、有望な利益機会を素早く捉えられます。 FX Dynamic はブローカーのタイムゾーンに合わせて調整でき、安定したボラティリティ測定を維持しながら、リアルタイム分析のためにMetaTraderとシームレスに連携します。 1. なぜFX Dynamicがトレーダーにとって非常に有益か リアルタイムのATRインサイト • 日次・日中のボラティリティをひと目で把握。価格がATRの80%、100%、130%などに達したときに警告を受け取り、重要な水準にあるかどうかを確認できます。 • ボラティリティが完全に爆発する前に潜在的な反転やブレイクアウトを先取り可能。 幅広いマーケットへの適用 • 外国為替、コモディティ、株価指数な
Gold Stuff mt5
Vasiliy Strukov
4.92 (173)
Gold Stuff mt5 は、金専用に設計されたトレンド指標であり、あらゆる金融商品にも使用できます。 インジケーターは再描画せず、遅れません。 推奨時間枠 H1. 設定と個人的なボーナスを得るために、購入後すぐに私に連絡してください!  トレンド スキャナーの強力なサポートを利用して、無料のインジケーターを入手し、プライバシーを守ります。あーみー!   設定 矢印を描く - オンオフ。 チャートに矢印を描く。 アラート - 可聴アラートのオンオフ。 メール通知 - オンオフ。 電子メール通知。 プチ通知 - オンオフ。 プッシュ通知。 次に、色域を調整します。 Gold Stuff mt5 は、金専用に設計されたトレンド指標であり、あらゆる金融商品にも使用できます。 インジケーターは再描画せず、遅れません。 推奨時間枠 H1. 設定と個人的なボーナスを得るために、購入後すぐに私に連絡してください!   設定 矢印を描く - オンオフ。 チャートに矢印を描く。 アラート - 可聴アラートのオンオフ。 メール通知 - オンオフ。 電子メール通知。 プチ通知 - オンオ
ご紹介     Quantum Breakout PRO は 、ブレイクアウト ゾーンの取引方法を変革する画期的な MQL5 インジケーターです。 13年以上の取引経験を持つ経験豊富なトレーダーのチームによって開発されました。     クォンタム ブレイクアウト プロ   は、革新的でダイナミックなブレイクアウト ゾーン戦略により、あなたのトレーディングの旅を新たな高みに押し上げるように設計されています。 クォンタム ブレイクアウト インジケーターは、5 つの利益ターゲット ゾーンを備えたブレイクアウト ゾーン上のシグナル矢印と、ブレイクアウト ボックスに基づいたストップロスの提案を提供します。 初心者トレーダーにもプロのトレーダーにも適しています。 量子EAチャネル:       ここをクリック 重要!購入後、インストールマニュアルを受け取るためにプライベートメッセージを送ってください。 推奨事項: 時間枠: M15 通貨ペア: GBPJPY、EURJPY、USDJPY、NZDUSD、XAUUSD アカウントの種類: ECN、Raw、またはスプレッドが非常に低い R
Matrix Arrow Indicator MT5
Juvenille Emperor Limited
5 (13)
マトリックスアローインジケーターMT5は、すべてのシンボル/商品(外国為替、商品、暗号通貨、インデックス、株式)で使用できる100%再描画されていないマルチタイムフレームインジケーターに続くユニークな10in1トレンドです。マトリックスアローインジケーターMT5は、初期段階で現在のトレンドを判断し、最大10の標準インジケーターから情報とデータを収集します。 平均方向移動指数(ADX) 商品チャネルインデックス(CCI) クラシック平研アシキャンドル 移動平均 移動平均収束発散(MACD) 相対活力指数(RVI) 相対力指数(RSI) 放物線SAR ストキャスティクス ウィリアムズのパーセント範囲 すべてのインジケーターが有効な買いまたは売りシグナルを与えると、対応する矢印がチャートに印刷され、次のろうそく/バーの開始時に強い上昇トレンド/下降トレンドを示します。ユーザーは、使用するインジケーターを選択し、各インジケーターのパラメーターを個別に調整できます。マトリックスアローインジケーターMT5は選択されたインディケーターからのみ情報を収集し、それらのデータのみに基づいてアローを印刷
After your purchase, feel free to contact me for more details on how to receive a bonus indicator called VFI, which pairs perfectly with Easy Breakout for enhanced confluence!     Easy Breakout MT5   is a powerful price action trading system built on one of the most popular and widely trusted strategies among traders: the   Breakout strategy ! This indicator delivers crystal-clear Buy and Sell signals based on breakouts from key support and resistance zones. Unlike typical breakout indicators
Gartley Hunter Multi - An indicator for searching for harmonic patterns simultaneously on dozens of trading instruments and on all possible timeframes. Manual (Be sure to read before purchasing) | Version for MT4 Advantages 1. Patterns: Gartley, Butterfly, Shark, Crab. Bat, Alternate Bat, Deep Crab, Cypher 2. Simultaneous search for patterns on dozens of trading instruments and on all possible timeframes 3. Search for patterns of all possible sizes. From the smallest to the largest 4. All fou
Royal Scalping Indicator is an advanced price adaptive indicator designed to generate high-quality trading signals. Built-in multi-timeframe and multi-currency capabilities make it even more powerful to have configurations based on different symbols and timeframes. This indicator is perfect for scalp trades as well as swing trades. Royal Scalping is not just an indicator, but a trading strategy itself. Features Price Adaptive Trend Detector Algorithm Multi-Timeframe and Multi-Currency Trend Low
これはほぼ間違いなく、MetaTraderプラットフォームで見つけることができる最も完全な調和価格形成自動認識インジケーターです。 19種類のパターンを検出し、フィボナッチプロジェクションをあなたと同じように真剣に受け止め、潜在的逆転ゾーン(PRZ)を表示し、適切なストップロスとテイクプロフィットレベルを見つけます。 [ インストールガイド | 更新ガイド | トラブルシューティング | よくある質問 | すべての製品 ] 19の異なる調和価格形成を検出します プライマリ、派生および補完フィボナッチ投影(PRZ)をプロットします 過去の価格行動を評価し、過去のすべてのパターンを表示します この指標は、独自の品質とパフォーマンスを分析します 適切なストップロスとテイクプロフィットのレベルを表示します ブレイクアウトを使用して適切な取引を通知します すべてのパターン比をグラフにプロットします 電子メール/音声/視覚アラートを実装します スコット・M・カーニーの本に着想を得て、この指標は最も純粋で急を要するトレーダーのニーズを満たすように設計されています。ただし、トレードを容易にする
このダッシュボードは、選択したシンボルの取引戦略に応じて、スキャルピングと長期モードの両方で、チャート上の需給ゾーンを発見し表示します。さらに、ダッシュボードのスキャナーモードは、一目ですべての希望のシンボルをチェックし、適切なポジションを見逃さないようにするのに役立ちます /  バージョンMT4 無料インディケータ:   Basic Supply Demand 特徴 複数の通貨ペアの取引機会を見ることができ、需給ゾーンの近さに応じてランク付けされた全ペアを明確かつ簡潔に表示します。 色から検出パラメータまで、特定のニーズに合わせてカスタマイズ可能な設定 主な入力 Indicator mode : 新機能を備えたインジケーター・モードまたはパネル・モードから選択。 Symbols :   "主要28通貨ペア "または "選択されたシンボル "から選択。 Selected Symbols :   カンマで区切られた監視したいシンボル (「EURUSD,GBPUSD,XAUUSD」)。お使いのブローカーがペアに接尾辞または接頭辞を付けている場合は、次の2つのパラメータ(ペア接頭辞または
Contact me  to send you instruction and add you in group. QM (Quasimodo) Pattern is based on Read The Market(RTM) concepts. The purpose of this model is to face the big players of the market (financial institutions and banks), As you know in financial markets, big traders try to fool small traders, but RTM prevent traders from getting trapped. This style is formed in terms of price candles and presented according to market supply and demand areas and no price oscillator is used in it. RTM conc
Auto Order Block with break of structure based on ICT and Smart Money Concepts (SMC) Futures Break of Structure ( BoS )             Order block ( OB )            Higher time frame Order block / Point of Interest ( POI )    shown on current chart           Fair value Gap ( FVG ) / Imbalance   -  MTF      ( Multi Time Frame )    HH/LL/HL/LH  -  MTF      ( Multi Time Frame )  Choch  MTF      ( Multi Time Frame )  Volume Imbalance     ,  MTF          vIMB Gap’s Power of 3 Equal High / Low’s  
Special offer : ALL TOOLS , just $35 each! New tools   will be   $30   for the   first week   or the   first 3 purchases !  Trading Tools Channel on MQL5 : Join my MQL5 channel to update the latest news from me Volumatic VIDYA (Variable Index Dynamic Average) は、トレンドを追跡し、トレンドの各フェーズ内での買い圧力と売り圧力を分析するために設計された高度なインジケーターです。可変インデックス動的平均 (Variable Index Dynamic Average) をコアの動的平滑化技術として利用することで、このツールは、価格とボリュームのダイナミクスに関する重要な洞察を、市場構造の重要なレベルで提供します。 MT4バージョンを見る:  Volumatic VIDyA MT4 他の製品を見る:   全製品 To use iCus
Dark Absolute Trend   is an Indicator for intraday trading. This Indicator is based on   Trend Following  strategy but use also candlestick patterns and Volatility. We can enter in good price with this Indicator, in order to follow the main trend on the current instrument. It is advised to use low spread ECN brokers. This Indicator does   Not repaint   and   N ot lag . Recommended timeframes are M5, M15 and H1. Recommended working pairs: All. I nstallation and  Update Guide   -  Troubleshooting
CONTACT US  after purchase to get the Indicator Manual. Try Now—Limited 50% Discount for First 10 Buyers! Download the  Metatrader 4 Version Due to regulatory restrictions, our service is unavailable in certain countries such as India, Pakistan, and Bangladesh. William Delbert Gann (W.D. Gann) was an exceptional market analyst, whose trading technique was based on a complex blend of mathematics, geometry, astrology, and ancient mathematics which proved to be extremely accurate. A Note from t
Suleiman Levels
Suleiman Alhawamdah
5 (1)
重要な注意:スクリーンショットに表示されている画像は、私の2つのインジケーター、「スレイマンレベル」インジケーターと「RSI Trend V」インジケーターです。 「RSI Trend V1」インジケーターと併用することを推奨しました。特に、カラードクラウドの確認と一致、および矢印のシグナルに加えて、フィボナッチインジケーターとその優れたレベルも重要です。 : https://www.mql5.com/en/market/product/132080 「スレイマンレベル」インジケーターは、高度なオールインワンのプロフェッショナル分析ツールです。約9,800行のコードを備えたこのインジケーターは、革新性、精度、シンプルさを組み合わせて、チャートをこれまで以上に明確にします。これは単なるインジケーターではありません。 「スレイマンレベル」を際立たせる強力な機能: 黄色のボックス(資金流の検出):特定のろうそく足における銀行や機関からの資金流入を検出します。これらのボックスは、このインジケーター独自の重要な資金活動を表します。 チャート上のカラーレベル – 比類のない精度:再描画されない独
作者のその他のプロダクト
I speak in Hungarian. Magyarul beszélek benne. (Első felvétel. https://youtu.be/MapbQrJ0uPU Első felvétel. https://youtu.be/i2id5O1KPrI Második felvétel. https://youtu.be/Zp2i7QN-IMc Első felvétel. https://youtu.be/h7UbTWiM-Lw Második felvétel. https://youtu.be/y54q4Rasf2A Harmadik felvétel. https://youtu.be/13zYjsoe6ZQ Negyedik felvétel. https://youtu.be/NGiB1AnxxfU ) Nice Day Signalos! Positive building candle. If the previous body closes the candle over the candle. Buy takes. If the previous
I speak in Hungarian. Magyarul beszélek benne. (Első felvétel. https://youtu.be/MapbQrJ0uPU Első felvétel. https://youtu.be/i2id5O1KPrI Második felvétel. https://youtu.be/Zp2i7QN-IMc Első felvétel. https://youtu.be/h7UbTWiM-Lw Második felvétel. https://youtu.be/y54q4Rasf2A Harmadik felvétel. https://youtu.be/13zYjsoe6ZQ Negyedik felvétel. https://youtu.be/NGiB1AnxxfU ) Nice Day Signalos! Positive building Muving Average Turn. Positive construction for Moving Average Round. If the Muving Average 
I speak in Hungarian. Magyarul beszélek benne. Első felvétel. https://www.youtube.com/watch?v=h7UbTWiM-Lw Második felvétel. https://www.youtube.com/watch?v=y54q4Rasf2A&t=1s Harmadik felvétel. https://www.youtube.com/watch?v=13zYjsoe6ZQ Negyedik felvétel. https://www.youtube.com/watch?v=NGiB1AnxxfU Nice Day Signalos! If the Muving Average closes the candle over the candle. Buy takes. If the Muving Average closes the candle under the candle. Sell takes. MA trend. It can be set for him. Positive MA
I speak in Hungarian. Magyarul beszélek benne. Első felvétel. https://www.youtube.com/watch?v=i2id5O1KPrI Második felvétel. https://www.youtube.com/watch?v=Zp2i7QN-IMc (Első felvétel. https://www.youtube.com/watch?v=h7UbTWiM-Lw Második felvétel. https://www.youtube.com/watch?v=y54q4Rasf2A&t=1s Harmadik felvétel. https://www.youtube.com/watch?v=13zYjsoe6ZQ Negyedik felvétel. https://www.youtube.com/watch?v=NGiB1AnxxfU ) Nice Day Signalos! If the Muving Average closes the candle over the candle.
I speak in Hungarian. Magyarul beszélek benne. Első felvétel. https://www.youtube.com/watch?v=MapbQrJ0uPU&t=9s (Első felvétel. https://www.youtube.com/watch?v=i2id5O1KPrI Második felvétel. https://www.youtube.com/watch?v=Zp2i7QN-IMc Első felvétel. https://www.youtube.com/watch?v=h7UbTWiM-Lw Második felvétel. https://www.youtube.com/watch?v=y54q4Rasf2A&t=1s Harmadik felvétel. https://www.youtube.com/watch?v=13zYjsoe6ZQ Negyedik felvétel. https://www.youtube.com/watch?v=NGiB1AnxxfU ) Nice Day Sign
I speak in Hungarian. Magyarul beszélek benne. Első felvétel. https://www.youtube.com/watch?v=FfqvT-i9TPk&feature=youtu.be (Első felvétel. https://www.youtube.com/watch?v=MapbQrJ0uPU&t=9s   Első felvétel. https://www.youtube.com/watch?v=i2id5O1KPrI Második felvétel. https://www.youtube.com/watch?v=Zp2i7QN-IMc Első felvétel. https://www.youtube.com/watch?v=h7UbTWiM-Lw Második felvétel. https://www.youtube.com/watch?v=y54q4Rasf2A&t=1s Harmadik felvétel. https://www.youtube.com/watch?v=13zYjsoe6
Nice Day! - A moving average candle indicates a high and low turn trend. - MA_vonal_vastagsaga: MA_line_thickness. - MA_vonal_szine: MA_line_color. - MA_vonal_szine_long: MA_line_color_long. - MA_vonal_szine_short: MA_line_color_short. - mql5.com can also be used for my robots. Szép Napot! - Mozgó átlag gyertyájának magas (High) és alacsony (Low) fordulos trend jelzése. - mql5.com robotjaimhoz is használható.
I speak in Hungarian. Magyarul beszélek benne. https://www.mql5.com/en/market/product/54925 Első felvétel.   https://www.youtube.com/watch?v=FfqvT-i9TPk&feature=youtu.be Második felvétel. A videóban csak a 3 SL számít a végén magyarázatnak. A robotban nem ez a kereskedési vásárlás működik. Hanem amit fent mutattam. https://www.youtube.com/watch?v=YzmcyO50YdM&ab_channel=GyulaKlein (Első felvétel. https://www.youtube.com/watch?v=MapbQrJ0uPU&t=9s   Első felvétel. https://www.youtube.com/watch?v=i2
I speak in Hungarian. Magyarul beszélek benne. - You can find the indicator by my name. Which is in the picture and the video. On mql5.com.  " Utam MA High Low" - Megkeresheti az indikátort a nevemnél. Ami a képen és a videóban van. Az mql5.com-on.  " Utam MA High Low" Első felvétel. https://www.youtube.com/watch?v=YzmcyO50YdM&amp ;ab_channel=GyulaKlein (Első felvétel.   https://www.youtube.com/watch?v=FfqvT-i9TPk&feature=youtu.be Első felvétel. https://www.youtube.com/watch?v=MapbQrJ0uPU&t=
Szia! Egy indikátorral. Több idő gyertyájának kirajzoltatása egy charton. Különböző színek rendelhetők a long és short gyertyákhoz. Vonal vastagsága állítható. A gyertya kitöltése engedélyezhető. Hello! With an indicator. Drawing multiple time candles on a chart. Different colors can be ordered for long and short candles. Line thickness can be adjusted. Filling the candle can be allowed. Videó: https://www.youtube.com/watch?v=-9bequnAw-g&amp ;ab_channel=GyulaKlein
Hi! Between the given time range. Adds profit and lot. This can be written on the charter in English and Hungarian. The name of the symbol must be entered exactly. Good used for it. :) Szia! A meg adott idősáv között Összeadja a profitot és lot-ot. Ezt ki írathatjuk Angolul és Magyarul a chartra. Pontosan kell beírni a szimbólum nevét. Jó használatott hozzá. :)
フィルタ:
レビューなし
レビューに返信