Netsrac SR Dashboard MT5
- インディケータ
- Carsten Pflug
- バージョン: 2.20
- アクティベーション: 15
Big summer sale. Save up to 40% on my products. SR dashboard - save 10$!
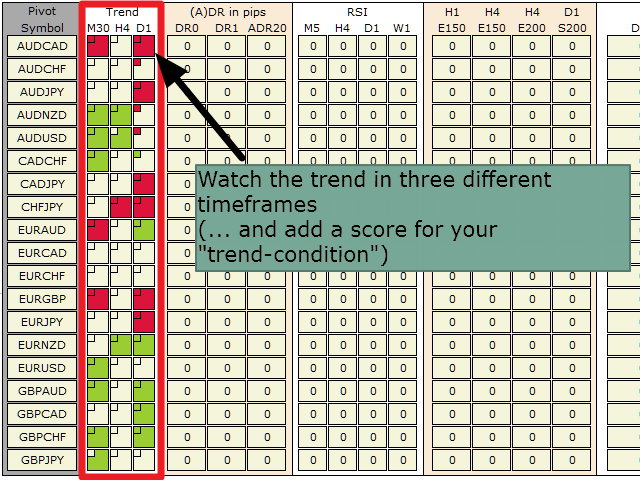
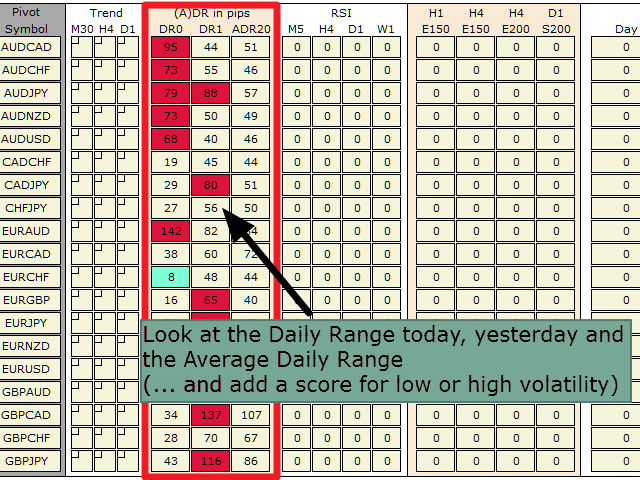
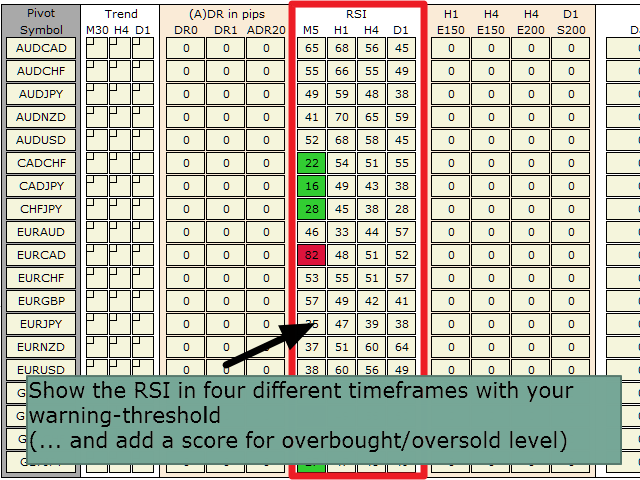
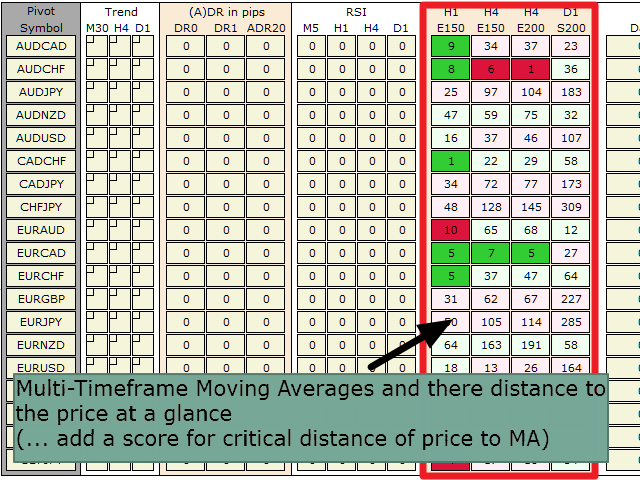
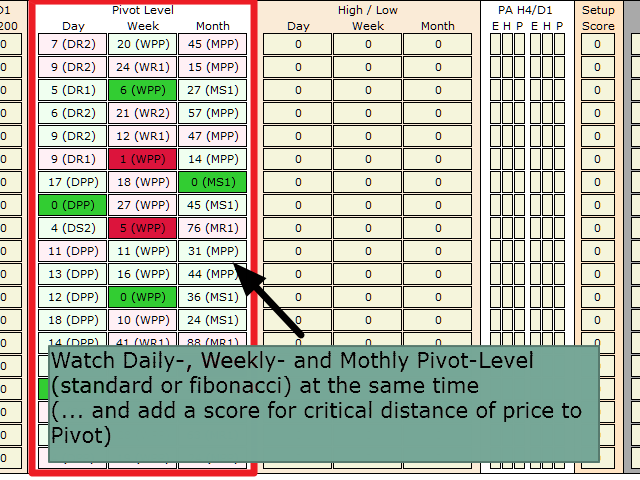
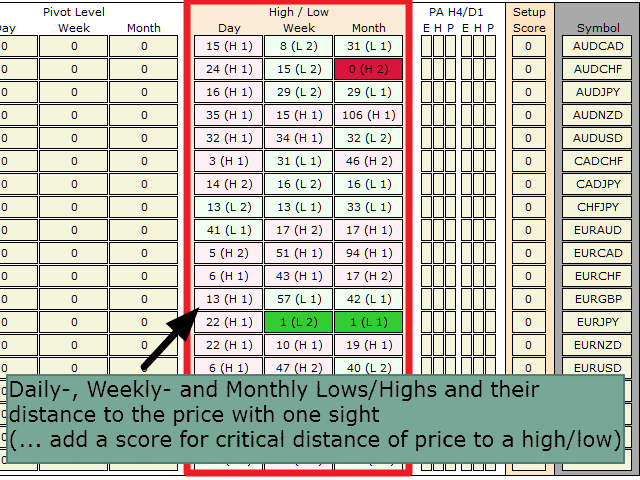
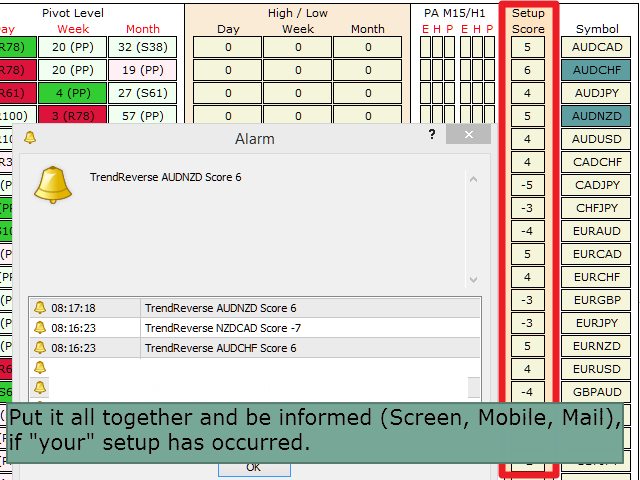
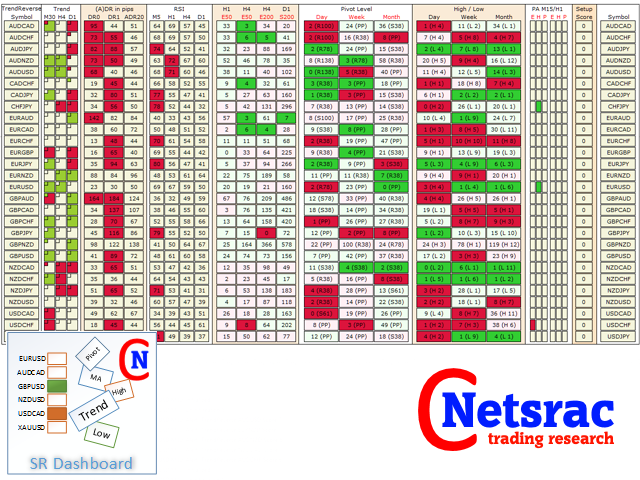
With the SR Dashboard, you get a powerful tool to control some of the most important information in trading. Assemble a setup according to your strategy and get informed as soon as this setup is valid. Assign scores to defined conditions and let the Dashboard find them. Choose from Trend, Average Daily Range, RSI, Moving Averages, Pivot (Daily, Weekly, Monthly), Highs and Lows, Candlestick Patterns.
What can you do with this tool?
Use the dashboard as a powerful tool for your discretionary trading. You will be able to save a lot of time on the screen.
With the SR Dashboard, you will be able to find some interesting trading setups in a faster and smarter way. Some of these setups are described in our SR Dashboard blog series:
Manual


Great dashboard with many functionality that can accomodate range or trend following strategy. Also the author is very helpful and quick to respond with solution. The manual for practical uses is readily available and provide great detail. Hopefully Carsten keep his tools and blog updated. Good job!