Trading Points
- インディケータ
- Kriengsak Peitaisong
- バージョン: 1.0
- アクティベーション: 20
This indicator analyzes price in both current and larger timeframes to generate trendline, trading signals and take profit level. It can work on any financial instruments or securities.
Features:
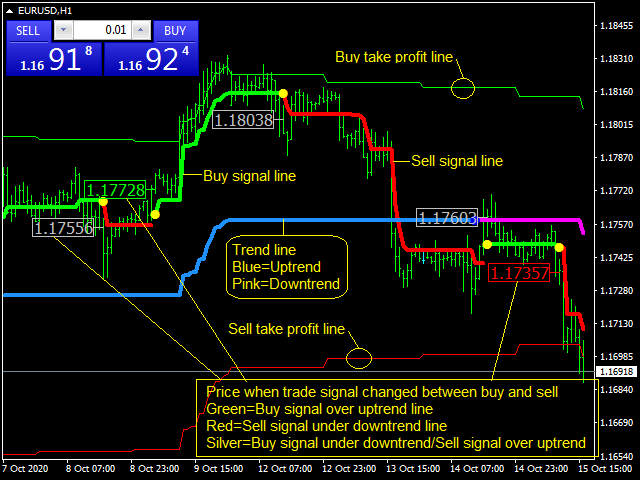
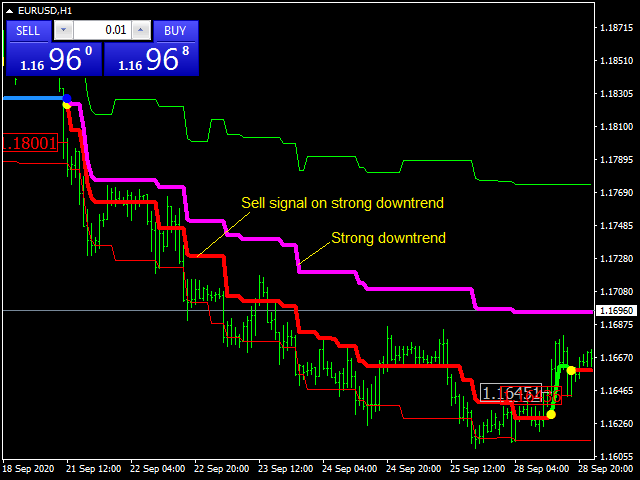
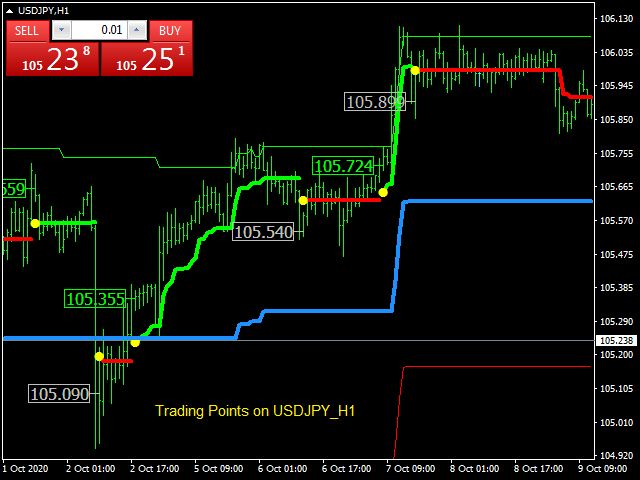
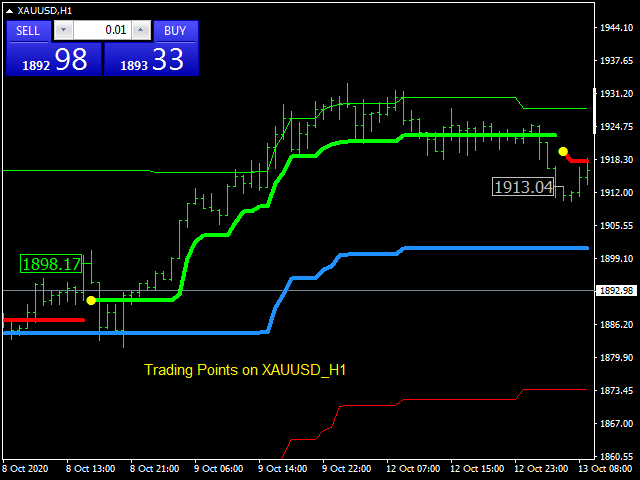
- Trend line, trend line is a 2 colors scheme thick line, blue line denotes uptrend and pink line for downtrend.
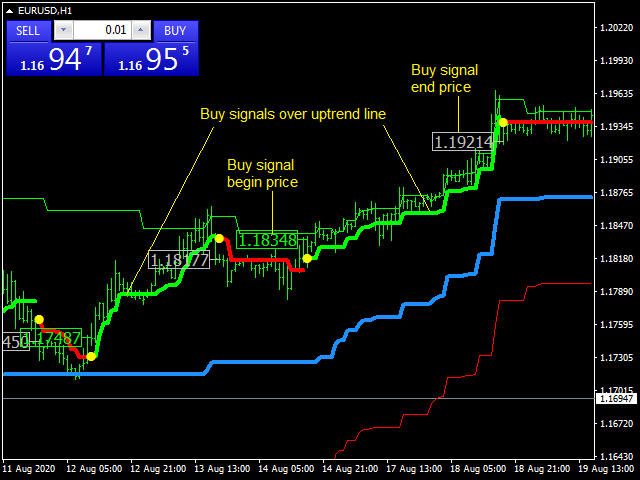
- Trading line, trading line is a 2 colors scheme thick line, green line denotes buy signal and red line for sell signal.
- Price label, the label shows the beginning price of new trading signal. The label will appear in green when new buy signal is above trend line, in red when new sell signal is below trend line and in silver when new buy signal is below trend line or new sell signal is above trend line.
- Alert, there is an on-screen alert and mobile phone notification available when trading signal is changed.
- Take profit lines, take profit lines are thin lines at the utmost outer. Green line is a take profit level for buy order and red line is a take profit level for sell order.
Parameters:
- Parameters, Set the indicator parameters.
- Trend timeframe, select timeframe for trend from drop-down menu. Use D1 or H4 for day trading and scalping depending on price action of the instruments.
- Signal coefficient, set a number to adjust the sensitivity of trading signal. Greater number will decrease the sensitivity of the signal which will good for trading during strong trend.
- Enable signal coefficient adjustment, select true to let the indicator automatically adjust the signal coefficient to the preset value when there is an appropriate price movement.
- Preset auto adjustable signal coefficient, preset value for signal coefficient.
- Size of price arrow, adjust size of price label.
- Alerts, select true or false to enable or disable an alert/notification when there is a new trading signal.
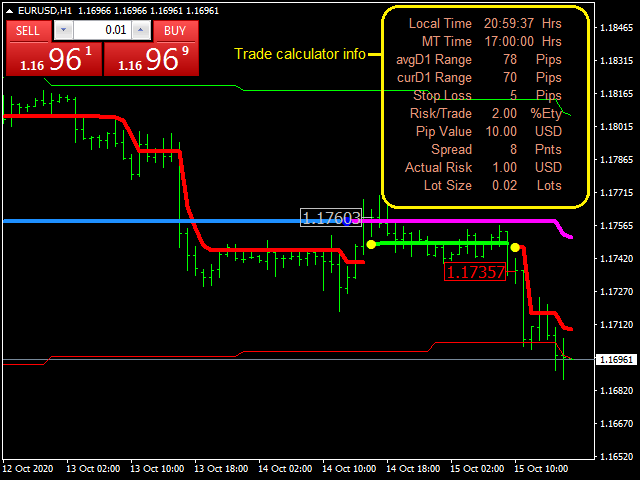
- Trade calculator, select true or false to display or hide information from trade calculator.
