Two Shadows
- インディケータ
- Georgi Gaydarov
- バージョン: 1.2
- アップデート済み: 20 6月 2022
- アクティベーション: 10
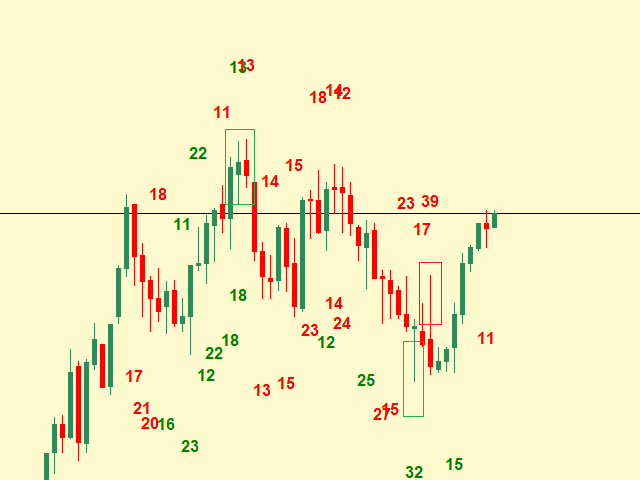
Simplest indicator for bar shadows. Very useful for Kangaroo Tail strategy.
"Shadows" - this is the distance from high and close of the bull bar and low and close of the bear bar.
The purpose of the shadow is to show you if the bar is strong or not. Whether it is internal to the trend or is external. It even helps determine if a trend is starting. Very easy to recognise the pattern of the kangaroo tail and the reverse bar.
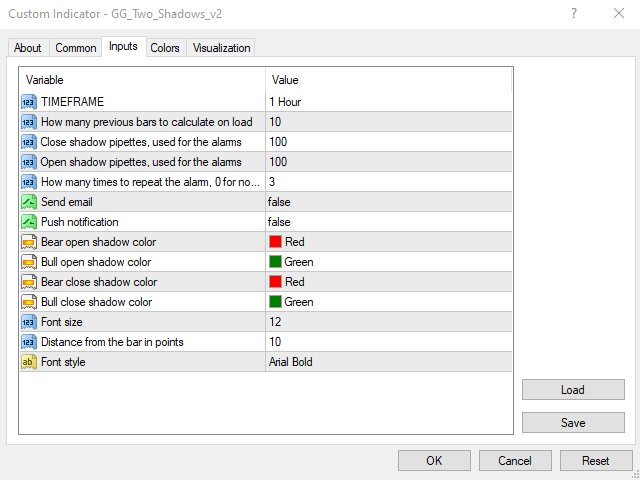
Input arguments:
- Timeframe
- How many prevoius bars to calculate
- Value of the close shadow that should be passed to trigger the alarm and to display the number on the chart
- Value of the open shadow that should be passed to trigger the alarm and to display the number on the chart
- How many times to repeat the alarm (Put 0 if you don't want alarm for shadow)
- Email norifications
- Push notifications
- Bear open shadow color
- Bull open shadow color
- Bear close shadow color
- Bull close shadow color
- Font size
- Distance from the bar (to display the shadow)
- Font style