MultiTimeFrame Currency Meter
- インディケータ
- Noiros Tech
- バージョン: 1.0
- アクティベーション: 5
This Currency Meter Calculates Strength Using a currency basket of 28 pairs?
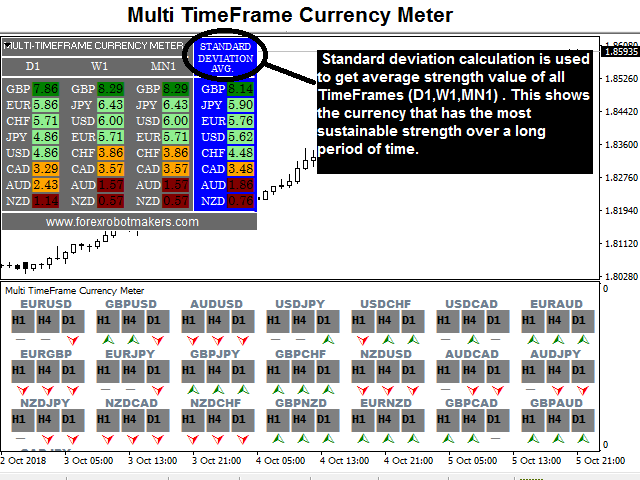
This Currency Meter uses a basket of 28 currency pair to define strength. This is very important because it gives an wholesome view of the strength of a currency by considering its reaction to all major currencies paired with it.
This Currency Meter is Multi-timeframe!!!
Majority of the currency strength indicators around the market today only has a single time frame view. Even with the so called multi-timeframe versions, they provide a list of time frames for you but you will still only be able to view a single time frame per chart.
This indicator shows currency strengths of different time frames in one chart thus giving you a clear picture of the long and short term sentiments of the market in a single view.
Another Awesome About This Currency Meter is Multi-timeframe Averaging!
The final strength displayed is an Average strength of 3 time frames. Why is this important?
While a long term trend might define the short term market sentiment, yet the short term sentiments is what builds the long term. I have seen several cases where a single news release changes the direction of a trend indefinitely. Thus to clearly define the currency strength, you have to consider both Higher Time frames and Lower time frames.
Information You Can Get with This Currency Strength meter
- Direction of a trend: By comparing the strengths of the two currencies in a pair, the direction of that pair can be easily deduced. E.g EUR=7.9, USD=2.9. Then EURUSD is in a bullish trend because EUR is stronger than USD.
- Strength of a trend: The strength of the trend of a particular pair can be simply deduced from the difference between the values of the currencies that make the pair.
Example 1: AUD=6.0, USD=5.9. The difference is just (6.0-5.9=0.1). This is a very weak trend.
Example 2: AUD=8.0, USD=3.0. The difference is (8.0-3.0=5.0). This is a very strong trend. - Volatility: With the difference between the currencies in a pair, you can easily deduce the volatility of that pair. A difference less than three (3.0) signifies weak movement and thus an indication of low volatility . A difference greater than four (4.0) signifies strong movement and thus an indication of high volatility.
These are just a few of the general information you can get from this Currency Strength Meter but the list goes on depending on your trading strategy.
Input menu
- Time Frame 1: First Time Frame
- Time Frame 2: Second Time Frame
- Time Frame 3: Third Time Frame
- TrendPanelBackGround: Editable Panel Background color.
- TrendPanelText: Editable Panel text color.
YOU CAN NOW DOWNLOAD FREE VERSIONS OF OUR PAID INDICATORS . IT'S OUR WAY OF GIVING BACK TO THE COMMUNITY !


