Rooster MT5
- インディケータ
- Irek Gilmutdinov
- バージョン: 2.1
- アップデート済み: 29 11月 2021
- アクティベーション: 10
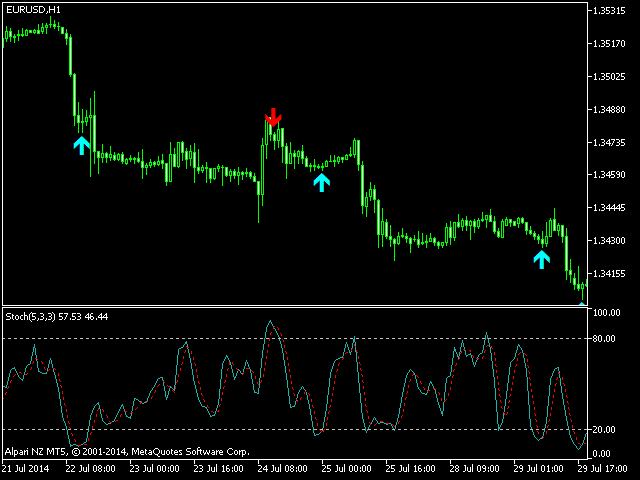
Rooster - is a handy tool that allows you to receive alerts from your favorite indicators:
- Supports up to 3 indicators, built-in and custom;
- Supports up to 4 different signals at the same time;
- Able to show pop-up alerts, send e-mail and push notifications.
This is version for MetaTrader 5, version for MetaTrader 4 is here. Detailed manual is sent on request.
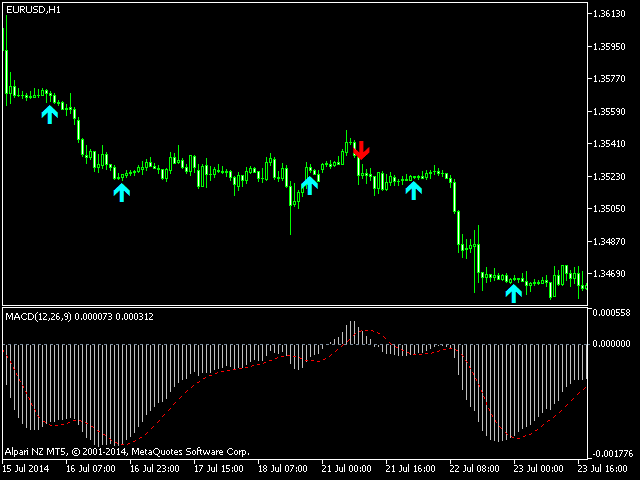
Default settings demonstrate MACD lines crossing signal.