• 概要
  • レビュー (2)
  • コメント (8)
  • 最新情報

HistoryArrowDelete 4

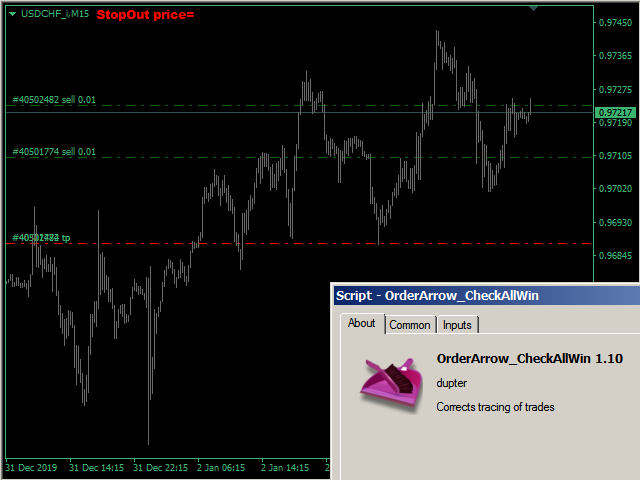
The script controls the display of order tracing. Deletes/sets the icons of closed and market orders.


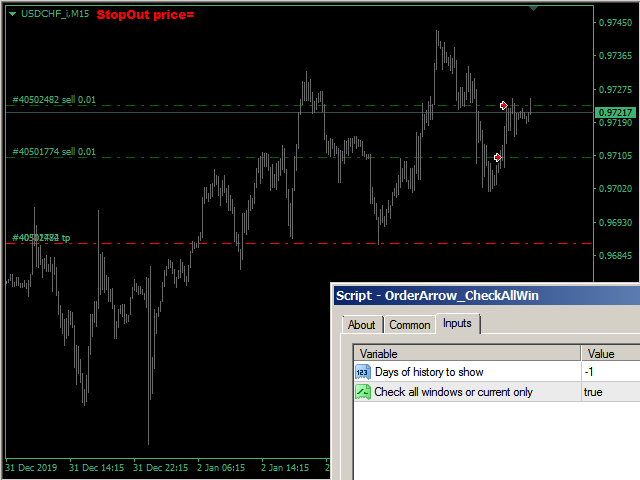
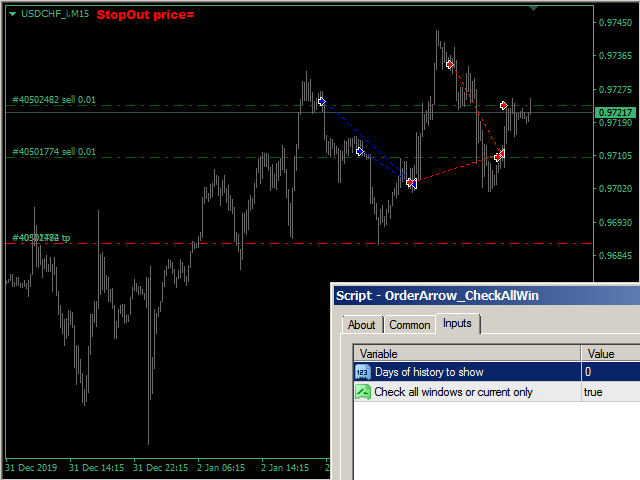
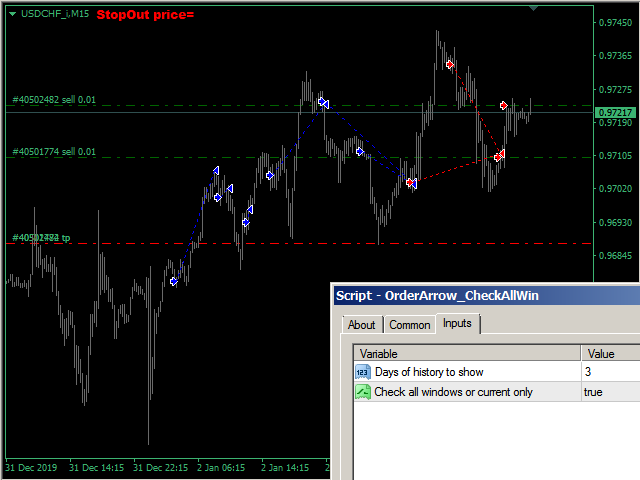
The Days of history to show parameter is the number of full days of trading history to be displayed on the chart.

If the value is 0, only the current day is displayed, less than 0 - only market orders are displayed.


The Check all windows or current only parameter is a switch; the script actions apply to all windows or only to the current window.

おすすめのプロダクト
Candlestick Pattern Scanner is a multi-timeframe and multi-symbol dashboard and alert system that checks all timeframes and currency pairs for different candlestick patterns that are formed in them. Scanner is integrated with support and resistance zones so you can check the candlestick patterns in the most important areas of the chart to find breakout and reversal patterns in the price chart. Download demo version   (works on M1,M5,M30,W1 timeframes) Read the full description of scanner paramet
Live trade ideas from mytradingpet.com, derived from comprehensive technical analysis, historical patterns, and advanced AI algorithms. Access daily performance reports, automatically generated and updated for your convenience. Top performer:  +2106.73%   (NZDUSD over one year through 1221 trades)* Happy trading! * As of May 25, 2024, performance statistics are updated daily. Visit mytradingpet.com for the latest reports. Trade ideas available for 8 FOREX pairs  {"EURUSD","USDJPY","GBPUSD","AUDU
This utility is designed to help you with your Manual Trading. It allows different ways of closing trades. It can display total number of BUY and SELL orders individually and also their individual profits. It can enter trades without stopl loss and take profits. However upon selecting UseStopLossTakeProfit from the settings it can use best possible stop loss and take profits based on the market conditions. Upon selecting the CloseOppositeTrades  from the settings it can close opposite trades. Fo
VR Cub
Vladimir Pastushak
VR Cub は、質の高いエントリーポイントを獲得するためのインジケーターです。このインジケーターは、数学的計算を容易にし、ポジションへのエントリーポイントの検索を簡素化するために開発されました。このインジケーターが作成されたトレーディング戦略は、長年にわたってその有効性が証明されてきました。取引戦略のシンプルさはその大きな利点であり、初心者のトレーダーでもうまく取引することができます。 VR Cub はポジション開始ポイントとテイクプロフィットとストップロスのターゲットレベルを計算し、効率と使いやすさを大幅に向上させます。取引の簡単なルールを理解するには、以下の戦略を使用した取引のスクリーンショットを見てください。 設定、設定ファイル、デモ版、説明書、問題解決方法は、以下から入手できます。 [ブログ] レビューを読んだり書いたりすることができます。 [リンク] のバージョン [MetaTrader 5] エントリーポイントの計算ルール ポジションをオープンする エントリーポイントを計算するには、VR Cub ツールを最後の高値から最後の安値までストレッチする必要があります。
Open multiple trades with 1 click. The EezeOrder Script is designed to make trading easy. All in 1 click, open as many trades as you want, and select the order type from a dropdown list.  No need to change chart just enter the name of the symbol Enter the number of trades you want Select whether it is a buy, sell, buy limit, sell limit, buy stop or sell stop Enter TP(in points) and SL(in points) and click OK, and trades are opened 1. Make sure Auto trading is on 2. Make sure the symbol section
"The trend is your friend" is one of the best known sayings in investing, because capturing large trendy price movements can be extremely profitable. However, trading with the trend is often easier said than done, because many indicators are based on price reversals not trends. These aren't very effective at identifying trendy periods, or predicting whether trends will continue. We developed the Trendiness Index to help address this problem by indicating the strength and direction of price trend
Tradingscenes Trading Panel     How will Trading Panel work ? Trading Panel is created as an Expert Advisor, which will enable traders to set pending orders, or mass pending orders in different types Limit orders with additional functions for taking profit as partial, trailing stop and also taking profit with differences price levels; let’s explain in every single functions for you as following parts: Read the full description here:   https://drive.google.com/file/d/10O10dBLLUcdT3MdPvKqO7L3CIF
This is a utility that helps you close market orders and pending orders (optional), using keyboard shortcuts. For me,  it's more convenient and  faster  than clicking a button on the chart. You can set:  Keyboard Shortcut Hotkey: You can change and use most of the keys on the keyboard.   Key combination (Ctrl, Shift) also available in case you want to use (Note that not all combinations work).  Magic Number  Symbol: select Symbol or All  Close Pending orders: True/False  Confirmation Box Is Re
AW Workpad
AW Trading Software Limited
3.67 (3)
AW Workpad は、手動および半自動取引用に設計された多機能取引コントロール パネルです。保留中の注文、市場ポジションを管理し、幅広い統計データを提供するだけでなく、古典的な指標のグループの複数期間の分析を行うことができます。 このユーティリティは、次の 5 つのタブで表されます。 POSITIONS, PENDING, CLOSE, INDICATORS, INFO .  各タブには、注文や現在の市場状況に関する情報を処理するための独自の機能グループがあります。 MT5版→       ここ / 問題解決 ->   ここ   機能または利点: このユーティリティは、すべての時間枠と任意のシンボル (通貨、指数、石油、金属、株式) で機能します。 各パネルのすべての要素には追加のラベルが付けられており、任意の要素にカーソルを合わせるだけで表示されます。 AW Workpad 取引パネルには、柔軟な設定と直感的なパネル インターフェイスがあります。 最も必要なすべての機能を 1 つの製品に。 取引パネルのタブ: . POSITIONS - このタブでは、成行注文を操作および維持で
BreakEven Line is a very useful and easy to use indicator. In case of multiple positions opened on the same instrument, the indicator shows the breakeven point where it is possible to close the positions. Its graphic simplicity makes it an unobtrusive and customizable tool. You can enable/disable a line on a chart, so you can make the indicator invisible. Inputs Show cumulative BE (line on/off) Breakeven line color (to change the line color) Breakeven line style Breakeven line width Show short B
このパネルはエキスパートアドバイザーであり、6 つのグループの取引パネルを提供します。 MT5 バージョン:   クイックパネルカバレッジ 特徴 ほとんどの取引操作は、これらのパネルのボタンをクリックすることで迅速に実行できます。 パネルの変更は緑色のボタンをクリックするだけで簡単に行えます。 EA はストラテジー テスターの視覚的なチャート上で実行でき、履歴データに基づいて取引を練習する簡単な方法を提供します。 背景が黄色のパネルに平均価格を表示し、平均価格の線を描きます。       ここをクリック パネル ダッシュボードには 2 つの列が含まれています。左の列は売りに関するもので、右の列は買いに関するものです。 売る:     売り注文をオープンします。 初め:     最初の売り注文をクローズします。 1 つ目はオープンタイムを指します。 最後:     最後の売り注文をクローズします。最後のはオープンタイムを指します。 すべて+:     売り注文を利益を上げてクローズします。 全て-:     損失が出た状態で売り注文を閉じる。 最大+:     最大の利益で売り注文を
This tool working You can buy or sell from the button of this tool, the lot size can be filled manually, as for the close all buy button to end all buy positions, close all sell button to end all sell positions, Close All profit button to end  All  profit position, Close All Loss button to end all loss position, Delete Pending button to delete all Pending order, close all orders to end all orders. The variable, you can use close all percent for close all orders when profit in percent, if close
The indicator detects and displays М. Gartley's Butterfly pattern. The pattern is plotted by the extreme values of the ZigZag indicator (included in the resources, no need to install). After detecting the pattern, the indicator notifies of that by the pop-up window, a mobile notification and an email. The pattern and wave parameters are displayed on the screenshots. The default parameters are used for demonstration purposes only in order to increase the amount of detected patterns. Parameters
С этим драйвером вы можете превратить трендовую линию в линию Ганна, поместив значение угла в виде NxM в ее описании, например 4x1, где N - это количество поинтов, а M - количество таймфреймов на текущем графике. Драйвер автоматически отображает значение угла в виде метки у правого конца линии. По умолчанию, размер поинта равен размеру пипса, но в настройках вы можете сами указать подходящий вам размер поинта. Вы можете комбинировать этот индикатор с индикатором  Colored Channels , разделяя проб
Panel "panel_kjutaMultiTerminal" for trading. Opens, modifies, closes and deletes trading and pending orders from the chart using virtual lines, buttons and the active information terminal. Automatically opens an order by indicator levels. Hints in Russian, English or disabled. It has a number of functions for trailing virtual Take Profit lines and limit orders. Displays information on the active information terminal.  Hides and includes virtual lines S/L , T / P, buttons "<>","M","X", as well a
Инструмент для торговли скальпингом с использованием профиля рынка. Позволяет торговать по рынку, а так же оттачивать навыки торговли в тестере стратегий. При минимальном интерфейсе имеет высокую функциональность и пользу для торговли от уровня Point Of Control (POC). Как торговать с помощью советника - утилиты Market profile scalper, смотрите видео. Настройки - - - - - - Market profile - - - - - - Color rectangle range 1 - цвет прямоугольника 1 диапазона свечей Color rectangle range 2 - цвет пр
Trend Divergence Finder – индикатор, позволяющий выявлять дивергенции цены и графика выбранного индикатора. С помощью Trend Divergence Finder вы сможете подобрать тот индикатор, который наиболее эффективен для Вас, и использовать его с наглядным отображением на графике. В индикатор включены 9 базовых индикаторов : 1.        RSI 2.        MACD 3.        MOMENTUM 4.        RVI 5.        STOCHASTIC 6.        CCI 7.        Standard Deviation 8.        Derivative 9.        William Blau Присутст
News Scalping Executor Pro is an utility which helps to trade high impact and huge volatility   news . This utility helps to create two opposite orders with risk management and profit protection. It moves automatically stop loss level to avoid losses as much as possible by using many different algorithms. It helps to avoid trading the news if spread suddenly becomes very huge. It can lock profit by moving stop loss or partially closing of orders. To be profitable with this type of trading y
Supported currency pairs:   AUDCAD, AUDNZD, NZDCAD Recommended timeframe:   M1 Foxy smart grid uses multiple timeframe analyses to spot potential pullbacks in the market. These pullbacks have great potential to make a good profit, we enter these pullbacks on the lowest timeframe ( M1 ) which will be the most accurate timeframe to enter these positions. All backtests are performed over a 17+ years period showing stable and long term results! The goal is long term compounding profits with the re
Now, you have your own AUTO-CLOSE program ! Once your account target or drawdown hits, all open orders will be closed automatically. ========================================== INPUTS: Account target: Put the exact account target. Once the equity hits it or went above that, all orders closed. Please add buffer to consider slippage. Use fixed value or dynamic value: Choose whether you will need a fixed value or dynamic value for drawdown.  DYNAMIC SETTINGS: Equity-based or Balance-based drawdown:
VN Trade Panel II
Vyacheslav Nekipelov
4 (1)
The new version of the trading panel, which now has the ability to separately close Buy and Sell orders, display targets for all orders on the chart, as well as the ability to use the panel to trade with brokers working on the FIFO rule. Also, the new version adds option buttons for separate management of open orders. It has a convenient visualized interface and intuitive control without a lot of additional tabs to which traders have to be distracted and switch their attention. Thanks to this
The indicator displays the data of the Stochastic oscillator from a higher timeframe on the chart. The main and signal lines are displayed in a separate window. The stepped response is not smoothed. The indicator is useful for practicing "manual" forex trading strategies, which use the data from several screens with different timeframes of a single symbol. The indicator uses the settings that are identical to the standard ones, and a drop-down list for selecting the timeframe. Indicator Parame
これは、キャンドルの終値を予測する指標です。 このインジケータは、主にD1チャートでの使用を目的としていますが. この指標は、従来の外国為替取引とバイナリオプション取引の両方に適しています。 インジケーターは、スタンドアロンのトレーディングシステムとして使用することも、既存のトレーディングシステムへの追加として機能させることもできます。 このインジケーターは、現在のキャンドルを分析し、キャンドル自体の内部の特定の強度係数と、前のキャンドルのパラメーターを計算します。 したがって、この指標は、市場の動きのさらなる方向性と現在のキャンドルの終値を予測します。 この方法のおかげで、この指標は、短期の日中取引だけでなく、中期および長期の取引にも適しています。 インジケーターを使用すると、市場の状況の分析中にインジケーターが生成する潜在的な信号の数を設定できます。 インジケーターの設定には、このための特別なパラメーターがあります。 また、インジケーターは、チャート上のメッセージの形式で、電子メールで、およびPUSH通知の形式で、新しい信号について通知することができます。 購入後は必ず私に書いて
T Manager Plus, the ultimate trade management solution designed by traders for traders. If you are searching for a simple and efficient trade panel, trade manager, or trade assistant, you are at the right place. T Manager Plus includes advanced charting utilities with a single goal to help traders analyze, plan, execute, and manage their trades on a single platform. The market contains a diverse number of those tools, but   this one is designed by traders for traders . I designed this tool, and
EasyFXTrade Trading Utility Tool Debeloped for Manual Trading in Forex and Crypto. EasyFXTrade provides a better way for trading, it's the ultimate tool: Watch how works video:  https://youtu.be/5nyJ77IHjUc Parameters: 1. These first 2 parameters are the TP and SL of a tool that gives the risk of an operation(see screenshots for more info) Benefit Tool Points: points of the TP of the blue rectangle, this rectangle can be resizable. Loss Tool Points: points of the SL of the red rect
The most effective signals generated by Ichimoku strategies. Ichimoku Trade Alarm is a supplement for Ichimoku Trade Panel and it shows the signals that Expert Advisor reacts to. Visualization of signals:  Price / Kijun sen cross - the candle body must be between Min_Candlestick_Body and Max_Candlestick_Body. The candle must close above / below Kijun sen, minimum in 1/3 of its body. Open candle must be located above / below Kijun sen. Chinkou span must be under the price of 26 periods in advan
自動注文とリスク管理のためのユーティリティ。利益を最大化し、損失を抑えることができます。トレーダーのための練習トレーダーによって作成されました。このユーティリティは使いやすく、トレーダーが手動で、またはアドバイザーの助けを借りて開いた成行注文で機能します。マジックナンバーで取引をフィルタリングできます。このユーティリティは、同時に任意の数の注文を処理できます。 次の機能があります。 1.ストップロスとテイクプロフィットレベルの設定; 2. トレーリング ストップ レベルで取引を終了します。 3. 損益分岐点の設定。 ユーティリティは次のことができます。 1. オーダーごとに個別に作業します (レベルはオーダーごとに個別に設定されます)。 2. 一方向注文のバスケットを操作します (レベルはすべての注文に共通に設定され、BUY と SELL は個別に設定されます)。 3. 多方向注文のバスケットを操作します (レベルはすべての注文に共通に設定され、BUY と SELL が一緒に設定されます)。 オプション: STOPLOS
A script to open and Close  charts of  multiple pairs instantly with custom template $30 for the next 50 downloaders, next price: $45 Features: Chart Opener : Open chart(s) of multiple pairs simultaneously Template Opener : Load any User specified template (.tpl) to the opened chart(s) Chart Closer : Close chart(s) of multiple pairs simultaneously Disclaimer: Any loss involving this trading tool is the sole responsibility of the User, and not the responsibility of the Creator of this t
The analyzer panel allows traders to add the pending order grid (Buy Limit, Sell Limit, Buy Stop, Sell Stop) quickly and efficiently.   Parameters stop mode - select stop setting mode every order - stop levels are set for each order separately position as - common stop levels for all orders order type - select pending order type Buy Limit Sell Limit Buy Stop Sell Stop magic - set a magic number for open orders if necessary. If position as mode is enabled, stop levels are corrected for all orders
PW Oscillator   - индикатор предназначенный для поиска локальных экстремумов, определения текущей тенденции. В расчетах индикатора используется авторская методика. С помощью индикатора можно определять места возможного разворота цены желательно в направлении тенденции, но также с достаточной точностью и против нее. Также с помощью индикатора можно определять текущую тенденцию. Индикатор подходит для любых валютных пар, но для адекватного отображения показания необходимо, чтобы было достаточно ис
このプロダクトを購入した人は以下も購入しています
Trade Assistant MT4
Evgeniy Kravchenko
4.45 (183)
取引 ごとのリスクの 計算、新規注文 の 簡単 な 設置、部分的 な 決済機能 を 持 つ 注文管理、 7 種類 のトレーリングストップなど 、便利 な 機能 を 備 えています 。 注意、アプリケーションはストラテジーテスターでは機能しません。 Manual, Description, Download demo ライン機能 チャート上にオープニングライン、ストップロス、テイクプロフィットを表示します。この機能により、新規注文を簡単に設定することができ、注文を出す前にその特徴を確認することができます。   リスク計算 リスク計算機能は、設定されたリスクとストップロス注文のサイズを考慮して、新規注文のボリュームを計算します。ストップロスの大きさを自由に設定できると同時に、設定したリスクを守ることができます。 Lot calc ボタン - リスク 計算 を 有効 / 無効 にします 。 Risk フィールドでは 、必要 なリスクの 値 を 0 から 100 までのパーセンテージまたは 預金通貨 で 設定 します 。 設定」 タブで 、 リスク 計算 の 種類 を 選択 します :
価格が一瞬で変わる可能性のある市場では、注文はできるだけ簡単にすべきだと思いますか? Metatraderでは、注文を開くたびに、開始価格を入力し、損失を止めて利益を得るウィンドウと、取引サイズを開く必要があります。金融市場の取引では、初期預金を維持し、それを増やすために資本管理が不可欠です。それで、あなたが注文をしたいとき、あなたはおそらくあなたがどれくらいの大きさの取引を開くべきか疑問に思いますか?この単一の取引であなたの預金の何パーセントを危険にさらすべきですか?この取引からどれだけの利益を得ることができますか?また、リスクに対する利益の比率はどのくらいですか?トレードサイズを設定する前に、トレードサイズがどうあるべきかという質問に対する答えを得るために必要な計算を行います。 これらすべてを自動的に行うツールがあると想像してみてください。チャートを開き、市場分析を行い、エントリーポイント、ディフェンスポイント(ストップロス)、ターゲット(テイクプロフィット)を水平線でマークし、最後にリスクのレベルを定義します。利用可能な資本の%として、このトランザクションで負担することができ、こ
Local Trade Copier EA MT4
Juvenille Emperor Limited
5 (81)
Local Trade Copier EA MT4 による、驚くほど高速な取引コピーを体験してください。1分で簡単にセットアップできるこの取引コピー機は、同じWindowsコンピュータまたはWindows VPS上の複数のMetaTrader端末間で取引をコピーすることができ、0.5秒未満の高速コピースピードを実現します。 初心者であろうとプロのトレーダーであろうと、 Local Trade Copier EA MT4 には、あなたの特定のニーズに合わせてカスタマイズするための幅広いオプションが用意されています。これは、利益の可能性を高めたい人にとって究極のソリューションです。 今すぐ試してみて、これが市場で最も速くて簡単なトレードコピー機である理由を理解してください。 ヒント: デモアカウントで Local Trade Copier EA MT4 デモバージョンをダウンロードして試すことができます: ここ ダウンロードした無料のデモ ファイルを MT4 >> ファイル >> データ フォルダを開く >> MQL4 >> Experts フォルダに貼り付けて、ターミナルを再起動し
MT4 to Telegram Signal Provider は使いやすく、完全にカスタマイズ可能なツールで、Telegramに信号を送信し、あなたのアカウントを信号提供者に変えることができます。 メッセージのフォーマットは 完全にカスタマイズ可能です! しかし、簡単な使用のために、あらかじめ定義されたテンプレートを選択し、メッセージの特定の部分を有効または無効にすることもできます。 [ デモ ]   [ マニュアル ] [ MT5バージョン ] [ Discordバージョン ] [ Telegramチャンネル ] セットアップ ステップバイステップの ユーザーガイド が利用可能です。 Telegram APIの知識は必要ありません。開発者が必要なものをすべて提供します。 主要機能 購読者に送信される注文の詳細をカスタマイズする機能 例えばブロンズ、シルバー、ゴールドなど、階層型のサブスクリプションモデルを作成できます。ゴールドサブスクリプションでは、すべての信号が得られますなど。 ID、シンボル、またはコメントによる注文のフィルタリング 注文が実行されたチャート
The product will copy all telegram signal to MT4   ( which you are member  ) , also it can work as remote copier.  Easy to set up, copy order instant, can work with almost signal formats, image signal, s upport to translate other language to English Work with all type of channel or group, even channel have "Restrict Saving Content", work with  multi channel, multi MT5 Work as remote copier: with signal have ticket number, it will copy exactly via ticket number. Support to backtest signal. How to
Tired of complex order placement and manual calculations? Trade Dashboard is your solution. With its user-friendly interface, placing orders becomes effortless, by a single click, you can open trades, set stop loss and take profit levels, manage trade lot size, and calculate risk to reward ratios, allowing you to only focus on your strategy. Say goodbye to manual calculations and streamline your trading experience with Trade Dashboard. Download   demo version  right now. You can find details
Exp COPYLOT CLIENT for MT4
Vladislav Andruschenko
4.66 (68)
MetaTrader4のコピー機を取引します。     それは任意の口座からの外国為替取引、ポジション、注文をコピーします。 それは最高の貿易コピー機の1つです     MT4 - MT4、MT5 - MT4     のために     COPYLOT MT4     バージョン(または     MT4 - MT5  MT5 - MT5     のために     COPYLOT MT5     バージョン)。 MT5のバージョン 完全な説明   +DEMO +PDF 購入する方法 インストールする方法     ログファイルの取得方法     テストと最適化の方法     Expforex のすべての製品 のコピー機 バージョン       MetaTrader 5 ターミナル(   МТ5 - МТ5、МТ4 - МТ5   )-   コピーロットクライアントMT5 独自のコピーアルゴリズムにより、すべての取引がマスターアカウントからクライアントアカウントに正確にコピーされます。 また、動作速度が速いことでも知られています。タフなエラー処理。 強力な機能セット。 プログ
I present to your attention a powerful utility for predicting the future movement of an asset based on W.D. Ganna’s law of vibration. This utility analyzes the selected market model and provides codes for future possible market movement patterns. If you enter the selected code into the appropriate box, you will receive a forecast of the potential market movement. The utility has the ability to display several potential forecast models. The forecast is not yet tied to time and price and gives th
Trade Manager は、リスクを自動的に計算しながら、取引を迅速に開始および終了するのに役立ちます。 過剰取引、復讐取引、感情的な取引を防止する機能が含まれています。 取引は自動的に管理され、アカウントのパフォーマンス指標はグラフで視覚化できます。 これらの機能により、このパネルはすべてのマニュアル トレーダーにとって理想的なものとなり、MetaTrader 4 プラットフォームの強化に役立ちます。多言語サポート。 MT5バージョン  |  ユーザーガイド + デモ Trade Manager はストラテジー テスターでは機能しません。 デモについてはユーザーガイドをご覧ください。 危機管理 % または $ に基づくリスクの自動調整 固定ロットサイズを使用するか、ボリュームとピップに基づいた自動ロットサイズ計算を使用するオプション RR、Pips、または価格を使用した損益分岐点ストップロス設定 トレーリングストップロス設定 目標に達したときにすべての取引を自動的に終了するための 1 日あたりの最大損失 (%)。 過度のドローダウンからアカウントを保護し、オーバートレードを防ぎま
あなたがメンバーである任意のチャンネル(プライベートおよび制限されたチャンネルを含む)からのシグナルを、直接あなたのMT4にコピーします。 このツールは、ユーザーを念頭に置いて設計されており、取引を管理および監視するために必要な多くの機能を提供しています。 この製品は、使いやすく視覚的に魅力的なグラフィカルインターフェースで提供されています。設定をカスタマイズして、数分で製品を使用開始できます! ユーザーガイド + デモ  | MT5版 | Discord版 デモを試したい場合は、ユーザーガイドを参照してください。 Telegram To MT5レシーバーは、ストラテジーテスターでは機能しません! Telegram To MT4の特長 一度に複数のチャンネルからシグナルをコピー プライベートおよび制限されたチャンネルからシグナルをコピー BotトークンやチャットIDは不要です(必要な場合は引き続き使用できます) リスク%または固定ロットを使用して取引 特定のシンボルを除外 すべてのシグナルをコピーするか、コピーするシグナルをカスタマイズするかを選択 すべてのシグナルを認識する
TradePanel MT4
Alfiya Fazylova
4.91 (88)
Trade Panel は、多機能の取引アシスタントです。 このアプリケーションには手動取引用の 50 以上の機能が含まれており、ほとんどの取引アクションを自動化できます。 購入する前に、デモ アカウントでデモ バージョンをテストできます。 デモは こちら から。 詳しい手順は こちら をご覧ください。 取引。 ワンクリックで基本的な取引操作を実行できます。 未決の注文とポジションをオープンする 未決の注文とポジションを決済する ポジションの反転(買いを閉じて売りをオープンする、または売りを閉じて買いをオープンする) ポジションをロックする(反対のポジションをオープンすることで、売りポジションと買いポジションの量を等しくします) すべてのポジションを部分的に決済します。 すべてのポジションのテイクプロフィットやストップロスを共通のレベルに設定します。 すべてのポジションのストップロスを損益分岐点レベルに設定します。 注文とポジションをオープンする際に、次のことが可能になります。 確立されたリスクに応じて取引量の自動計算を使用します。 ワンクリックで複数の注文を開きます。 計算された数量
Trade copier MT4
Alfiya Fazylova
4.68 (31)
Trade Copierは、取引口座間の取引をコピーして同期するように設計された専門的なユーティリティです。 コピーは、同じコンピューターまたはvps にインストールされている、サプライヤーのアカウント/端末から受信者のアカウント/端末に行われます。 購入する前に、デモ アカウントでデモ バージョンをテストできます。 デモ版 こちら 。 詳細な説明は こちら 。 主な機能と利点: MT5ネッティングアカウントを含む、MT4> MT4、MT4> MT5、MT5> MT4のコピーをサポートします。 高いコピー速度(0.5秒未満)。 ベンダーモードと受信者モードは同じ製品内に実装されています。 チャートから直接リアルタイムでコピーを制御できる、簡単で直感的なインターフェイス。 接続が切断されたり、端末が再起動されたりしても、設定と位置が失われることはありません。 コピーするシンボルを選択できます。また、受信者のシンボルを置き換えることもできます(例:EURUSD> USDJPY)。 バックコピーをサポートします。 特定の注文のみのコピーを有効にする機能。 取引開始価格の最大差と最大遅延時間を
この製品は、ニュースタイム中にすべてのエキスパートアドバイザーと手動チャートをフィルタリングするため、急激な価格変動によるマニュアルトレードのセットアップの破壊や他のエキスパートアドバイザーによって入力された取引について心配する必要はありません。この製品には、ニュースのリリース前にオープンポジションとペンディングオーダーを処理できる完全な注文管理システムも付属しています。 The News Filter  を購入すると、将来のエキスパートアドバイザーのためにビルトインのニュースフィルターに頼る必要はなく、今後はすべてのエキスパートアドバイザーをここからフィルタリングできます。 ニュース選択 ニュースソースは、Forex Factoryの経済カレンダーから取得されます。 USD、EUR、GBP、JPY、AUD、CAD、CHF、NZD、CNYなど、任意の通貨数に基づいて選択できます。 Non-Farm(NFP)、FOMC、CPIなどのキーワード識別に基づいて選択することもできます。 影響レベルによってフィルタリングするニュースを選択することができ、低、中、高の影響範囲から選択できます
あなたの外国為替ポートフォリオを管理してください。あなたが立っている場所、何が働いているのか、そして何があなたに痛みを引き起こしているのかを即座に見てください! ここで利用可能なMT5バージョン:https:// www.mql5.com/en/market/product/58658 Trade Managerダッシュボードは、外国為替市場での現在の各ポジションが一目でわかるように設計されており、リスク管理と通貨へのエクスポージャーを理解しやすくします。 複数のポジションで徐々に市場に参入するトレーダー、またはそれらのトレーディンググリッドとバスケット戦略にとって、これは重要な情報です。ターミナル内の複数の位置を監視することは、管理が難しいことがよくあります。 不十分なリスクの活用と使用:報酬は、新しいトレーダーや一部の経験豊富なトレーダーが直面する主要な問題です。トレードマネージャーは、各通貨へのエクスポージャーを個別に示し、一度に両方向に取引しないようにします。 特徴: オープントレード-通貨ペアでソートされた現在のオープントレードをすべて表示します。ペアだけでなく
Strategy Builder offers an incredible amount of functionality. It combines a trade panel with configurable automation (covert indicators into an EA), real-time statistics (profit & draw down) plus automatic optimization of SL, TP/exit, trading hours, indicator inputs. Multiple indicators can be combined into an single alert/trade signal and can include custom indicators, even if just have ex4 file or purchased from Market. The system is easily configured via a CONFIG button and associated pop-up
Equity Shield
Vladimir Stepanov
4.63 (8)
Expert Advisor は、資産を常に監視し、パラメーターの入力に従ってルールに従うことで、予期しない損失からアカウントを保護します。 ルールに違反すると、EA はすべての取引を終了します。 特定のパーセンテージまたは金銭的損失ですべての取引をクローズするか、特定のパーセンテージまたは金銭的利益でクローズするように EA を設定できます。 このユーティリティは、プロップ トレーディング チャレンジでドローダウンを低く抑え、エクイティを保護するのに非常に役立ちます。 私の信号と他の製品はここにあります 応援、プレゼントは購入後ご連絡ください。 パラメーター: 1ペア限定:運用したいペアにEquity Guardを貼る アカウントのすべてのペアについて: Equity Shield は端末のすべてのペアを制御します (Equity Shield を任意のペアに配置します)。 TPアットマネー(0:OFF):TPインマネー SL アット マネー (0: オフ): SL アット マネー TP at % at account Equity: TP は、口座の X パーセントの利益で取
VirtualTradePad mt4 Extra
Vladislav Andruschenko
4.86 (63)
ワンクリックで取引できるトレーディングパネル。ポジションと注文の操作!チャートまたはキーボードから取引。 手動取引用の取引パネル。チャート(チャートウィンドウ)またはキーボードから取引できます。開閉、リバース、ロックポジションと注文を処理する МetaТrader4のメインオーダーのトレーディングコントロールパネル:売買、売却、売却、売却、売却、閉じる、削除、修正、トレーリングストップ、ストップロス、takeproft MT5のバージョン 完全な説明   +DEMO +PDF 購入する方法 インストールする方法     ログファイルの取得方法     テストと最適化の方法     Expforex のすべての製品 シンボルウィンドウからの取引とキーボードからの取引! あなたはMetaTrader 4ターミナル - バーチャルコントロールパネルVirtualTradePadのためのユニークなプラグインを持っています。 Description on English 注意!  ストラテジーテスターの 取引方法を学びたい場合は、無料の TesterPad ユーティリティをチェック
The Expert Advisor will help you forward all pop-up alert with screenshot from  MetaTrader 4 to Telegram channel/ group, also forward all notifications to Telegram. Parameters  -  Telegram Bot Token - create bot on Telegram and get token.  -  Telegram Chat ID  - input your Telegram user ID,  group / channel ID  -  Forward Alert - default true, to forward alert.  -  Send message as caption of Screenshot - default false, set true to send message below Screenshot  How to setup and guide  - Telegram
MULTIPLE ORDERS With Symbol and Time Frame Changer Multiple Orders Utility is created to give easy profits-making trades with a little movements and without going long distance to get it all. This Utility opens multiple orders as many trades as the number specified by the User or as many as permitted by your Broker in the same direction on the same currency pair simultaneously. The idea behind it, is that instead of running after 100 - 200 pips which may not likely be attainable in the re
プライスアクションツールキットEAは主にスカルパー向けに設計されていますが、すべての時間枠で使用して、ストップレベルに基づいて正しく計算されたロットサイズで市場に迅速に参入できます。注文)そして市場が動くにつれてストップを調整して利益を上げます。 使用するすべての機能、設定、およびベストプラクティス戦略の完全なリストについては、ここをクリックしてください:https:// www.mql5.com/en/blogs/post/748072 リスクベースのエントリ クイックオーダーボタンを使用すると、アカウントのリスクの割合に基づいてポジションに移動できます。選択したリスクとストップロスまでの距離に基づいて、ロットサイズが自動的に計算されます。そのため、ブローカーが0.01ロットのサイズ設定を使用できることを確認する必要があります。0.10または1.00のロット増分を使用するように強制された場合、ブローカーは機能しません。 高速取引実行ボタン チャート上にクイックトレード実行ボタンを配置し、トレードを即座に自動的に開いたり、閉じたり、調整したりします。通常のエントリーボタン
Mentfx Mmanage
Anton Jere Calmes
5 (16)
The added video will show you the full functionality, effectiveness, and simplicity of this trade manager. Drag and Drop Trade Manager. Draw your entry and have the tool calculate the rest. Advanced targeting and close portions of a trade directly available in tool (manage trades while you sleep). Market order or limit order on either side with factored spread. Just draw the entry, the tool does the rest. Hotkey setup to make it simple. Draw where you want to enter, and the stop loss, the tool c
多機能ツール 搭載機能: ロット計算機、プライスアクション、リスク/リワードレシオ、トレードマネージャー、需要供給ゾーンなどをはじめ65以上の機能。 バージョ:デモ版   |   ユーザーマニュアル   |    MT5版 このユーティリティはストラテジー テスターでは機能しません。 ここからデモ バージョンをダウンロードして製品をテストできます。 ご不明な点や改善提案、バグの発見などございましたら、 連絡してください 。 取引プロセスを簡素化、高速化、自動化します。このダッシュボードで標準端末機能を拡張します 1. 新しい取引を開始します : ロット / リスク / RR の計算 1. Lot計算機(リスクサイズに基づく取引量計算 2. リスク計算機(ロットサイズに基づくリスク量) 3. リスク/リワードレシオ (R/R) 4. 注文のアクティベーション トリガー + Buy StopLimit / Sell StopLimit: MT4でも可  5. 仮想 SL / TP レベル (隠しSL、TP: ブローカーには見えない) 6.  Smart SL / エントリー レ
取引パネルは注文の管理に限定されています - ボタンを使用して開かれたものと、ユーザーによって開かれたものの両方です。 シンプルで便利なコレクション。 バイヤーを補完します。 Gold Stuff インジケーターと併用することをお勧めします。 単一注文として取引を設定し、距離のあるグリッドを構築します。 標準グリッドを作成するには、10000 などの大きな距離を設定するだけです。 リアルタイム結果はこちらからご覧いただけます。 設定と個人的なボーナスを得るために、購入後すぐに私に連絡してください!   設定 新しいシリーズを開く - 注文の新しいシリーズのオン/オフの開始。 Lot miltiplier - 次の注文のロット乗数。 TP - ピップで利益を得る。 SL - 最初の注文からのピップ単位のストップロス。 トレイル スタート - トレーリング ストップの有効化。 トレイル ステップ - トレーリング ストップを有効にしたときの価格からの距離。 DD 削減アルゴリズム - 利益のある最後の注文が損失のある最初の注文シリーズでクローズされる場合のドローダウン削減
FREE SIGNAL CHANEL:  https://t.me/redfox_daily_forex_signals Time saving and fast execution Whether you’re traveling or sleeping, always know that Telegram To Mt4 performs the trades for you. In other words, Our   Telegram MT4 Signal Trader  will analyze the trading signals you receive on your selected Telegram channels and execute them to your Telegram to MT4 account. Reduce The Risk Telegram To Mt4   defines the whole experience of copying signals from   Telegram signal copier to mt4  p
Easy Trade Manager
Anoop Sivasankaran
4.78 (37)
イージートレードマネージャー1.0 トレーダーとして成功するための最も重要な要素の一つである基本的な特徴。     1. TP1、TP2、TP3での本の利益     2.取引ごとに設定された金額に従ってリスクを管理します。例:100ドル(最大損失) - これはあなたの総資本の2%になります。     3. TP1、TP2、TP3で予約する金額(%)を設定します。例えば。 TP1で100ドルの50%、TP2で25%、TP3で25%     4. STOP-LOSSに基づいて自動的にLOT SIZEを選択してください。 (この機能を有効にするには、ロットサイズ=自動に設定してください)     5.最も重要なのは、TP1またはTP2で取引を自動的に損益分岐に設定することです。 (損益分岐= TP1 / TP2)     Plsはあなたが好きならEAと良いレビューを残す、改善するために私に提案を送る 上級ユーザー -     1. 2つの機能に基づいて自動的にトレイルストップロスを設定します(設定=はい/自動)。          -
Pro Arbitrage EA   trades based on Arbitrage Strategy. The strategy is like a scalping technology but on three cross currency pairs at the same time. Each trade basket involves three pairs (all open at the same time) and they will close at once when any desired profit reaches. The strategy has no SL technically because all opened currencies are hedged. SL can happen if high slippages on order execution on the broker side. So the strategy is one of the safest ones in the world. MT4 Limitation :
このユーティリティを使用すると、マスター設定のある端末からスレーブ設定の他の端末にトランザクションをコピーできます 同時に、コピーするペアを選択し、いくつかのパラメータに従ってコピーされた順序のサイズを設定することができます。 ドローダウン損失制限を設定するか、収益性の高い取引のみをコピーします あなたは、他のブローカーのMT4またはMT5にMT4またはMT5から取引をコピーすることができます これで、MT4で作業している専門家の信号をMT5端末にコピーするか、またはバックすることは難しくありません コピーマスターを使用して、他のシグナル、Expert Advisors、手動取引から任意の取引をコピーします。  設定を使用して、ロットサイズ、取引方向を変更し、収益性の高い取引のみをコピーし、預金を保存するための値を設定することができます  コピーマスターは、一つのアカウント上の異なるサブスクリプションシグナルのいくつかの戦略を組み合わせることができます 取引をMT4にコピーするには、コピーマスター MT5バージョンが必要です。 https://www.
Don't purchase before testing the Demo version first. DEMO version:   https://www.mql5.com/en/market/product/76917 __________________________________________________ This EA  - Tool allow you replay bar in Meta Trader 4 for back test. This Tool can back test in multi timeframe in only one chart. This Tool is very useful for Price action trader. It can work with Indicators, some indicators cannot works. So please download Demo to test before purchase.  Demo Version We do not accept refund in any
The top-selling EAs on the market cost a lot and one day they are suddenly gone. This is because one strategy will not work in the forex market all the time. Our product is unique from all others in the MQL Marketplace because our EA comes with 34+ built-in indicators that allow adding more strategies every time.  You build your strategy and keep updating it. If one strategy does not work, simply build another all using only one EA. This is All-In-One EA in this market place. You can use as trad
MT4端末のための事前設定された注文と自動ロット計算と取引パネル。 注意:ストラテジーテスターではトレーディングパネルは機能しません(トレーリングストップのテストのみ)。 マニュアル, 説明, ライトデモのダウンロード. 成功したトレーダーは、自己規律と有能なお金の管理によって区別されます。 固定ロットを使用すると、危険にさらされます。 結局のところ、異なる時間枠には異なる距離があり、1つの不採算取引がいくつかの収益性の高い取引をカバーすることができます。 各トランザクションのストップロスが預金の1%を超えないように自動ロットを使用する場合は、この問題を解決します。 また、トレーダーは部分的な閉鎖、損益分岐点への取引の移転、トレーリングストップを使用し、チャート上の過去の取引を分析します。 十分なニュアンスがあるので、私は取引パネルを書くことにしました。 私の好みのために、それは非常に機能的で快適であることが判明しました。 取引パネルの機能 。 任意のアカウントと通貨での作業 。 ロット計算のための注文の視覚的なプリセット 。 ロット計算のための保留中の注文の視覚的なプリセット 。
作者のその他のプロダクト
The script creates account summary report in a separate window. The report can be created for all deals and on deals for selected financial instruments. It is possible to specify a time interval of calculation and save report to htm-file. The script creates account summary report in a separate window. The report can be created for all deals and for deals of the selected financial instruments. It is possible to specify a time interval of calculation and save report to htm-file. Input paramet
The Bollinger Bands indicator drawn using a tick chart. After launching it, wait for enough ticks to come. Parameters: Period - period of averaging. Deviation - deviation from the main line. Price levels count - number of displayed price levels (no levels are displayed if set to 0). Bar under calculation - number of bars on the chart for the indicator calculation. Buffer indexes: 0 - BASE_LINE, 1 - UPPER_BAND, 2 - LOWER_BAND, 3 - BID, 4 - ASK.
The Relative Strength Index indicator drawn using a tick chart. After launching it, wait for enough ticks to come. Parameters: RSI Period - period of averaging. overbuying level - overbought level. overselling level - oversold level. calculated bar - number of bars on the chart for the indicator calculation. The following parameters are intended for adjusting the weight of RSI signals (from 0 to 100). You can find their description in the Signals of the Oscillator Relative Strength Index section
Ticks Bars
Andrej Nikitin
4 (6)
This tick indicator draws synthetic bars/candlesticks that contain a definite number of ticks. Parameters: option prices - price option. It can be Bid, Ask or (Ask+Bid)/2. the number of ticks to identify Bar - number of ticks that form OHLC. price levels count - number of displayed price levels (no levels are displayed if set to 0 or a lower value). calculated bar  - number of bars on the chart. Buffer indexes: 0 - OPEN, 1 - HIGH, 2 - LOW, 3 - CLOSE.
FREE
The script creates account summary report in a separate window. The report can be created for all deals and for deals on selected financial instruments. It is possible to specify a time interval of calculation and save report to an htm file. Script inputs report starting date - initial report generation date. symbols selection for report - select a method of choosing tools for a report generation. allSymbol - report is generated for deals performed on all symbols. onlyCurrentSymbol - report
Ticks
Andrej Nikitin
4 (6)
A simple tick indicator of Bid and Ask prices. The period separator (1 minute) is displayed as a histogram. Parameters Show Bid Line - show/hide the Bid line; Show Ask Line - show/hide the Ask line; Show Labels - show/hide the last price values.
FREE
This utility is used to visually choose an indicator for trailing stop and select its parameters. The Expert Advisor modifies the Stop Loss order position opened for the instrument of the current chart based on indicator values. Uses indicators Parabolic SAR , NRTR (Nick Rypock Trailing Reverse) , Moving Average or linear regression channel. The indicators are added to or removed from the chart using the 'show' checkbox. The following options are available: Parabolic - trailing stop based on t
Tick
Andrej Nikitin
4.33 (3)
A simple tick indicator of Bid and Ask prices. The period separator (1 minute) is displayed as a histogram. Parameters Price_levels_count - number of price levels to be displayed. Bar_under_calculation - number of bars of the indicator to be displayed on the chart.
FREE
The indicator draws two simple moving averages using High and Low prices. The MA_High line is displayed when the moving average is directed downwards. It can be used for setting a stop order for a sell position. The MA_Low line is displayed when the moving average is directed upwards. It can be used for setting a stop order for a buy position. The indicator is used in the TrailingStop Expert Advisor. Parameters Period - period of calculation of the moving average. Deviation - rate of convergence
FREE
The scripts adds order tracing icons in the chart window. Trace orders are similar to the standard terminal tracing. Icons are added for both closed orders and current (market) orders. The Days of history to check parameter means the depth of the order history to be traced (number of days). If the parameter value = 0, all orders in the available history will be traced.
FREE
The Relative Strength Index indicator drawn using a tick chart. After launching it, wait for enough ticks to come. Parameters: RSI Period - period of averaging. overbuying level - overbought level. overselling level - oversold level. calculated bar - number of bars on the chart for the indicator calculation. The following parameters are intended for adjusting the weight of RSI signals (from 0 to 100). You can find their description in the Signals of the Oscillator Relative Strength Index section
The Envelopes indicator drawn using a tick chart. After launching it, wait for enough ticks to come. Parameters: Averaging period - period of averaging. Smoothing type - type of smoothing. Can have any values of the enumeration ENUM_MA_METHOD . Option prices - price to be used. Can be Ask, Bid or (Ask+Bid)/2. Deviation of boundaries from the midline (in percents) - deviation from the main line in percentage terms. Price levels count - number of displayed price levels (no levels are displayed if
The Stochastic Oscillator indicator is drawn on the tick price chart. After launching it, wait for enough ticks to come. Parameters: K period - number of single periods used for calculation of the stochastic oscillator; D period - number of single periods used for calculation of the %K Moving Average line; Slowing - period of slowing %K; Calculated bar - number of bars in the chart for calculation of the indicator. The following parameters are intended for adjusting the weight of signals of the
The Moving Average Convergence/Divergence(MACD) indicator drawn using a tick chart. After launching it, wait for enough ticks to come. Parameters: Fast EMA period - indicator drawn using a tick chart. Slow EMA period - slow period of averaging. Signal SMA period - period of averaging of the signal line. calculated bar - number of bars on the chart for the indicator calculation. The following parameters are intended for adjusting the weight of MACD signals (from 0 to 100). You can find their desc
The Bollinger Bands indicator drawn using a tick chart. After launching it, wait for enough ticks to come. Parameters: Period - period of averaging. Deviation - deviation from the main line. Price levels count - number of displayed price levels (no levels are displayed if set to 0). Bar under calculation - number of bars on the chart for the indicator calculation. Buffer indexes: 0 - BASE_LINE, 1 - UPPER_BAND, 2 - LOWER_BAND, 3 - BID, 4 - ASK.
The Moving Average of Oscillator(OsMA) indicator drawn using a tick chart. After launching it, wait for enough ticks to come. Parameters: Fast EMA period - fast period of averaging. Slow EMA period - slow period of averaging. Signal SMA period - period of averaging of the signal line. calculated bar - number of bars for the indicator calculation.
The Commodity Channel Index(CCI) indicator drawn using a tick chart. After launching it, wait for enough ticks to come. Parameters: period - number of single periods used for the indicator calculation. calculated bar - number of bars for the indicator calculation. The following parameters are intended for adjusting the weight of CCI signals (from 0 to 100). You can find their description in the Signals of the Commodity Channel Index section of MQL5 Reference. The oscillator has required directio
The Average Directional Movement Index indicator drawn using a tick chart. After launching it, wait for enough ticks to come. Parameters: Period - period of averaging. Сalculated bar - number of bars on the chart for the indicator calculation. Buffer indexes: 0 - MAIN_LINE, 1 - PLUSDI_LINE, 2 - MINUSDI_LINE.
The Standard Deviation (StdDev) indicator drawn using a tick chart. After launching it, wait for enough ticks to come. Parameters: Period - period of averaging. Method - method of averaging. calculated bar - number of bars for the indicator calculation.
The Momentum indicator drawn using a tick chart. After launching it, wait for enough ticks to come. Parameters: period - period of the indicator calculation. levels count - number of displayed levels (no levels are displayed if set to 0) calculated bar - number of bars for the indicator calculation.
The Bulls Power indicator drawn using a tick chart. After launching it, wait for enough ticks to come. Parameters: Period - period of averaging. The number of ticks to identify high/low - number of single ticks for determining high/low. Calculated bar - number of bars for the indicator calculation. The following parameters are intended for adjusting the weight of Bulls Power signals (from 0 to 100). You can find their description in the Signals of the Bulls Power oscillator section of MQL5 Refer
The  Bears Power indicator drawn using a tick chart. After launching it, wait for enough ticks to come. Parameters: Period - period of averaging. The number of ticks to identify high/low - number of single ticks for determining high/low. Calculated bar - number of bars for the indicator calculation. The following parameters are intended for adjusting the weight of Bears Power signals (from 0 to 100). You can find their description in the Signals of the Bears Power oscillator section of MQL5 Refe
The  Average True Range (ATR)  indicator drawn using a tick chart. After launching it, wait for enough ticks to come. Parameters: ATR Period  - number of single periods used for the indicator calculation. The number of ticks to identify Bar  - number of single ticks that form OHLC. Price levels count  - number of displayed price levels (no levels are displayed if set to 0 or a lower value). price mode  - choice of prices under calculation (can be bid, ask or average). Сalculated bar  - number of
The  Williams' Percent Range (%R)  indicator drawn using a tick chart. After launching it, wait for enough ticks to come. Parameters: WPR Period  - period of the indicator. Overbuying level  - overbought level. Overselling level  - oversold level. price mode  - choice of prices under calculation (can be bid, ask or average). Сalculated bar  - number of bars for the indicator calculation. The following parameters are intended for adjusting the weight of WPR signals (from 0 to 100). You can find t
The  Price Channel  indicator drawn using a tick chart. After launching it, wait for enough ticks to come. Parameters: Period  - period for determining the channel boundaries. Price levels count  - number of displayed price levels (no levels are displayed if set to 0). price mode  - choice of prices under calculation (can be bid, ask or average). Bar under calculation  - number of bars on the chart for the indicator calculation. Buffer indexes: 0 - Channel upper, 1 - Channel lower, 2 - Channel m
Description: Abigail is a medium-term trading system making profit during the price rollback. The Expert Advisor has been optimized for working on EURUSD. However, it can successfully work with other currency pairs as well. You can examine the Expert Advisor's trading statistics for different brokers and symbols at MetaTrader 4 and MetaTrader 5 Trading Signals sections. Parameters: Risk management: enter volume - market entry volume. If the value is greater than 0 - number of lots, if less than
TimeFilter indicator allows you to visually select bit masks (GoodHourOfDay, BadHoursOfDay, GoodDayOfWeek, BadDaysOfWeek) for the  Intraday Time Filter  module of trading signals of the Standard Library. The use of time filters allows you to take into account the particulars of each trading session in performing trading operations.
The indicator is an inter-week hourly filter. When executing trading operations, the indicator allows considering time features of each trading session. Permissive and restrictive filter intervals are set in string form. The used format is [first day]-[last day]:[first hour]-[last hour]. See the screenshots for examples. Parameters: Good Time for trade - intervals when trading is allowed. Bad Time for trade - intervals when trading is forbidden. time filter shift (hours) - hourly shift. percent
TrailingStop 4
Andrej Nikitin
4.83 (6)
The Expert Advisor modifies the Stop Loss order position opened for the instrument of the current chart based on indicator values. Uses indicators Parabolic SAR ,  NRTR (Nick Rypock Trailing Reverse) ,  Moving Average  or linear regression channel. Switchable modes: Trailing stop only when in profit; Trailing stop only following the price; On every teak or on formed bars; Trailing for each order separately or for a total position. Has an option of "hidden stop", also you can exclude individual
フィルタ:
Mehdi Faraz Fard
2325
Mehdi Faraz Fard 2020.07.10 23:30 
 

ユーザーは評価に対して何もコメントを残しませんでした

Rodrigo da Silva Boa
7136
Rodrigo da Silva Boa 2016.01.07 13:02 
 

ユーザーは評価に対して何もコメントを残しませんでした

レビューに返信
バージョン 1.10 2020.01.05
Added the ability to manage (hide / show) order icons.