• 概要
  • レビュー
  • コメント (8)
  • 最新情報

PolarizedFractalEfficiency

The Polarized Fractal Efficiency (PFE) was introduced by Hans Hannula in 1994. The indicator was intended to quantify the efficiency of price movement and  how trendy or choppy  the recent past price action has been.

This is calculated by contrasting the price traveled in the window of study  against the total accumulation of movements during the same period of time.

For example: If in 10 days, an active raised from 50 to 100, by increasing it's value 5 points or dollars each session, the efficiency of the rise is greater than if the very same distance is traveled by, rising 10 on the first session, losing 7 on the following day, then, gaining 30, falling 20 the next day, recovering 30 then after retracing 15 and so forth. (10+7+30+20+30+15...etc).

According to Hans Hannula, PFE readings above zero indicates that the trend has been up. The higher the PFE the more efficient the upward movement. Conversely, PFE reading below zero indicate the price trend has been down, and the lower the PFE the more efficient the downward movement.

Readings near zero indicate price congestion, choppy, trend less, meaning inefficient movement. 

PFE has low sensitivity to the size of the  movements but remarks how direct the price movement is.

The base parameters are 10 for the length and 5 for the smoothing. The indicator can change the smoothing procedure (simple, exponential, smoothed and linear weighted) exponential is the original preference. 

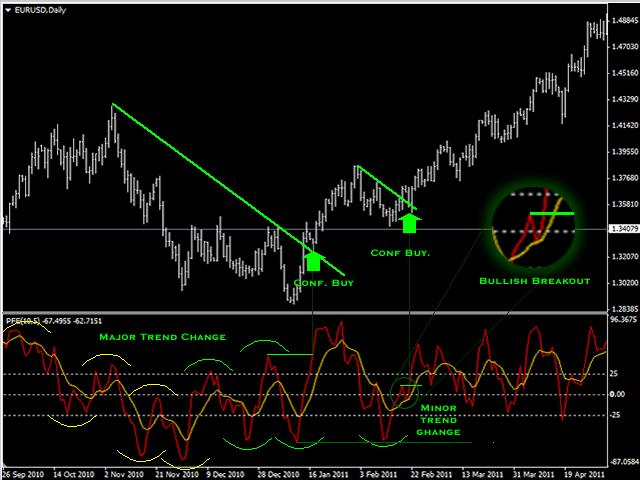
 As any oscillator it can generate signals with the trend of the oscillator by it self, the cross with it's moving average, divergences, etc.

For example if the PFE change it's trend while its above zero (better if near 100) this favors the decline. Conversely if the PFE change it's trend while is below zero (better if near -100) this is considered good for price to rise.

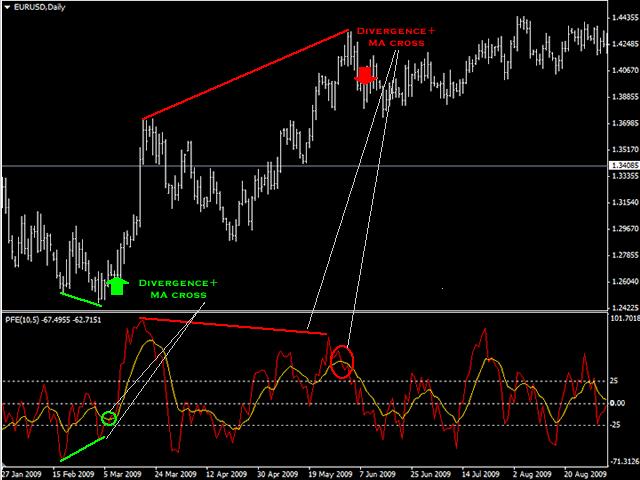
Other example is, when the PFE cross it's moving average from up to down, while is above the zero, and after showing divergence, this could be a good time to look for sells, or if the PFE cross it's moving average from down to up, while is below the zero and after show divergence, this could be a good time to think about buys.

See the screenshots for visual reference. 

おすすめのプロダクト
The Cycle Identifier MT4 indicator is a great choice of custom indicator for both short-term and long-term traders. The Cycle Identifier MT4 generates filtered price action signals to assist traders to identify when the conditions are right to open buy and sell positions. How it works The Cycle Identifier MT4 indicator displays on a separate indicator chart below the main chart where it draws an oscillating gray line. This gray line is characterized by upward and downward spikes that are accompa
The indicator detects divergence signals - the divergences between the price peaks and the MACD oscillator values. The signals are displayed as arrows in the additional window and are maintained by the messages in a pop-up window, e-mails and push-notifications. The conditions which formed the signal are displayed by lines on the chart and in the indicator window. Indicator Parameters MacdFast - fast MACD line period MacdSlow - slow MACD line period MacdSignal - MACD signal line period MacdPri
Fibonacci retracement is one of the most reliable and used technical analysis tools for trading. It uses the so called “golden ratio” to predict certain levels of support (price movement reverses from downward to upward) and resistance (price movement reverses from upward to downward) which is a mathematical pattern seen through out nature and even the universe. Because so many traders make use of this trading strategy and watch these price levels, more often than not the Fibonacci levels become
MT4 用 Forex インジケーター アキュムレーション バー パターン インジケーター「アキュムレーション バー」は、価格アクション取引用の非常に強力なブレイクアウト重視のインジケーターです インジケーターは、1 つのバーの間に狭い領域で価格の蓄積を検出し、ブレイクアウトの方向、保留中の注文、SL の場所を表示します 強気のアキュムレーション バー - チャート上の青い矢印信号 (画像を参照) 弱気のアキュムレーション バー - チャート上の赤い矢印信号 (画像を参照) 再描画なし、遅延なし、高い R/R 比率 (報酬/リスク) インジケーターには調整可能な感度パラメーターがあります PC、モバイル、および電子メール アラートが含まれています インジケーター「アキュムレーション バー パターン」は、サポート/レジスタンス レベルと組み合わせるのに適しています // より優れたエキスパート アドバイザーとインジケーターは、こちらで入手できます: https://www.mql5.com/en/users/def1380/seller これは、この MQL5 Web サイトで
The indicator automatically draws up to five different regression channels. The product draws the channels for the previous major periods. For example : Indicator Chart Drawing Period M1 D1 M5 D1 M15 D1 M30 D1 H1 D1 H4 W1 It updates itself at the beginning of the major period (ex.: D1 or W1). The periods are in the major period domain. For example : if the indicator is put on H1 chart, the period of 1 means 1 day on the chart.
The Inside Bars indicator shows Inside Bars, the Breakout Zone and Breakouts thereof. Inside Bars are an important price action pattern. The price action of an Inside Bar is completely covered by the price action of the previous bar. Inside Bars are most often used on higher timeframes. Settings Inside Bars default settings are good enough most of the time. Feel free to fine tune them to your needs. ATR factor to skip large candles - very large candles should be filtered as they often cover othe
American traders say: “Trend is your friend”, which means “Trend is your friend”. And indeed it is! By trading with the trend, you reduce your risks and gain an advantage, as you increase the mathematical expectation of completed trades and, therefore, earn more profit. Together with the Going straight indicator you will trade with the trend with ease! This is one of the most effective ways to deal with market trends. Trading strategies using the channel indicator belong to the classic method
Ppr PA
Yury Emeliyanov
4.5 (2)
"Ppr PA" is a unique technical indicator created to identify "PPR" patterns on the currency charts of the MT4 trading platform. These patterns can indicate possible reversals or continuation of the trend, providing traders with valuable signals to enter the market. Features: Automatic PPR Detection:   The indicator automatically identifies and marks PPR patterns with arrows on the chart. Visual Signals:   Green and red arrows indicate the optimal points for buying and selling, respectively. A
FREE
Hello guys! I want to share with you a very simple but effective expert advisor. As we know, simplicity is often the key to success :) NB: Set the quality of the video on YouTube at 720p The expert advisor is based on the breaking of a moving average, with the confirmation of the closed candle, and the possibility of adding a trend parameter that confirms the trend and avoiding false signals. Let's see the parameters: TRADE PARAMETERS: Candle Shift Signal:  this is the main parameter optimize.
Fibonacci SR Indicator This indicator creates support and resistance lines. This indicator is based on Fibonacci Retracement and Extension levels. It will consider many combinations of the Fibonacci levels and draw support/resistance lines based on these. This indicator uses tops and bottoms drawn by the ZigZag indicator in its calculations. The ZigZag can also be drawn on the chart, if necessary. The indicator considers many combinations of past reversal points and Fibonacci ratio levels, and
FREE
Free automatic Fibonacci is an indicator that automatically plots a Fibonacci retracement based on the number of bars you select on the BarsToScan setting in the indicator. The Fibonacci is automatically updated in real time as new highest and lowest values appears amongst the selected bars. You can select which level values to be displayed in the indicator settings. You can also select the color of the levels thus enabling the trader to be able to attach the indicator several times with differe
FREE
Ultimate Breakout Scanner (Multi Pair And Multi Time Frame) :   ---LIMITED TIME OFFER: NEXT 25 CLIENTS ONLY ---46% OFF REGULAR PRICE AND 2 FREE BONUSES ---SEE BELOW FOR FULL DETAILS Breakout trading is one of the most popular trading approaches used in the institutional trading world. As it takes advantage of the never ending phenomena of price expansion and contraction (through volatility) . And this is how institutional traders are able to take advantage of explosive moves in the market .
This indicator shows: A green light in case the price goes up; A red light in case the price goes down; A yellow light in case there are a sideways trend. A sideways trend is the horizontal price movement that occurs when the forces of supply and demand are nearly equal. This typically occurs during a period of consolidation before the price continues a prior trend or reverses into a new trend
GMMA Trade X is an EA based on GMMA. GMMA parameters such as MovingAveragePeriod1-24, MovingAverageMAShift1-24, MovingAverageShift1-24 and CandlestickShift1-24 can be adjusted. GMMA Trade X applies BTN TECHNOLOGY's state-of-the-art intelligent technology to help you create optimal results for your trades. May your dreams come true through GMMA Trade X. Good luck. = == == Inquiries = == == E-Mail:support@btntechfx.com
The Blue Eagle indicator gives a signal of a trend change, showing signals. High probability of a successful trend, it can be used with an optimal risk to profit ratio. The indicator does not redraw and is not late; it can be used both for piping on small periods and for long-term trading. The Blue Eagle indicator is designed to analyze price movements with a given amplitude, displaying only the most important reversals, which greatly facilitates the evaluation of charts. The arrows show the
This indicator has been created for finding the probable reversal points of the symbol price. A small candlestick reversal pattern is used it its operation in conjunction with a filter of extremums. The indicator is not redrawn! If the extremum filter is disabled, the indicator shows all points that have a pattern. If the extremum filter is enabled, the condition works – if the history Previous bars 1 candles back contains higher candles and they are farther than the Previous bars 2 candle, such
FREE
MT4用外国為替インジケーター「サポートレジスタンスレベル」 インジケーター「サポートレジスタンスレベル」はトレードに非常に役立つ補助インジケーターです 「サポート」と「レジスタンス」は価格によって考慮されるチャート上の重要なゾーンです サポートレベルとは、価格が定期的に下落を止めて反発するレベルです。 レジスタンスレベルとは、通常、価格の上昇が止まり、再び下落する場所です。 インジケーター「サポート抵抗レベル」は、最近のレベルを示します。 抵抗レベル - 赤い線。 サポートレベル - 青い線 計算に使用するバーの数、線の種類、色は設定で調整できます インジケーター「サポートレジスタンスレベル」は、価格アクションパターンによるテイクプロフィットターゲット、価格反転、再テストを計画するのに最適です。 // さらに優れたエキスパートアドバイザーとインジケーターはここから入手できます: https://www.mql5.com/en/users/def1380/seller 当MQL5サイトのみでご提供しているオリジナル商品です。
StrikePin
Mike Pascal Plavonil
1 (1)
The StrikePin indicator is a technical, analytical tool designed to identify trend reversals and find optimal market entries.  The StrikePin indicator is based on the pin bar pattern, which is the Price Action reversal pattern. An entry signal, in a trending market, can offer a very high-probability entry and a good risk to reward scenario. Be careful: the indicator is repainting since it is looking for highest high and lowest lows.  You should avoid to use it in experts but you can use it
FREE
An indicator that determines the point levels of price resistance. The arrows indicate price bounces in the indicated directions. Arrows are not redrawn formed on the current candle, shown on the previous candle for convenience.      It has one setting - the formation intensity: If the parameter is smaller, most of the signals are formed in a wide trend. If the parameter is larger, signals are formed in a narrower trend. Input parameters Formation Intensity - Arrow Formation Intensity Num
This trend following system was designed by   Dennis Gartman   and   Bill Eckhart , and relies on breakouts of historical highs and lows to take and close trades: it is the complete opposite to the "buy low and sell high" approach. This trend following system was taught to a group of average and normal individuals, and almost everyone turned into a profitable trader. The main rule is   "Trade an N-day breakout and take profits when an M-day high or low is breached (N must me above M)" . Example
Or (KVO) determines the long-term trend of money flow while remaining sensitive enough to detect short-term fluctuations.It u ses the key price compared to the prior bar's key price to assign volume as positive or negative value. Volume is a measure of how many units of a pair are trading per unit of time.You can choose between a KVO line, histogram, or both combined with this Klinger Volme Oscillator.The Klinger Volume Oscillator is a trend reversal indicator. It relies on the concept of a vol
The main idea of this indicator is rates analysis and prediction by Fourier transform. Indicator decomposes exchange rates into main harmonics and calculates their product in future. You may use the indicator as a standalone product, but for better prediction accuracy there is another related indicator - FreqoMaster - which uses FreqoMeterForecast as a backend engine and combines several instances of FreqoMeterForecast for different frequency bands. Parameters: iPeriod - number of bars in the ma
トレンドキャッチャー: アラートインジケーター付きのトレンドキャッチャーストラテジーは、市場トレンドやポテンシャルなエントリーポイントやエグジットポイントを特定するのに役立つ多目的な技術分析ツールです。動的なトレンドキャッチャーストラテジーを備えており、市場状況に適応してトレンドの方向を明確に視覚化します。トレーダーは、自身の好みやリスク許容度に合わせてパラメーターをカスタマイズできます。このインジケーターはトレンドの識別を支援し、ポテンシャルなリバーサルをシグナルし、トレイリングストップのメカニズムとして機能し、市場への迅速な対応のためのリアルタイムアラートを提供します。 特徴: - トレンドの識別:上昇トレンドと下降トレンドをシグナルします。 - トレンドのリバーサル:ローソク足の色が上昇から下降に変わった場合やその逆の場合に、ポテンシャルなリバーサルを警告します。 - リアルタイムアラート:新しいトレンドの識別に対するアラートを生成します。 推奨事項: - 通貨ペア:EURUSD、AUDUSD、XAUUSDなど... - タイムフレーム:H1。 - アカウン
FREE
Day Trades Resistance and Support (daytradesSR) is an indicator composed of 1.  The main line (support/resistance line),  which shows i.    either UP or DOWN trend ii.  levels of dynamic support or resistance    2.     A specific range  defined by a line for range high and another line for range low.   These lines serve as weak secondary support or resistance .    3.   When the main line (support/resistance line) is first hit by the price after a detected trend reversal , either an UP ARROW (sup
The indicator detects and displays Shark harmonic pattern (see the screenshot). The pattern is plotted by the extreme values of the ZigZag indicator (included in the resources, no need to install). After detecting the pattern, the indicator notifies of that by a pop-up window, a mobile notification and an email. The indicator highlights the process of the pattern formation and not just the complete pattern. In the former case, it is displayed in the contour triangles. After the pattern is comple
This indicator works exactly the same as the Boundaries indicator, but here as a free demo that only shows the high and low of the week. As the Boundaries indicator does, this indicator can work with any symbol. In the Colors tab you can set the color for the Upper and Lower boundaries. Please review the pics or watch the Boundaries indicator video to better understand how it works.
Trend PA
Mikhail Nazarenko
5 (3)
The Trend PA indicator uses   Price Action   and its own filtering algorithm to determine the trend. This approach helps to accurately determine entry points and the current trend on any timeframe. The indicator uses its own algorithm for analyzing price changes and Price Action. Which gives you the advantage of recognizing, without delay, a new nascent trend with fewer false positives. Trend filtering conditions can be selected in the settings individually for your trading style. The indicator
The indicator detects and displays М. Gartley's Butterfly pattern. The pattern is plotted by the extreme values of the ZigZag indicator (included in the resources, no need to install). After detecting the pattern, the indicator notifies of that by the pop-up window, a mobile notification and an email. The pattern and wave parameters are displayed on the screenshots. The default parameters are used for demonstration purposes only in order to increase the amount of detected patterns. Parameters
TrendMaestro
Stefano Frisetti
5 (3)
note: this indicator is for METATRADER4, if you want the version for METATRADER5 this is the link:  https://www.mql5.com/it/market/product/108106 TRENDMAESTRO ver 2.4 TRENDMAESTRO recognizes a new TREND in the bud, he never makes mistakes. The certainty of identifying a new TREND is priceless. DESCRIPTION TRENDMAESTRO identifies a new TREND in the bud, this indicator examines the volatility, volumes and momentum to identify the moment in which there is an explosion of one or more of these data a
The indicator detects and displays the AB=CD harmonic pattern on the chart according to the scheme provided in the screenshot. The pattern is plotted by the extreme values of the ZigZag indicator (included in the resources, does not require additional installation). After detecting the pattern, the indicator notifies of that by the pop-up window, a mobile notification and an email. The indicator highlights not only the complete figure, but also the time of its formation. During the formation the
このプロダクトを購入した人は以下も購入しています
Gann Made Easy は、ミスター・ギャンの理論を使用した取引の最良の原則に基づいた、プロフェッショナルで使いやすい外国為替取引システムです。 W・D・ガン。このインジケーターは、ストップロスとテイクプロフィットレベルを含む正確な買いと売りのシグナルを提供します。 PUSH通知を利用して外出先でも取引可能です。 購入後はご連絡ください!私の取引のヒントと素晴らしいボーナスインジケーターを無料で共有します! おそらく、ギャンの取引手法についてはすでに何度も聞いたことがあるでしょう。通常、ギャンの理論は初心者のトレーダーだけでなく、すでにある程度の取引経験がある人にとっても非常に複雑なものです。なぜなら、ギャンの取引手法は理論的にはそれほど簡単に適用できるものではないからです。私はその知識を磨き、最良の原則を私の外国為替インジケーターに組み込むために数年を費やしました。 このインジケーターは非常に簡単に適用できます。必要なのは、それをチャートに添付し、簡単な取引推奨事項に従うだけです。このインジケーターは常に市場分析の仕事を行い、取引の機会を探します。適切なエントリーポイントを検出
- Real price is 80$ - 40% Discount ( It is 49$ now ) Contact me for instruction, add group and any questions! Related Product:  Bitcoin Expert , Gold Expert Introduction The breakout and retest strategy is traded support and resistance levels. it involves price breaking through a previous level.  The break and retest strategy is designed to help traders do two main things, the first is to avoid false breakouts. Many false breakouts start with a candlestick that breaks out of a level but ends wi
FX Volume
Daniel Stein
4.58 (33)
mql5と Telegramの モーニング・ブリーフィングで、詳細とスクリーンショットを含む毎日のマーケット・アップデートをご覧 ください! FX Volumeは、ブローカーの視点から市場のセンチメントをリアルに洞察する、最初で唯一の出来高インジケーターです。 ブローカーのような機関投資家が外国為替市場でどのようなポジションをとっているか、COTレポートよりもはるかに速く、素晴らしい洞察を提供します。 この情報をチャート上で直接見ることは、あなたの取引にとって真のゲームチェンジャーであり、画期的なソリューションです。 以下のようなユニークなマーケットデータ洞察から利益を得てください。 比率は 、通貨のロングポジションとショートポジションの比率をパーセントで表示します。 比率の変化は 、選択した期間内のロング比率とその変化率を表示します。 Volumes Totalは 、通貨の取引量(ロングとショート)の合計をロット単位で表示します。 Volumes Long :全通貨のロングポジションの取引量を表示します。 Volumes(ショート )は、全通貨のショートポジションの取引量を表示
現在20%OFF! 初心者やエキスパートトレーダーのためのベストソリューション! このダッシュボードソフトウェアは、28の通貨ペアで動作しています。それは私達の主要な指標(高度な通貨の強さ28と高度な通貨インパルス)の2に基づいています。それは全体の外国為替市場の大きい概観を与えます。それは、すべての(9)時間枠で28の外国為替ペアのための高度な通貨の強さの値、通貨の動きの速度と信号を示しています。チャート上で1つのインディケータを使用して市場全体を観察し、トレンドやスキャルピングの機会をピンポイントで見つけることができたら、あなたのトレードがどのように改善されるか想像してみてください。 このインディケータには、強い通貨と弱い通貨の識別、潜在的な取引の識別と確認がより簡単になるような機能が搭載されています。このインディケータは、通貨の強さや弱さが増加しているか減少しているか、また、すべての時間枠でどのように機能しているかをグラフィカルに表示します。 新機能として、現在の市場環境の変化に適応するダイナミックなマーケットフィボナッチレベルが追加され、すでに当社のAdvan
Gold Stuff
Vasiliy Strukov
4.89 (240)
Gold Stuff は、金専用に設計されたトレンド指標であり、あらゆる金融商品にも使用できます。 インジケーターは再描画せず、遅れません。 推奨時間枠 H1. それインディケータでフルオートExpert Advisor EA Gold Stuffが動作します。 あなたは私のプロフィールでそれを見つけることができます. 設定と個人的なボーナスを得るために、購入後すぐに私に連絡してください! トレンド スキャナーの強力なサポートを利用して、無料のインジケーターを入手し、プライバシーを守ります。あーみー!   設定 矢印を描く - オンオフ。 チャートに矢印を描く。 アラート - 可聴アラートのオンオフ。 メール通知 - オンオフ。 電子メール通知。 プチ通知 - オンオフ。 プッシュ通知。 次に、色域を調整します。 Gold Stuff は、金専用に設計されたトレンド指標であり、あらゆる金融商品にも使用できます。 インジケーターは再描画せず、遅れません。 推奨時間枠 H1. それインディケータでフルオートExpert Advisor EA Gold Stuff
まず第一に、この取引インジケーターは再描画されず、再描画されず、遅延しないことを強調する価値があります。これにより、手動取引とロボット取引の両方に理想的なものになります。 ユーザーマニュアル:設定、入力、戦略。 アトミックアナリストは、価格の強さとモメンタムを利用して市場でより良いエッジを見つけるためのPA価格アクションインジケーターです。ノイズや誤ったシグナルを除去し、取引ポテンシャルを高めるための高度なフィルターを備えています。複雑なインジケーターの複数のレイヤーを使用して、アトミックアナリストはチャートをスキャンし、複雑な数学的計算をシンプルなシグナルと色に変換します。これにより、どのような初心者トレーダーでも理解して使用し、一貫した取引の決定を行うことができます。 「アトミックアナリスト」は、新規および経験豊富なトレーダー向けにカスタマイズされた包括的な取引ソリューションです。プレミアムインジケーターとトップノッチの機能を1つの取引戦略に組み合わせ、すべてのタイプのトレーダーにとって汎用性のある選択肢にします。 デイリートレーディングとスキャルピング戦略:高
This indicator is based on the mathematics of the great trader W.D. Ganna. With its help, you can easily find strong levels by analyzing swings to find the optimal entry point. The indicator works on all instruments and all timeframes. The indicator is fully manual and has control buttons. All you need to do is press the NEW button, a segment will appear, which you can place on any movement, swing or even 1 candle that you want to analyze. By placing the segment, press the OK button. A grid (th
Dynamic Forex28 Navigator - 次世代の Forex 取引ツール。 現在 49% オフ。 Dynamic Forex28 Navigator は、長年人気のインジケーターを進化させたもので、3 つの機能を 1 つにまとめています。 Advanced Currency Strength28 インジケーター (レビュー 695 件)  + Advanced Currency IMPULSE with ALERT (レビュー 520 件) + CS28 コンボ シグナル (ボーナス)。 インジケーターの詳細 https://www.mql5.com/en/blogs/post/758844 次世代の Strength インジケーターが提供するもの  オリジナルで気に入っていたすべての機能が、新機能と精度の向上によって強化されました。 主な機能: 独自の通貨強度計算式。 すべての時間枠でスムーズかつ正確な強度ライン。 トレンドの特定と正確なエントリーに最適です。 ダイナミックマーケットフィボナッチレベル (マーケットフィボナッチ)。 このインジケー
mql5と Telegramの モーニング・ブリーフィングで、詳細とスクリーンショットを含む毎日のマーケット・アップデートをご覧 ください! FX Power MT4 NGは 、長年の人気を誇る通貨強度計FX Powerの次世代モデルです。 この次世代ストレングスメーターは何を提供するのでしょうか?初代FXパワーの魅力すべて プラス GOLD/XAUの強さ分析 より正確な計算結果 個別に設定可能な分析期間 カスタマイズ可能な計算上限値により、さらに優れたパフォーマンスを実現 もっと見たい人のための特別なマルチインスタンス設定 すべてのチャートでお好みの色を無限に設定可能 数え切れないほどの通知オプションにより、重要なことを見逃すことはありません。 Windows 11とmacOSのスタイルで角を丸くした新しいデザイン 魔法のように動くインジケーターパネル FXパワーの主な機能 すべての主要通貨の強さの完全な履歴 すべての時間枠における通貨の強さの履歴 すべてのブローカーとチャートで同一の計算結果 100%信頼できるリアルタイム計算 -> リペイントなし ドロップダウン・リストから
Trend Screener
STE S.S.COMPANY
4.81 (88)
トレンドインジケーター、1つのツールに組み込まれたすべての重要なトレンド機能を備えたトレンドトレーディングとフィルタリングのための画期的なユニークなソリューション! これは、すべてのシンボル/商品(外国為替、商品、暗号通貨、インデックス、株式)で使用できる100%再描画されていないマルチタイムフレームおよびマルチ通貨インジケーターです。 期間限定オファー: サポートおよびレジスタンス スクリーナー インジケーターは、たった 50 ドルで永久的にご利用いただけます。(元の価格 250 ドル) (オファー延長) トレンドスクリーナーは、チャート内のドットで矢印トレンドシグナルを提供するインジケーターに続く効率的なインジケーターです。 トレンド分析インジケーターで使用できる機能: 1.トレンドスキャナー。 2.最大利益分析を備えたトレンドライン。 3.トレンド通貨強度メーター。 4.アラート付きのトレンド反転ドット。 5.アラート付きの強いトレンドドット。 6.トレンド矢印 毎日の分析例、毎日のシグナルパフォーマンス...など、トレンドスクリーナーインジケーターを使用して、ここで見つけること
Trend Punch
Mohamed Hassan
4.95 (19)
This indicator is unstoppable when combined with our other indicator called  Support & Resistance . After purchase, send us a message and you will get it   for  FREE as a BONUS! Introducing Trend Punch , the revolutionary forex trend indicator that will transform the way you trade! Trend Punch is uniquely designed to provide precise buy and sell arrows during strong market trends, making your trading decisions clearer and more confident. Whether you're trading major currency pairs or exotic sym
Previous Price : $323.00 Current Price: $359.00 Future Price: Will increase soon NOTICE Please DO NOT buy this indicator if you are just learning about smart money movement . You need to have some experience with accumulation and distribution to fully grasp the gravity of this indicator. Since smart money does not play by the book , so this indicator was only developed to find their trail that they did not bother to hide . If the signals do not correspond to your trading style, this is not the
指示する     ロシア     -        utilizar con   el indicador の ESP 推奨事項 -   TPSpro トレンド プロフェッショナル版 -   MT5のバージョン 最も重要なことは、将来においても最も重要なことです。 機能のプリンシパル: ゾーンのほとんどは、ベンダーとコンプラドールによってアクティブ化されます。 状況を直感的に把握できるよう、初期の衝動を修正します。 LOGIC AI: MUESTRA zonas (círculos) parabuscar puntos de entrada cuando se activa una plantilla 視覚的に優れた視覚効果があり、最も重要な機能がすべて揃っていることに注意してください。 優れたニベレス/ゾーンの視覚化 (modo MTF) 世界で最も人気のある場所/ゾーンです。これを使用するのに最適な方法です (   TPSproTREND PRO   )。 アルゴリズム プロフェッショナル セパラド パソ ア パソ パラ オペラ それは、オペラハウスやコントラ・デ・エラの指導におい
ON Trade Waves Patterns Harmonic Elliot Wolfeをご紹介します。これは手動および自動の方法を使用して市場のさまざまなパターンを検出するために設計された高度なインジケーターです。以下はその動作方法です: ハーモニックパターン: このインジケーターは、チャートに表示されるハーモニックパターンを識別できます。これらのパターンは、Scott Carneyの「Harmonic Trading vol 1および2」で説明されているように、ハーモニックトレーディング理論を実践するトレーダーにとって重要です。手動で描画するか、自動検出に頼るかにかかわらず、ON Trade Waves Patternsがお手伝いします。 コントロールパネル: このインジケーターはユーザーフレンドリーなコントロールパネルを備えています。チャートと時間枠の設定を保存し、異なる構成間をスムーズに切り替えることができます。チャートスペースを最大限に活用するために最小化することもできます。他の分析ツールで作業することを好む場合、閉じるボタンをクリックするだけで、すべてのインジケーターデ
An exclusive indicator that utilizes an innovative algorithm to swiftly and accurately determine the market trend. The indicator automatically calculates opening, closing, and profit levels, providing detailed trading statistics. With these features, you can choose the most appropriate trading instrument for the current market conditions. Additionally, you can easily integrate your own arrow indicators into Scalper Inside Pro to quickly evaluate their statistics and profitability. Scalper Inside
Scalper Vault は、スキャルピングを成功させるために必要なすべてを提供するプロフェッショナルなスキャルピング システムです。このインジケーターは、外国為替およびバイナリー オプションのトレーダーが使用できる完全な取引システムです。推奨される時間枠は M5 です。 システムは、トレンドの方向に正確な矢印シグナルを提供します。また、トップとボトムのシグナルとギャン マーケット レベルも提供します。 インジケーターは、プッシュ通知を含むすべてのタイプのアラートを提供します。 インジケータの購入後にご連絡ください。私の個人的な取引の推奨事項と素晴らしいボーナス指標を無料で共有します! 幸せで有益な取引をお祈りします!
TPSpro TREND PRO は 、市場を自動的に分析し、トレンドとその各変化に関する情報を提供し、再描画せずに取引に参加するためのシグナルを提供するトレンド指標です。 インディケータは各ローソク足を使用し、個別に分析します。さまざまなインパルス(アップまたはダウンインパルス)を指します。通貨、仮想通貨、金属、株、指数の取引への正確なエントリーポイント! バージョンMT5                   インジケーターの完全な説明   インジケーター -   RFI LEVELS と併用することをお勧めします。 主な機能: レンダリングなしで正確な入力信号! シグナルが表示された場合、それは関連性を維持します。これは、シグナルを提供してからそれを変更する可能性があり、入金時の資金の損失につながる可能性があるリドローインジケーターとの重要な違いです。より高い確率と精度で市場に参入できるようになりました。矢印が表示された後、ターゲットに達する (利益確定) か反転シグナルが表示されるまで、ローソク足を色付けする機能もあります。 STOP LOSS / TAKE PROFIT
Stratos Pali Indicator   is a revolutionary tool designed to enhance your trading strategy by accurately identifying market trends. This sophisticated indicator uses a unique algorithm to generate a complete histogram, which records when the trend is Long or Short. When a trend reversal occurs, an arrow appears, indicating the new direction of the trend. Important Information Revealed Leave a review and contact me via mql5 message to receive My Top 5 set files for Stratos Pali at no cost! D
Reversal Sniper is designed to find the extreme reversals of the price. Indicator collects data of Cycle Sniper Indicator. NOTE: REVERSAL SNIPER Indicator is made for Cycle Sniper Users as an additional tool.  However, it can be used by the traders who look for finding out strong reversal levels. Indicator works on all timeframes and all instruments. Reversal  Sniper  Checks: Harmonic Patterns RSI Zig Zag and Harmonic Swings Cycle Sniper Indicator's Buy / Sell Signals The complex algo i
ICT, SMC, SMART MONEY CONCEPTS, SMART MONEY, Smart Money Concept, Support and Resistance, Trend Analysis, Price Action, Market Structure, Order Blocks, BOS/CHoCH,   Breaker Blocks ,  Momentum Shift,   Supply&Demand Zone/Order Blocks , Strong Imbalance, HH/LL/HL/LH,    Fair Value Gap, FVG,  Premium  &   Discount   Zones, Fibonacci Retracement, OTE, Buy Side Liquidity, Sell Side Liquidity, BSL/SSL Taken, Equal Highs & Lows, MTF Dashboard, Multiple Time Frame, BigBar, HTF OB, HTF Market Structure, 
PRO Renko Systemは、特別にRENKOチャートを取引するために設計された高精度の取引システムです。 これは、様々な取引商品に適用することができる普遍的なシステムです。 システムは効果的に正確な逆転信号へのアクセスを与えるいわゆる市場の騒音を中和する。 表示器は非常に使いやすく、信号の生成に責任がある1つの変数だけがあります。 あなたは簡単にお好みの任意の取引ツールとレンコバーのサイズにツールを適応させることができます。 私はいつもあなたが私のソフトウェアで収益性の高い取引を支援するために余分なサポートを提供する準備ができています! 私はあなたに幸せで収益性の高い取引をしたいです! ご購入後にご連絡ください! 私はあなたに私のレンコチャートジェネレータを送信します。 私はまた、私の個人的な推奨事項やシステムの他のモジュールを無料で共有します!
Please contact me after purchase to immediately get your PDF strategy + documentation for Trend Pulse !  Introducing Trend Pulse , a unique and robust indicator capable of detecting bullish, bearish, and even ranging trends! Trend Pulse uses a special algorithm to filter out market noise with real precision. If the current symbol is moving sideways, Trend Pulse will send you a ranging signal, letting you know that it's not a good time to enter a trade. This excellent system makes Trend Pulse
通貨強さウィザードは、取引を成功させるためのオールインワン ソリューションを提供する非常に強力な指標です。このインジケーターは、複数の時間枠のすべての通貨のデータを使用して、このまたはその外国為替ペアのパワーを計算します。このデータは、使いやすい通貨インデックスと通貨パワーラインの形式で表され、特定の通貨のパワーを確認するために使用できます。 必要なのは、取引したいチャートにインジケーターを接続することだけです。インジケーターは、取引する通貨の実際の強さを示します。このインジケーターは、トレンドに合わせて取引するときに有利に利用できる売買高の圧力の極値も示します。このインジケーターには、フィボナッチに基づく可能なターゲットも表示されます。 このインジケーターは、PUSH 通知を含むあらゆるタイプのアラートを提供します。 購入後ご連絡下さい。私の取引のヒントをあなたと共有し、素晴らしいボーナスインジケーターを無料で提供します! 幸せで有益な取引をお祈りします。
MetaTrader 4用Ultimate Gold Advisor Ultimate Gold Advisorは、MetaTrader 4での取引体験を最適化するために設計された高度な技術ツールです。経験豊富なトレーダーのニーズに応えるために設計されており、このインジケーターは、精度、高度な分析、および多様な機能を組み合わせ、情報に基づいた取引決定をサポートします。金取引に最適ですが、さまざまな資産にも適用可能であり、Ultimate Gold Advisorは市場戦略の改善に役立ちます。 Ultimate Gold Advisorがトレーダーにとって優れたツールである理由は? 高度なパフォーマンス: 各取引の結果をグラフ上で明確に表示する複数のインジケーターを組み合わせることで、あなたの戦略のパフォーマンスを透明に把握できます。これにより、アプローチを改善し、より情報に基づいた意思決定が可能になります。 即時で視覚的な取引シグナル: グラフ上の赤と青の矢印が、買いと売りの可能性を示します。これらの視覚的なシグナルは理解しやすく、行動すべき重要な瞬間をすばやく特定するのに役立ちます
カスタムMT4インジケーターで外国為替取引を成功させるための秘密を発見してください! 外国為替市場で成功を達成し、リスクを最小限に抑えながら一貫して利益を得る方法を疑問に思ったことはありますか? これがあなたが探している答えです! 取引へのアプローチに革命をもたらす独自のMT4インジケーターを導入できるようにします。 ユニークな汎用性 私たちのインジケータは、RenkoとRangeBarのろうそくのフォーメーションを好むユーザー向けに特別に設計されています。 これらのチャートタイプは多くの経験豊富なトレーダーに好まれていることを理解しています。そのため、私たちのインジケーターはそれらとシームレスに統合され、比類のない市場分析を提供します。 クリアトレンドシグナル 複雑な分析を忘れてください! 私たちのインジケーターは、鮮やかな色と明確なドット構造を利用して、市場の動向を明確に示しています。 赤と青の点は、価格の動きの方向性について疑いの余地がなく、取引の迅速な意思決定を可能にします。 HH/HL HL/LL戦略とのアライメント HH/HLおよびHL/LL構
Ultimate Sniper Dashboard
Hispraise Chinedum Abraham
4.82 (22)
299ドルで割引中! 今後値上げの可能性あり! 下の説明を読んでください! 究極のスナイパーダッシュボードのための最高のエントリーシステム。究極のダイナミックレベル。(私の製品をチェックしてください) 究極のスナイパーダッシュボードはMT4多通貨テスト制限のため、ライブマーケットでのみ作動します。 究極のスナイパーダッシュボードをご紹介します。HA-Sniper、MA-Sniper、その他多くの特別なモードが含まれる最高の製品です。究極のスナイパーダッシュボードは絶対的な獣です! 初心者やエキスパートトレーダーにとって最高のソリューションです。もう二度と動きを見逃さない! シンプルさとピップを愛するトレーダーのために、特別な製品をご用意しました。シンプルでありながら、ダッシュボードは複数のカスタムアルゴリズムに基づき28の通貨ペアを監視し、すべての作業を行います。たった一つのチャートで、プロのように市場を読み解くことができます。もし、為替ペアが動き出したときに、その方向性を正確に特定することができれば、あなたの取引はどれほど改善されることでしょう。   当社のシ
まず第一に、この取引ツールはノンリペイント、ノンリドロー、ノンラグの指標であり、プロの取引に理想的ですことを強調する価値があります。 オンラインコース、ユーザーマニュアル、デモ。 スマートプライスアクションコンセプトインジケーターは、新米から経験豊富なトレーダーまで、非常 に強力なツールです。Inner Circle Trader AnalysisやSmart Money Concepts Trading Strategiesなど、20以上の有用な指標を1つに組み合わせています。このインジケーターはスマートマネーコンセプトに焦点を当て、大手機関の取引方法を提供し、彼らの動きを予測するのに役立ちます。 特に、流動性分析に優れており、機関がどのように取引しているかを理解しやすくしています。市場のトレンドを予測し、価格の動きを慎重に分析するのに優れています。機関の戦略とトレードを合わせることで、市場の動向についてより正確な予測ができます。このインジケーターは多目的であり、市場構造を分析し、重要な注文ブロックを特定し、さまざまなパターンを認識するのに優れています。 このインジケー
Enigmera
Ivan Stefanov
5 (3)
エニグメラ:市場の中核 https://www.enigmera.com はじめに このインディケータと取引システムは、金融市場に対する驚くべきアプローチです。ENIGMERAは、フラクタルサイクルを使用して、サポートとレジスタンスレベルを正確に計算します。本格的な蓄積局面を示し、方向性と目標を示します。 トレンド中でも調整中でも機能するシステムです。 どのように作動するのか? ENIGMERAは、支持線・抵抗線、目標線、乖離線の3つのラインで構成されています。このシステムは、過去のデータを現在と未来に外挿する典型的な市場指標とは異なり、現在の完全な画像を提供します。支持線上にある場合、それは本当の支持を意味し、抵抗線上にある場合、それは本当の抵抗を意味する。ある水準が破られた場合、それはトレンドの変化を意味する。再描画はしない。 市場は常に進化しているため、ENIGMERAはその評価ツールを適応させ、定期的に戦略を修正しています。  これにより、すべてのシナリオが徹底的に評価されることが保証されます。この市場指標の独自性は、その能力を見れば明らかです。  ENIGM
支持線と抵抗線、そしてローソク足のギャップをチャート上に自動的に表示するため、価格が次に向かう可能性のある場所や反転する可能性のある場所を確認することができます。 このインジケーターは、私のウェブサイト(The Market Structure Trader)で教えているポジショントレード手法の一部として使用するように設計されており、ターゲットとエントリーの可能性のための重要な情報を表示します。 このインジケーターには、2つのコア機能と4つの追加機能があります: コア機能1 - 日足、週足、月足のサポートラインとレジスタンスラインの自動表示 このインジケーターは、直近2日間、最大6週間前、数ヶ月前のサポートレベルとレジスタンスレベルを自動的に引き込みます。これらのレベルの見た目は完全にカスタマイズすることができ、いくつ表示されるかを表示することもできます。これらの重要な水準は、しばしば主要な支持線と抵抗線として機能し、価格が転換して引き戻されたり反転したりする場所です。また、価格が向かうターゲットでもあるため、価格が転換する前に、取引に利用できる潜在的な距離を素早く確認するこ
Automated Trendlines
Georgios Kalomoiropoulos
5 (16)
トレンドラインは、外国為替取引におけるテクニカル分析の最も重要なツールです。残念ながら、ほとんどのトレーダーはそれらを正しく描画していません。自動トレンドラインインジケーターは、市場のトレンドの動きを視覚化するのに役立つ本格的なトレーダー向けのプロフェッショナルツールです。 トレンドラインには、強気トレンドラインと弱気トレンドラインの2種類があります。 上昇トレンドでは、外国為替トレンドラインは価格変動の最低スイングポイントを介して描画されます。 少なくとも2つの「最低安値」を接続すると、トレンドラインが作成されます。 下降トレンドでは、トレンドラインは価格変動の最も高いスイングポイントを介して描画されます。 少なくとも2つの「最高値」を接続すると、トレンドラインが作成されます。 トレンドラインが壊れたとき? 弱気のろうそくが強気のトレンドラインの下で閉じ、ろうそくの高さがトレンドラインの上にあるとき、強気のトレンドラインは壊れます。 強気のろうそくが弱気のトレンドラインの上で閉じ、ろうそくの安値がトレンドラインの下にあるとき、弱気のトレ
作者のその他のプロダクト
Dollar Index
Sergio D. Rocha
4.5 (4)
This indicator calculates directly the value of the dollar index by using the ICE formula to plot the chart, this can help you as reference. You do not need your broker to provide the ICE DX to use this indicator, is a way to have it calculated. Little discrepancies could be found in the exact value of the candles or time due closing time of the trading floor and the use of decimals, but generally will give you good reference.  You need your broker offers the feed for the following pairs in orde
FREE
Moon Phase
Sergio D. Rocha
5 (1)
Gann and other analyst had found a curious correlations between moon phases and change in trends, this is an excellent indicator to test those relation and use what you find useful. It's very simplistic, can calculate the moon phases using the average moon cycle duration of 29 days 12 hours 44 minutes since the 1970 first full moon registered at January 22nd. You can also place a known full moon's date, to start the count since the daily opening of that date. In its window will plot a vertical l
This is a reduced version, demo if you like, of the published Elliott Wave Tool 7Pasos . The limitations for this tool vs Elliott Wave Tool 7pasos are the following: Only one account possible, the original tool has 1 principal and 4 alternative accounts. Only one degree (Primary) is available, in the original tool 12 different degrees (6 in micro) are at your disposition. As only one degree is available, the functions to upgrade and downgrade the degree of the selected wave are disabled. Fixed c
FREE
This is an extension of the previous published DollarIndex with the addition of the function for calculating EURO Index under ICE Formula. Note that the broker should provide the following data: For Dollar Index formula, EURUSD, USDJPY, GBPUSD, USDCAD, USDSEK and USDCHF are needed. For Euro Index formula, EURUSD, EURGBP, EURSEK and EURCHF are needed. Now in this version if the SEK (the most uncommon) is not provided, the formula still works, since it adds 0.0001 to its value, but the index will
FREE
This is a simple script that places a defined number of lines above and below a given price.  The script lets you set the number of lines, the separation in pips and the color.   Instructions: Drop the script on a chart to draw the level lines  If the last parameter is set to false, the script will delete the lines previously placed by it.  Parameters:  English? Turn it yes to use English language, false will turn language to Spanish  Separation Set the pips distance among lines  From Price
FREE
This is a very simple indicator that mixes the Sunday session with the Monday one. This is useful because the Sunday session is a partial session mostly with only Australian and Asian sessions included, so the analysis of the Monday's daily session if mixed with Sunday tends to be more comprehensive. This indicator plots a candle with the following values: Open - the Friday's Close or Sunday's Open (depending on your choice). High - the highest High of Sunday and Monday. Low - the lowest Low of
FREE
"TradeALot" is a plug-in for the Expert Advisor Control-adora . It allow you to place programmed orders without the need to write the name of the order in the Arrow (like bs, ss, bl, sl, sl1, sl2, etc). Just drag and drop the button for "Programmed Buys" or "Programmed Sells" over the candles-zone at the place where you want to program the order and TradeALot will compare the bid price with the position where you dropped the button and will decide if the order need to be "Stop" or "Limit". With
FREE
This is a technical indicator that works as a plug-in for "Control adora" - the Expert Advisor that helps you to calculate, place and control positions on the chart. When run on a chart with Control adora EA, this plug-in allows setting entry levels that send orders at contact, while you have StopCloseOnly (OCO in Comments) = 1 settled in Control adora (meaning that without this, the indicator will send the order only when the price Close crosses the arrow level). This indicator only works if yo
FREE
Trailing Even is a free complement for the Control adora Expert Adviser. It adds a trailing stop function and changes the exit level that works as stop loss if some price is reached, let's review how to make it work: First of all make sure you have the same language selected both in the Control adora Expert and in this indicator.  Change of the exit level that works as stop loss with "BES" and "BEO": This function needs 2 arrows to work: 1 named BES (stands for Break Even Start) place it at the
FREE
AllHere is a plug-in for Control-adora that works as information panel. Its main function is to show you all the Control-adora elements placed in the chart, like the Control-adora's orders or the exit lines. On the lower left corner, AllHere shows a collection of buttons classified by color (you can set them in the indicator's properties) for several elements used in Control-adora system: Stop loss indications (stop loss Arrows) Exit lines Above (Above trend lines) Exit lines Below (Below trend
FREE
This is a system consistent of 2 components: RepliTrades Source: It sends the trades to one or more terminals into the same Computer RepliTrades Trader: It trades the orders sent by RepliTrades Source  Please watch the video to learn how it works and use it. Features: Manage up to 300 trades at same time in each terminal Work with any broker, no matter if uses suffix or prefix in symbols names Replicate pending orders (limits or stops orders) or direct trades (market orders, etc) and its modif
FREE
This is a very silly script but perhaps you find it useful. It deletes all objects from the chart. I recommend setting a hot key to call it just by pressing a couple of keys on your keyboard.  To avoid accidental deletion of object, the script will ask you to confirm the action as you won't be available to restore them with "undo" (Ctrl+Z).
FREE
This is a technical indicator that put on strategy tester the buttons of the expert adviser "Control adora". Usually when applied the controladora to the strategy tester, the buttons do not appear and therefore its functions (like directly buy, sell, close orders or place stop loss indicator) can't be used. But now you can if have the Manual Backtest indicator. If you don't have Control adora, you can get it from here . This indicator get on the chart the buttons that can be of use in strategy t
FREE
CorExTi is a tool that will save you literally hours in your daily routine to draw lines and other graphic elements in your charts.   With a temporary panel discreetly displayed on your screen at the touch of a graphic element as trendline:  Changes the object between 4 favorite line styles (with color, line thickness and style)  Cuts trendlines, when are extended, just at the point where you touch them Extends trendlines (active property of Ray) which are not extended  Or deactivates visualizat
The best way to monitor multiple pairs within little workspace. RotaGrafico sequentially displays up to 6 different pairs. It has buttons to set a pair more time for observation. Normal exposure time adjustable. Broad exposure time adjustable. Combine in a profile, Rotagrafico and use the rest of your workspace to the pair that you want to analyze in detail.
Did you have to start again the very same analysis because the original one, from where you want to modify, just have so much information that no longer fits? Have you ever wanted to change some in one of your charts and make this new line, Fibo or channel automatically appear in some or the rest of your set of charts? Object Copier is the solution to replicate any object into one or several charts at your desire. No matter if you changed an object, or made it from the scratch. With Object Copie
Control adora
Sergio D. Rocha
4.33 (6)
Controladora means in Spanish controller, this is a simple yet powerful Expert Advisor that allows you to control your trading easily and precisely. Do you want to stop your trade when the price cross a trend line? Don't worry, Controladora can do it. Do you want to take profit when the price reaches the top of a channel? Controladora can do it as well. Calculating the exact proportion of your account by opening a trade, which size represents in case of loss a percentage of your balance, is time
Fibo Pro
Sergio D. Rocha
4.33 (3)
When you combine short term fibos with the long term, your chart get missed up with a lot of lines that hardly make sense at first view. The best way to improve the clearness and there for the easiness to read your chart is by deleting the fibo levels that you no longer need, for example those levels that the price proved didn’t work as support or resistance. With Fibo Pro, you can activate or deactivate from a set of fibo levels pre-settled by you, without miss with the default fibo configurati
FHDrawer
Sergio D. Rocha
4 (1)
Free Hand Drawer is a small app that runs as technical indicator and the only thing that does is that it draws continuous line. To activate it, after adding the indicator to the chart just press the D on your keyboard and click where you want to start drawing. Then every click you make on your chart will be the next nod in your drawing. Use it to draft Elliott waves, or to illustrate ideas on your chart. If you like to draw manually your Gann line you’ll find it handy as well. Each time you want
BreakEven shows the location of the average price level of the orders in the symbol, to which the indicator is attached. This information allows you to find the break-even. The indicator is helpful if you manage several positions, since it allows you to evaluate the performance of your open trades in a glance. If you trade a single order, it allows you to evaluate the effect of your stop loss and the profit or loss during the time your trade is open. Apart from drawing a break-even level line (w
Gann Line indicator is usually used in combination with other Gann’s techniques, some say this is a key point in its success. The Gann line is interpreted as trend indicator, a series of higher highs and higher lows in it's trend are considered bullish, and a series of lower lows and lower highs are bearish. As with other technical indicators, for better results Gann Line should be used in combination with other technical concepts as Gann Fan, fibo, swings, supports and resistance, etc. When rev
This is a system consistent of 2 components: RepliTrades Source: It sends the trades to one or more terminals into the same Computer RepliTrades Trader: It trades the orders sent by RepliTrades Source   Please watch the video to learn how it works and use it. Features: Manage up to 300 trades at same time in each terminal. Work with any broker, no matter if uses suffix or prefix in symbols names. Replicate pending orders (limits or stops orders) or direct trades (market orders, etc) and its mo
The indicator that helps you by plotting a reference to easily determine if a scalping trade (or intraday trade) has chances to work out in your favor. One of the most common issues intraday traders have is the lost of reference to know if a movement is big or small due to the scaling of the chart. With this indicator, you have 3 visual aids on your chart that will help you: "Screener" : Please set the normal stop loss size that you usually apply in your strategy. This will plot a rectangle afte
Pointer Sync
Sergio D. Rocha
3.75 (4)
This indicator plots a crosshair pointer in all charts of the terminal in the position relative to the active chart. To activate the Pointer Sync, just press the "+" button that will appear in one of the 4 corners of the chart where the indicator is added. To deactivate the Pointer Sync, just press the "+" button again. Once Pointer Sync is deactivated, the cross lines will disappear in all charts as well. You can adjust the color of the pointers and the button, the corner where the button appea
This indicator plots a line that shows the high and low of a higher time frame than the one where you have actually in your chart. For example if you want to see the high and low of the day while you are in 1hour chart, set Boundaries to Daily. Boundaries have predefined Monthly, Weekly, Daily and Hourly time frames, but if you want to use a different timeframe, just choose the option Other_TF and write on the next field the minutes for your desired timeframe. As MT4 only works beyond M1 with 5,
This indicator works exactly the same as the Boundaries indicator, but here as a free demo that only shows the high and low of the week. As the Boundaries indicator does, this indicator can work with any symbol. In the Colors tab you can set the color for the Upper and Lower boundaries. Please review the pics or watch the Boundaries indicator video to better understand how it works.
Having a trade about to reach its take profit and suddenly see that it turns around to go strait ahead to your Stop Loss is one of the few things that makes me curse (a lot). This is why I created AntiCurse. Just add this Expert Advisor to an empty chart, set a "Trigger" and "Lock" in its properties and you'll have one less reason to curse! AntiCursing Settings: "Trigger" is set in percentage terms, it is the distance between the entry price and the Take Profit that needs to be covered in orde
PerfectLine
Sergio D. Rocha
5 (2)
When drawing a trend line or other objects, there is a natural deviation when you place the object from a higher time frame, and then go to watch it in a lower time frame. PerfectLine is a technical indicator that solves this problem. Once you touch a line after drawing it, Perfect Line will find the exact spot in the lower time frame available for it's position and then rectifies where it should be. Perfect Line uses a five pixels pre-established tolerance, if a difference between the line's no
Cross Alert is an all-in-one solution for oscillators' cross over and under. Cross Alert manages the levels for the cross under and cross over separately. Thanks to this you can use it to signal zero cross over (by fixing both levels, above to below, and below to above as zero) or over-bought and over-sold levels (like 70 and 30) as well.  With CrossAlert you can also avoid alerts from one kind of crosses (overs or unders), for example if you are in an uptrend perhaps you do not want to have ale
AdvancedTradeLog is a system that allows you to keep visual register of what you had in your chart when you take a trade decision. Basically it takes screenshots of your chart each time you open, modify or close a trade. But not just that, AdvancedTradeLog gives you the ability to record the reasons of why you take those decisions. All who had been trading some time knows that keep a track-record of what you decide and why on the market, is a powerful tool to improve your performance. AdvancedTr
フィルタ:
レビューなし
レビューに返信
バージョン 1.25 2021.11.22
Recompiled with latest MT4 build, requested by mql5.com
バージョン 1.20 2014.09.03
Improved the way the indicator starts it's calculations when timeframe is changed to avoid waiting time until new tick comes and indicator gets updated.
バージョン 1.11 2014.08.08
- Improved to refresh it's value every time new bar opens.
- Improved the way the visual reference levels are displayed, now you can choose to hide or show them at specifics levels.