AutomaticZigZag
- インディケータ
- Stanislav Korotky
- バージョン: 1.7
- アップデート済み: 24 9月 2020
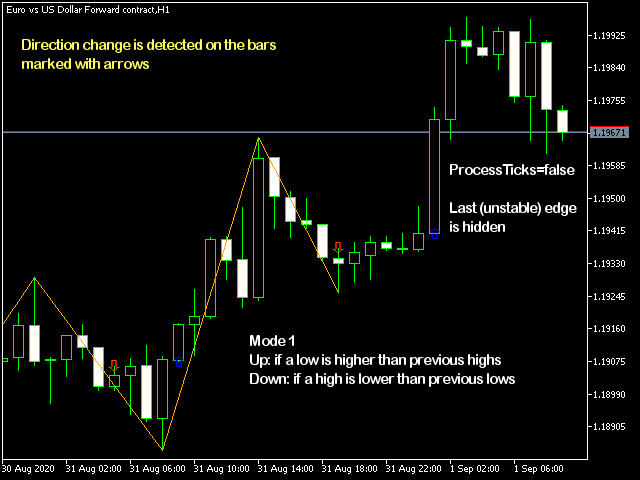
- Upward edge continues on new bars while their `highs` are above highest `low` among previous bars, downward edge continues on next bars while their `lows` are below lowest `high` among previous;
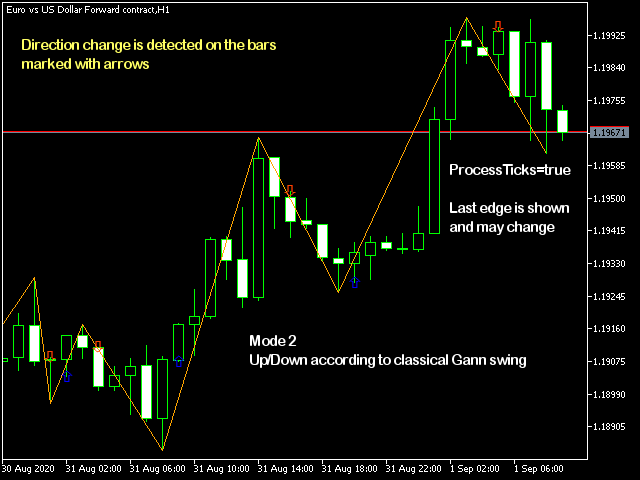
- Gann swing: upward edge continues while `highs` and `lows` are higher than on the left adjacent bar, downward edge continues while `highs` and `lows` are lower than on the left adjacent bar. Inside bars (with lower `high` and higher `low`) and outside bars (with higher `highs` and lower `low`) do not affect edge direction;
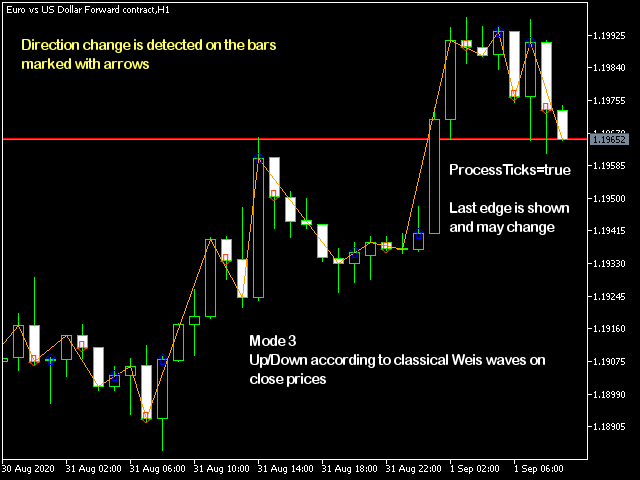
- Weis wave: upward edge continues while `close` prices increase, downward edge continues while `close` prices decrease;
- Retracement by price % or Self-Adjusting Level.
Parameters
- Mode - one of supported methods: High below Low/Low above High, Gann swing, Close vs Close (Weis wave), Retracement;
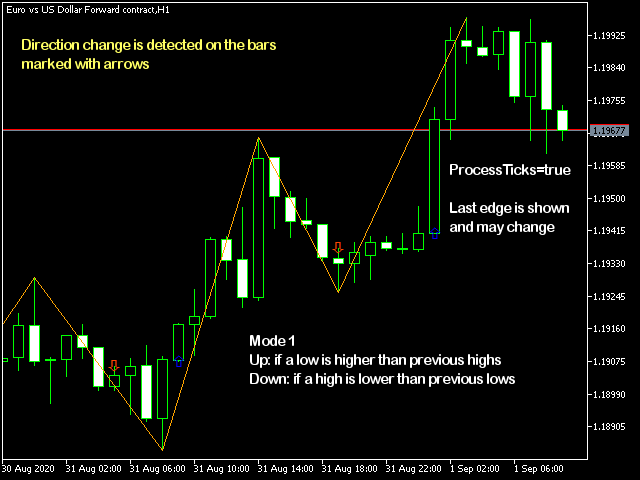
- ProcessTicks - an option to calculate ZigZag on every tick, by default - false; with this value, the last incomplete edge is not shown until it's formed comletely and new (hidden yet) edge is started; if the option is set to true, the last incomplete edge is shown on the chart and my be redrawn according to ongoing price action;
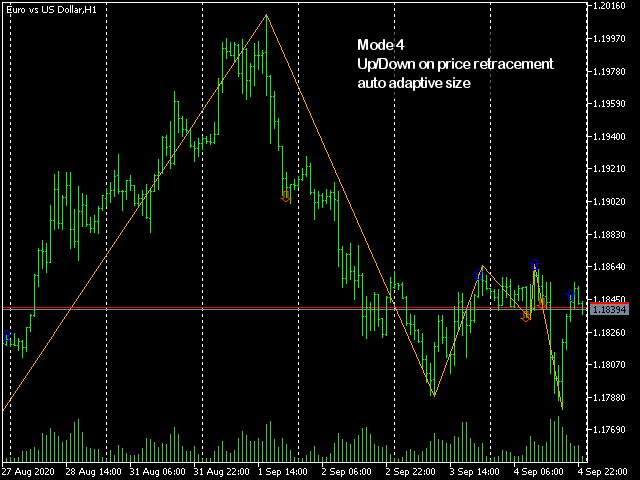
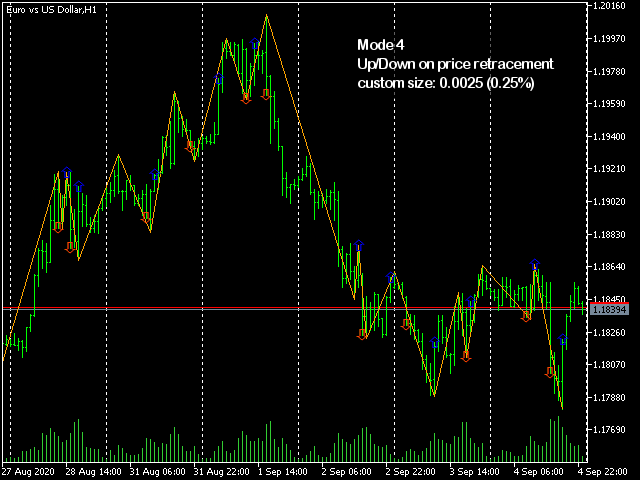
- RetracementPercent - size of price retracement (%), which changes zigzag direction (used in Retracement or Close vs Close modes only); 0 by default means special auto-adaptive retracement algorithm (see below);
NOTE. As with any other ZigZag implementation, the indicator may redraw the last edge if it's not yet completed (and tick processing is enabled). This is by design. All previous edges and up/down marks are stable.
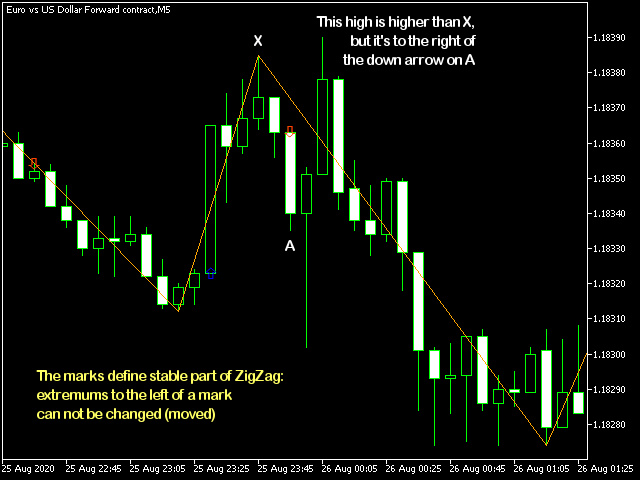
WARNING. While using the 1-st mode, the extremums may not always hit visually most prominent candles. This happens if a higher high or a lower low occurs on a bar where new edge is already forming in opposite direction. For example, if a down arrow mark is shown on the bar A, that means that downward edge is forming on the next bars to the right of A, and hence only lows are processed there for searching extremums. High extremum should remain standing to the left of A only. As a result, if a higher high is located between the bar A and next low extremum, the high can not be marked as high extremum (because it's a section of downward edge). This behaviour is intentional and ensures stability of already formed edges. This is according to the 1-st algorithm. Please, find an explanation on one of the screenshots below.
Auto-adaptive retracement level is calculated by the formula:
where N is a number of bars between the last extreme and current bar. On the current bar N = 0, hence the retracement size is equal to 1, that is the total size of the last edge. On single bar distance the size is about 0.71, on 3 bars - 0.5, on 8 bars - 1/3 of the last edge price change.





For the Gann Swing Chart finally an indicator done right, thank you.
If there was also the option for the top level on the bullish swing candle and bottom on the bearish swing candle, on a higher tf (selectable), it would be complete.
On the weekly and daily tf I have been using it for about 9 years.
Also having an alarm when the first candle closes above the level.