Tunnel Warrens
- インディケータ
- Dariel Iserne Carrera
- バージョン: 1.0
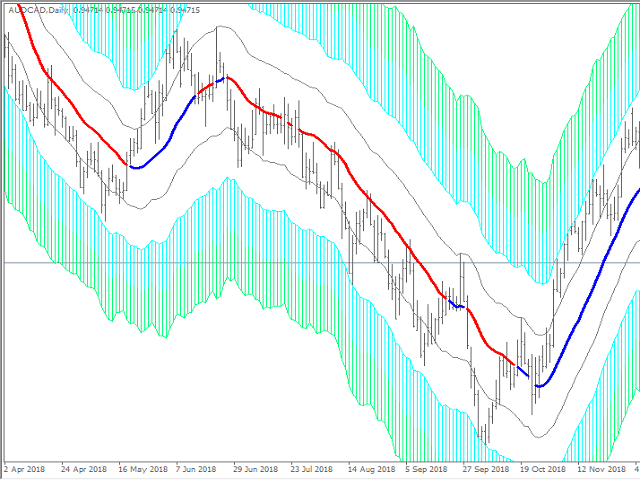
Here are several indicators that work together. It basically works with moving averages and various levels of ATR creating a dynamic channel through which the price is drained. As I always recommend, you should try it before using it in live so that you understand how it works.
The market entry signal is similar to other MA indicators, but with this one you also have a graphical analysis of the moment when the trend is found and dynamic levels to adjust your stop loss and take profit depending on the current volatility. These levels are also dynamic supports and resistances