• 概要
  • レビュー (1)
  • コメント (3)
  • 最新情報

Indicators 14 in 1

5

14 Indicators and auxiliary tools for convenient trading

This utility contains 14 additional tools that can be useful for certain actions of the trader, thereby simplifying and speeding up the trading process.

My #1 Utility: includes 65+ functions  |  Contact me if you have any questions

Due to the different monitor resolutions, some users may encounter the fact that the labels will be displayed with an overlay or be too small. If you encounter such a problem, you can adjust the font size: the 1st parameter in the input variables.

  1. Professional Price Action indicator with the possibility of visual configuration of patterns.
  2. The indicator of the future bar.
  3. Countdown to the closing of the candle of any time frame.
  4. The indicator of the size of the bar.
  5. Automatic support and resistance levels.
  6. Automatic Fibonacci levels.
  7. Gaps indicator.
  8. Levels of potential profit/loss.
  9. Utility for displaying multiple time frames in a single window.
  10. The indicator of the global trading sessions.
  11. Utility for calculating the results of open trades.
  12. Status bar with information about the market.
  13. Indicator of the direction of the bars on all time frames.
  14. Professional price alerts utility.
  • Each of the auxiliary tools can be turned on/off individually by clicking on the corresponding green button.
  • To turn off all the indicators at once, click on the [Disable All] button.

A detailed description of the indicator's functions:  https://www.mql5.com/en/blogs/post/743146

If you have any suggestions for improving the functionality of the indicator, please contact me: https://www.mql5.com/en/users/mqlmoney


レビュー 1
CasiousD
819
CasiousD 2021.06.12 03:59 
 

Great indicator. Very useful features and capabilities, all tied into one single indicator. Even better is the developer!!! There were various issues with the indicator on my computer. Developer reached out privately, asked for details, listened to everything I said, and addressed all issues with subsequent updates to the indicator. Great customer service and very much appreciated. Thank you!!!

おすすめのプロダクト
This indicator is meant for Harmonic Traders, it helps them in identifying the formed patterns by analyzing the market past data, looking for Harmonic Patterns. The Patterns that this indicator can detect are: AB=CD Butterfly Gartely Crab Bat The indicator shows the following: The completed pattern, with the critical zone highlighted in Gray box The suggested 3 take profit levels (in green) The Suggested Stop Loss level (in Red) The formed pattern ratios can be checked by hovering the mouse on t
Power Average
Khurram Mustafa
4.33 (3)
This Indicator is a  affordable trading tool  because with the help of  Popular Developers & Support of M Q L Platform  I have programmed this strategy. I tried to combine logic of  Moving Averages, Parabolic Stop And Reverse, Trend Strength, Oversold, Overbought . Furthermore, I have also care about  Support Resistance  that Trader can easily get in touch with market by selecting one indicator only. What is in for Trader? Trading Modes:  This selection is for  activate whole strategy  "Power A
FREE
The Trend Rever indicator uses two lines of different colors to display buy or sell signals. The first of these lines is red and the second is blue. When changing the color of the lines, an arrow is also displayed, which indicates which deal to open, buy or sell. A simple but effective system for determining the Forex trend. The algorithm takes into account the measurement of prices, and this method also focuses on the measurement of each of the price drops - which gives more detailed informati
This indicator was created to spot potential reversals in the market. It will help you find the edge while trading which is required to be profitable. The indicator does what its good at, processing data objectively and presents you with the results once a new setup has been formed. It can send you a notification or email and such, so you are not required to follow the market every move. This, coupled with the edge it gives, give you the time and rest to take the appropriate action. The Engulfi
Boba Binary
Anthonius Soruh
5 (1)
Result look on  https://t.me/BonosuProBinary Pair : All Forex Pairs Time Frame : M1 Expaired : 1-2 Minutes Trade Time Once Time a Day Backtester, Alert Avaliable Average Signals Generate 5 - 20 Signals All Pair A Day Broker Time Zone GMT+3 Default Setting [Example Broker GMT+3 : Alpari, FBS, XM] Support Broker : Deriv, IQOption, Alpari, Binomo, Olymtrade, Qoutex, GCoption, etc Support Auto Trading : MT2 Trading, Binary Bot, Intrade Bot, Binomo Bot, Olymptrad Bot, MX2 trading, Price Pro, etc Ind
Cota Binary
Anthonius Soruh
5 (2)
Result look on  https://t.me/BonosuProBinary Pair : All Forex Pairs Time Frame : M1 Expaired : 1-2 Minutes Trade Time Once Time a Day Backtester, Alert Avaliable Average Signals Generate 5 - 20 Signals All Pair A Day Broker Time Zone GMT+3 Default Setting [Example Broker GMT+3 : Alpari, FBS, XM] Support Broker : Deriv, IQOption, Alpari, Binomo, Olymtrade, Qoutex, GCoption, etc Support Auto Trading : MT2 Trading, Binary Bot, Intrade Bot, Binomo Bot, Olymptrad Bot, MX2 trading, Price Pro, etc Ind
Indicator FiboZag - transfer the indicator to the chart and the Fibonacci levels will be built automatically on the last ZigZag turn. The main advantage lies in the correct construction of Fibonacci levels and markup of price levels. Simple, visual and effective use. The indicator is not redrawn and does not lag. Works on all currency pairs and on all timeframes.
In the context of trading,   Malaysia SNR   (Support and Resistance) refers to the technical analysis of   support and resistance levels   in financial markets, particularly for stocks, indices, or other assets traded. There are three type of Malaysia SNR level Classic , GAP and Flipped 1. Classic Support   is the price level at which an asset tends to stop falling and may start to rebound. It acts as a "floor" where demand is strong enough to prevent the price from dropping further. Resistance
This is indicator signals entry buy or sell for trader. It notification price entry to trader and price Stop Loss and price Take Profit. Indicator price for entry orders Pending Limit. Input Parameters On Alert - true/false (Displays a message in a separate window.) On Send Notification - false/true. (Sends push notifications to the mobile terminals, whose Meta Quotes IDs are specified in the "Notifications" tab. (Strict use restrictions are set for the SendNotification() function: no more than
Implementation of indication of trend movement with moments for potential stops in the Cloud Power indicator. The transition to the shadow warns of a possible reversal. The entry of the price inside the shadow speaks of a flat movement. The indicator tracks the market trend with unmatched reliability, ignoring sharp market fluctuations and noise around the average price. Simple, visual and efficient use. The indicator does not redraw and does not lag. It can be easily used as an independent t
MoveWave - Moving waves are very handy indicators for determining pivot levels. Most Forex traders make decisions based on technical analysis. This type of analysis determines patterns and trends in the market. With the help of complex mathematical equations that are combined and made out in the form of this indicator, the trader will be able to more accurately determine the price reversal levels. Wave theory mathematically represents various behavioral models of the market. It is used as the ba
PX Trend is a technical indicator that mathematically transforms the price of a currency pair in the form of signaling arrows on the chart, it is used to predict the direction of the market movement. This tool is basic for the interpretation of the parameters of the graphs in technical analysis. PX Trend refers to an arrow indicator Forex - a tool that gives unambiguous signals to buy or sell currencies using arrows. An arrow directed upwards recommends buying, downward - selling. The indicato
DTFX Algo Zones are auto-generated Fibonacci Retracements based on market structure shifts. These retracement levels are intended to be used as support and resistance levels to look for price to bounce off of to confirm direction.   USAGE Figure 1 Due to the retracement levels only being generated from identified market structure shifts, the retracements are confined to only draw from areas considered more important due to the technical Break of Structure (BOS) or Change of Character (CHo
Introduction This indicator detects volume spread patterns for buy and sell opportunity. The patterns include demand and supply patterns. You might use each pattern for trading. However, these patterns are best used to detect the demand zone (=accumulation area) and supply zone (=distribution area). Demand pattern indicates generally potential buying opportunity. Supply pattern indicates generally potential selling opportunity. These are the underlying patterns rather than direct price action. T
Hello Alright. This indicator works on MT4 and is very easy to use. When you receive a signal from it, you wait for that candle with the signal to close and you enter your trade at the beginning of the next new candle. A red arrow means sell and a green arrow means buy. All arrows comes with a long dotted like for easy identification of trade signal. Are you okay with that?   100% non repaint Work All Major currency  Pair,  1 minute time frame 1 minute expire, 5 minute timeframe 5 minute expire
The indicator compares pattern found on chart history with the current price movement. Since history repeats itself, then, by comparing the two patterns, indicator can predict the further movement of the price. The indicator allows you to overlay highlighted history pattern with current movement and you will visually see this movement and will be able to compare the past and the present. To compare two patterns, you need: It is necessary to find and highlight a pattern on the history chart of a
The indicator scans for stop grabber (special pattern of Joe Dinapoli which gives very high probability buy / sell signals and does not repaint ) signals in multiple timeframes for the all markets filtered and shows the results on Dashboard. Key Features Dashboard can be used for all markets It can scan for stop grabber pattern on MN1, W1, D1, H4, H1, M30, M15 ,M5, M1 timeframes Parameters UseMarketWatch: Set true to copy all symbols available in market watch MarketWatchCount : Set the number
Hello ! If you scroll in one chart, all charts will be scrolled If you change the time frame in one chart, it will change in all charts Of course, you can turn this feature on or off All the charts in which you want changes to be applied are specified through ID in the indicator settings You can scroll the charts of different time frames in two ways at the same time 1: Coordinated based on time That is, 1 hour candle is 60 candles one minute back 2: scroll in the form of number of candles That i
Indicator for determining the direction of the current trend Sends signals about trend changes to the terminal, smartphone and email Allows you to quickly navigate when changing price direction Works on all timeframes, on any currency pairs, metals and cryptocurrencies Can be used when working with binary options Distinctive features Doesn't redraw Gives three types of signals Has simple settings Quickly adapts to any trading instrument; Works on all timeframes and all symbols; Suitable for trad
One of the most successful strategies in Forex, stick and metal market, is rectangle pattern. A hard pattern to find in multiple time frames, but, We made it so very easy for you. You can turn on this indicator in different currency pairs with different time frames and set the alarm on your computer or mobile phone. Working with this strategy is easy and enjoyable. Telegram:  https://t.me/triangleexpert Instagram: https://www.instagram.com/p/CNPbOLMh9Af/?igshid=15apgc7j1h5hm Note: This indicat
Нестандартный индикатор определения текущего тренда. Альтернативный подход к определению текущей рыночной тенденции. В основе лежит уникальный алгоритм. Не используются   скользящие средние , осцилляторы , супер-тренды и прочие стандартные индикаторы. Для таймфреймов:   от M15 до D1 . Для стилей торговли:  интрадэй, свинг, долгосрок . Может стать готовой торговой стратегией совместно с любым канальным индикатором. Например таким, как индикатор   "Snake" . Внимание! Это индикатор, а не советник,
Market Noise マーケットノイズは、価格チャート上の市場の局面を決定する指標であり、また、蓄積または分配局面が発生したときに、明確で滑らかなトレンドの動きとノイズの多い平坦な動きを区別します。 各フェーズは、独自のタイプの取引に適しています。トレンド追跡システムにはトレンド、積極的なシステムにはフラットです。 市場のノイズが始まったら、取引を終了することを決定できます。 同様に、またその逆も同様で、騒音が止んだらすぐに、積極的な取引システムをオフにする必要があります。 一方からもう一方に切り替えて、両方のタイプの取引戦略を取引することができます。 したがって、この指標は取引決定の分野で優れたアシスタントの役割を果たします。 すべての価格変動は、選択した期間の一般的な価格変動と、この期間内の価格変動の形でのノイズという 2 つの要素に分けることができます。 同時に、異なる期間の異なる市場では、ノイズ成分とトレンド成分の間の幅広い相互関係を示すことができます (図 1)。 価格変動のノイズレベルが高くなるほど、基礎的なトレンドの方向性と強さを識別することが難しくなります。 した
As the title says, this is an indicator that shows the current open market (session). It has 4 sessions with customizable schedule : 1. London session, 2. New York session, 3. Sydney session, 4. Tokyo session. Indicator inputs: - The color of each session. - The open time and close time of the sessions. - The line width. The objective of the indicator, is to follow each sessions, observe at what times are multiple sessions open, and thus take the chance of the high market movements.
FREE
We Can Do IT MT4   is a Secure Automated Software for Generation of Daily Profits for Forex Market. The architecture is a Fully Automatic Autonomous Robot Expert capable of   independently analyzing the market and making trading decisions. The Trading system is Multi-currency and is able to trade on H1 charts:  EURUSD, GBPUSD, USDJPY, SPX500, DAX30, GOLD NOT  Martingale! NOT GRID, Averaging and other dangerous strategies are NOT used!    This is a full compliance with the FIFO method !  The tr
The indicator determines the state of the market: trend or flat. The state of the market is determined by taking into account volatility. The flat (trading corridor)is displayed in yellow. The green color shows the upward trend. The red color shows the downward trend. The height of the label corresponds to the volatility in the market. The indicator does not redraw . Settings History_Size   - the amount of history for calculation. Period_Candles  - the number of candles to calculate the indicat
"BUYUK SAVDOGAR" TM has developed this strategy to support anyone who trades binary options. The "monoBAR" trading system is based on mathematical probability and consists of algorithms that can analyze the market situation with high accuracy. This trading system consists of mathematical probability, which helps to determine the most accurate state of the price movement. The strategy algorithm helps to detect small impulse movements in a timely manner. You can simultaneously analyze and rece
Nice Stable Arrow   indicator is designed for signal trading. This indicator generates trend signals. It uses many algorithms and indicators to generate this signal. It tries to generate a signal from the points with the highest trend potential. This indicator is a complete trading product. This indicator does not need any additional indicators. The indicator certainly does not repaint. The point at which the signal is given does not change. Signals are sent at the beginning of new candles.
**Binary Smart Systemのご紹介:究極のトレードパートナー** Binary Smart Systemは単なるインジケーターではありません。様々な市場で的確なシグナルを提供し、洗練されたアルゴリズムと豊富なテクニカルインジケーターの集合をベースにした、トレーダーを的確さとタイムリーなシグナルで装備するための厳選されたトレードツールです。 **インジケーターコンポーネント:** 1. **移動平均パーセンテージ(MAP):** このコンポーネントは複数の移動平均の加重平均を計算し、トレンドの特定の強力な基盤を形成します。MAPは市場の状況に動的に適応し、現在のトレンド方向に対する洞察を提供します。 2. **商品チャネル指数(CCI):** 平均価格からの偏差を分析することで、CCIは買われすぎと売られすぎの状態を評価します。Binary Smart SystemのCCI統合は、ポテンシャルな反転ポイントを特定する包括的なアプローチを保証します。 3. **移動平均収束拡散法(MACD):** シンプルなクロスオーバーを超えるMACDコンポーネント。MACD
Risk Reward Tool , It is easy to use. With this tool you can see the rates of profit loss profit. You can see your strategy and earnings reward status of your goals.Double calculation can be done with single tool. Move with drag and drop.  You can adjust the lot amount for calculations. The calculation results are shown in the comment section. There may sometimes be graphical errors during movements. Calculations works at all currency. Calculations All CFD works. Updates and improvements will co
Stronger Trend is an indicator that generates trend signal. It generates trend signal with its own algorithm. These arrows give buying and selling signals. The indicator certainly does not repaint. Can be used in all pairs. Sends a signal to the user with the alert feature. Trade rules Enter the signal when the buy and sell signal arrives. Processing should only be initiated when signal warnings are received. It is absolutely necessary to close the operation when an opposite signal is received.
このプロダクトを購入した人は以下も購入しています
Dynamic Forex28 Navigator - 次世代の Forex 取引ツール。 現在 49% オフ。 Dynamic Forex28 Navigator は、長年人気のインジケーターを進化させたもので、3 つの機能を 1 つにまとめています。 Advanced Currency Strength28 インジケーター (レビュー 695 件)  + Advanced Currency IMPULSE with ALERT (レビュー 520 件) + CS28 コンボ シグナル (ボーナス)。 インジケーターの詳細 https://www.mql5.com/en/blogs/post/758844 次世代の Strength インジケーターが提供するもの  オリジナルで気に入っていたすべての機能が、新機能と精度の向上によって強化されました。 主な機能: 独自の通貨強度計算式。 すべての時間枠でスムーズかつ正確な強度ライン。 トレンドの特定と正確なエントリーに最適です。 ダイナミックマーケットフィボナッチレベル (マーケットフィボナッチ)。 このインジケーターに固有
!SPECIAL SALE!  An exclusive indicator that utilizes an innovative algorithm to swiftly and accurately determine the market trend. The indicator automatically calculates opening, closing, and profit levels, providing detailed trading statistics. With these features, you can choose the most appropriate trading instrument for the current market conditions. Additionally, you can easily integrate your own arrow indicators into Scalper Inside Pro to quickly evaluate their statistics and profitability
FX Volume
Daniel Stein
4.59 (34)
FX Volume:ブローカー視点で捉える本物の市場センチメント クイック概要 トレード手法をさらに高めたいとお考えですか? FX Volume は、リテールトレーダーやブローカーのポジション状況をリアルタイムで提供します。これは、COTのような遅延レポートよりもはるかに早く知ることができます。安定した利益を目指す方も、さらなる優位性を求める方も、 FX Volume は大きな不均衡を見極め、ブレイクアウトを確認し、リスク管理を洗練させるのに役立ちます。今すぐ始めて、実際の出来高データがどのように意思決定を変革するかを体感してください! 1. FX Volume がトレーダーにとって非常に有益な理由 高精度の早期警戒シグナル • 各通貨ペアを売買しているトレーダー数を、他者よりも早く、ほぼリアルタイムで把握できます。 • FX Volume は、複数のリテールブローカーから得られる本物の出来高データを収集し、分かりやすい形式で提供する 唯一 のツールです。 強力なリスク管理 • ロングやショートの大きな偏り(インバランス)を特定し、潜在的なトレンド転換を見逃しません。ストップ
Advanced Supply Demand
Bernhard Schweigert
4.91 (294)
現在33%オフ 初心者にもエキスパートトレーダーにも最適なソリューション このインジケーターは独自の機能と新しい公式を多数内蔵しており、ユニークで高品質かつ手頃な取引ツールです。このアップデートでは、2つの時間枠ゾーンを表示できるようになります。より長いTFだけでなく、チャートTFとより長いTF(ネストゾーンを表示)の両方を表示できます。すべてのSupply Demandトレーダーの皆さんのお気に召すはずです。:) 重要情報の公開 Advanced Supply Demandの可能性を最大化するには、 https://www.mql5.com/ja/blogs/post/720245 にアクセスしてください。   エントリーまたはターゲットの正確なトリガーポイントを正確に特定できれば取引がどのように改善されるか想像してみてください。新しい基盤となるアルゴリズムに基づいて構築されているため、買い手と売り手の間の潜在的な不均衡をさらに簡単に特定できます。これは、最も強い需要と供給のゾーンと、過去のパフォーマンス(古いゾーンを表示)がグラフィカルに表現されるためです。これらの機能は、最適な
現在20%OFF! 初心者やエキスパートトレーダーに最適なソリューションです。 このインディケータは、エキゾチックペア・コモディティ・インデックス・先物など、あらゆるシンボルの通貨の強さを表示することに特化したインディケータです。金、銀、原油、DAX、US30、MXN、TRY、CNHなどの通貨の強さを表示するために、9行目にどのシンボルでも追加することができます。独自の機能を多数搭載し、新しい計算式を採用したため、ユニークで高品質、かつ手頃な価格のトレーディングツールとなっています。新しいトレンドやスキャルピングチャンスのトリガーポイントを正確に把握することができるため、あなたのトレードがどのように改善されるか想像してみてください。 ユーザーマニュアル:ここをクリック   https://www.mql5.com/en/blogs/post/708876 すべての時間枠に対応します。あなたはすぐにトレンドを見ることができるようになります! 新しいアルゴリズムに基づいて設計されているため、潜在的な取引の特定と確認がより簡単になります。これは、8つの主要通貨と1つのシンボルの強弱
Gold Venamax   - これは最高の株式テクニカル指標です。 指標アルゴリズムは資産の価格変動を分析し、ボラティリティと潜在的なエントリーゾーンを反映します。 インジケーターの機能: これは、快適で収益性の高い取引のためのマジックとトレンド矢印の 2 つのブロックを備えたスーパー インジケーターです。 チャート上にブロックを切り替えるための赤いボタンが表示されます。 マジックはインジケーター設定で設定されているため、異なるブロックを表示する 2 つのチャートにインジケーターをインストールできます。 Gold Venamax は、異なる矢印バッファー (GV と SD) を備えた 2 つのチャートに配置できます。 これを行うには、設定で異なる Magic を選択する必要があります。たとえば、あるマジック = 999、別のマジック = 666 を選択します。次に、チャート上の赤いボタンで矢印バッファを選択できます。 入力するのに最適な信号 = 両方のバッファ (GV および SD) の信号矢印 + 3 本すべての MA ライン (赤または青) の方向に従います + TMA
Golden Trend Indicator
Noha Mohamed Fathy Younes Badr
4.9 (10)
Golden Trend indicator  is The best indicator for predicting trend movement this indicator never lags and never repaints and never back paints    and give  arrow buy and sell    before the candle appear  and it will help you and  will make your trading decisions clearer its work on all currencies and  gold and crypto and all time frame This unique  indicator uses very secret algorithms to catch the  trends, so you can trade using this indicator and see the trend clear on charts  manual guide and
指示する     ロシア     -        utilizar con   el indicador の ESP 推奨事項 -   TPSpro トレンド プロフェッショナル版 -   MT5のバージョン 最も重要なことは、将来においても最も重要なことです。 機能のプリンシパル: ゾーンのほとんどは、ベンダーとコンプラドールによってアクティブ化されます。 状況を直感的に把握できるよう、初期の衝動を修正します。 LOGIC AI: MUESTRA zonas (círculos) parabuscar puntos de entrada cuando se activa una plantilla 視覚的に優れた視覚効果があり、最も重要な機能がすべて揃っていることに注意してください。 優れたニベレス/ゾーンの視覚化 (modo MTF) 世界で最も人気のある場所/ゾーンです。これを使用するのに最適な方法です (   TPSproTREND PRO   )。 アルゴリズム プロフェッショナル セパラド パソ ア パソ パラ オペラ それは、オペラハウスやコントラ・デ・エラの指導におい
収益性の高い取引機会を簡単に特定するのに役立つ強力な外国為替取引インジケーターをお探しですか?ビースト スーパー シグナル以外に探す必要はありません。 この使いやすいトレンドベースのインジケーターは、市場の状況を継続的に監視し、新しいトレンドを検索したり、既存のトレンドに飛びついたりします。ビースト スーパー シグナルは、すべての内部戦略が一致し、互いに 100% 合流したときに売買シグナルを発するため、追加の確認は不要です。シグナル矢印アラートを受け取ったら、単に売買します。 購入後、プライベート VIP グループに追加されるようにメッセージを送ってください! (完全な製品購入のみ)。 購入後、最新の最適化されたセット ファイルについてメッセージを送ってください。 MT5バージョンは こちらから入手できます。 Beast Super Signal EA は こちらから 入手できます。 コメント セクションをチェックして、最新の結果を確認してください。 ビースト スーパー シグナルは、1:1、1:2、または 1:3 のリスクと報酬の比率に基づいて、エントリー価格、ストッ
現在31%オフ! 初心者やエキスパートトレーダーに最適なソリューション! このインジケータは、独自の機能と秘密の数式を組み込んだ、ユニークで高品質かつ手頃な価格のトレーディングツールです。たった1枚のチャートで28の通貨ペアのアラートを表示します。新しいトレンドやスキャルピングチャンスの引き金となるポイントを正確に把握することができるので、あなたのトレードがどのように改善されるか想像してみてください! 新しい基本的なアルゴリズムに基づいて構築されているため、潜在的な取引の特定と確認がより簡単になります。これは、通貨の強さや弱さが加速しているかどうかをグラフィカルに表示し、その加速のスピードを測定するためです。加速すると物事は明らかに速く進みますが、これはFX市場でも同じです。つまり、反対方向に加速している通貨をペアにすれば、利益を生む可能性のある取引を特定することができるのです。 通貨の勢いを示す縦の線と矢印は、あなたの取引の指針となるでしょう。 ダイナミックマーケットフィボナッチ23レベルはアラートトリガーとして使用され、市場の動きに適応します。もしインパルスが黄色のトリガ
これはほぼ間違いなく、MetaTraderプラットフォームで見つけることができる最も完全な調和価格形成自動認識インジケーターです。 19種類のパターンを検出し、フィボナッチプロジェクションをあなたと同じように真剣に受け止め、潜在的逆転ゾーン(PRZ)を表示し、適切なストップロスとテイクプロフィットレベルを見つけます。 [ インストールガイド | 更新ガイド | トラブルシューティング | よくある質問 | すべての製品 ] 19の異なる調和価格形成を検出します プライマリ、派生および補完フィボナッチ投影(PRZ)をプロットします 過去の価格行動を評価し、過去のすべてのパターンを表示します この指標は、独自の品質とパフォーマンスを分析します 適切なストップロスとテイクプロフィットのレベルを表示します ブレイクアウトを使用して適切な取引を通知します すべてのパターン比をグラフにプロットします 電子メール/音声/視覚アラートを実装します スコット・M・カーニーの本に着想を得て、この指標は最も純粋で急を要するトレーダーのニーズを満たすように設計されています。ただし、トレードを容易にする
System Trend Pro - This is the best trend trading indicator!!! You can get this indicator for free -  Quantum Entry PRO The indicator no repaint!!!   The indicator has   MTF   mode, which adds confidence to trading on the trend (   no repaint   ). How to trade? Everything is very simple, we wait for the first signal (big arrow), then wait for the second signal (small arrow) and enter the market in the direction of the arrow. (See screens 1 and 2.) Exit on the opposite signal or take 20-30 pips
Automated Trendlines
Georgios Kalomoiropoulos
5 (16)
トレンドラインは、外国為替取引におけるテクニカル分析の最も重要なツールです。残念ながら、ほとんどのトレーダーはそれらを正しく描画していません。自動トレンドラインインジケーターは、市場のトレンドの動きを視覚化するのに役立つ本格的なトレーダー向けのプロフェッショナルツールです。 トレンドラインには、強気トレンドラインと弱気トレンドラインの2種類があります。 上昇トレンドでは、外国為替トレンドラインは価格変動の最低スイングポイントを介して描画されます。 少なくとも2つの「最低安値」を接続すると、トレンドラインが作成されます。 下降トレンドでは、トレンドラインは価格変動の最も高いスイングポイントを介して描画されます。 少なくとも2つの「最高値」を接続すると、トレンドラインが作成されます。 トレンドラインが壊れたとき? 弱気のろうそくが強気のトレンドラインの下で閉じ、ろうそくの高さがトレンドラインの上にあるとき、強気のトレンドラインは壊れます。 強気のろうそくが弱気のトレンドラインの上で閉じ、ろうそくの安値がトレンドラインの下にあるとき、弱気のトレンドラインは壊れます。 トレ
現在26%オフ 初心者やエキスパートトレーダーに最適なソリューション! このインジケーターは、独自の機能と新しい計算式を取り入れた、ユニークで高品質、かつ手頃な価格のトレーディングツールです。たった1枚のチャートで28の為替ペアの通貨強度を読み取ることができます。新しいトレンドやスキャルピングチャンスの引き金となるポイントを正確に特定することができるので、あなたのトレードがどのように改善されるか想像してみてください。 ユーザーマニュアルはこちら  https://www.mql5.com/en/blogs/post/697384 これが最初の1本、オリジナルだ! 価値のないクローンを買わないでください。 特別な サブウィンドウの矢印で強い通貨の勢いを表示 GAPがあなたのトレードを導く! 基準通貨や気配値が売られすぎ・買われすぎのゾーン(外相フィボナッチレベル)にあるとき、個別チャートのメインウィンドウに警告表示。 通貨がレンジの外側から反落した場合、プルバック/リバーサルのアラート。 クロスパターンの特別なアラート 複数の時間枠を選択可能で、トレンドを素早く確認できます
TPSpro TREND PRO は 、市場を自動的に分析し、トレンドとその各変化に関する情報を提供し、再描画せずに取引に参加するためのシグナルを提供するトレンド指標です。 インディケータは各ローソク足を使用し、個別に分析します。さまざまなインパルス(アップまたはダウンインパルス)を指します。通貨、仮想通貨、金属、株、指数の取引への正確なエントリーポイント! バージョンMT5                   インジケーターの完全な説明   インジケーター -   RFI LEVELS と併用することをお勧めします。 主な機能: レンダリングなしで正確な入力信号! シグナルが表示された場合、それは関連性を維持します。これは、シグナルを提供してからそれを変更する可能性があり、入金時の資金の損失につながる可能性があるリドローインジケーターとの重要な違いです。より高い確率と精度で市場に参入できるようになりました。矢印が表示された後、ターゲットに達する (利益確定) か反転シグナルが表示されるまで、ローソク足を色付けする機能もあります。 STOP LOSS / TAKE PROFITゾー
TrendMaestro
Stefano Frisetti
5 (3)
note: this indicator is for METATRADER4, if you want the version for METATRADER5 this is the link:  https://www.mql5.com/it/market/product/108106 TRENDMAESTRO ver 2.4 TRENDMAESTRO recognizes a new TREND in the bud, he never makes mistakes. The certainty of identifying a new TREND is priceless. DESCRIPTION TRENDMAESTRO identifies a new TREND in the bud, this indicator examines the volatility, volumes and momentum to identify the moment in which there is an explosion of one or more of these data a
Wave Price Channel - 衝動と修正を検索するように設計された取引分析システム。 このインジケーターを使用すると、ボラティリティに基づいて構築された価格チャネルの方向に作業することができます。 チャネル上に上向きまたは下向きの矢印が描かれると、この方向に進むことが可能になります。この方向のシグナルは、価格の変化に敏感なドットインジケーターによって確認されます。 同じ色のドットが続く限り信号は継続します。矢印はあるが、同じ色のドットがない場合、その信号は偽であり、ドットが表示されたらそれに従う必要があります。 このインジケーターには、異なる時間枠に対して変更できる唯一の変更可能なパラメーター「価格チャネルの長さ」があります。 タイムフレーム M15 以降での使用を推奨します。 あらゆる取引商品に使用できます。 矢印にはいくつかの種類のアラートがあります。 操作中にシグナルアローを1本のキャンドルに変更することが可能です。 赤い上向き矢印が表示されたら、購入の合図です。赤い点は矢印の軌跡の続きです。 黄色の下矢印が表示された場合は販売の合図であり、黄色の点は矢印の軌跡の
TRANSACTION SPEEDは、大口注文がいつどこで市場に集積され、その恩恵を受けているかを示す最高品質の指標です。トレンドの変化を非常に早い段階で検知します。インジケーターであると同時にトレーディングシステムでもあります。そのコンセプトはユニークで、驚くほど収益性が高い。 FXでは、ティックボリュームはボリュームと呼ばれ、誤解を招きやすい。実際は、単位時間当たりの価格変動であり、事実上、取引速度(TRANSACTION SPEED)です。 このインジケーターは、FXにおける出来高の概念を完全に見直し、正しい方法で論理的に定義し、このロジックを適用することで、ユニークで正確なトップレベルの収益ツールになります。 スピードが上がれば、それはより大きな関心とそれに対応するエントリーとエグジットのサインです。 使い方は? このインジケーターは、市場の取引スピードを測定・比較するため、まず最初に行うべきことは以下の通りです。 比較を行う期間を選択することです。 通常、15日前が比較の出発点となります。 インジケータに日付を入力して実行する。 30分または1時間のタイムフレームで、
このインディケータは、当社の2つの製品 Advanced Currency IMPULSE with ALERT  +   Currency Strength Exotics . のスーパーコンビネーションです。 このインジケーターは全ての時間枠で作動し、8つの主要通貨と1つのシンボルの強弱のインパルスをグラフで表示します。 このインジケータは、金、エキゾチックペア、商品、インデックス、先物など、あらゆるシンボルの通貨強度の加速度を表示することに特化されています。金、銀、原油、DAX、US30、MXN、TRY、CNHなどの通貨強度の加速度(インパルスまたは速度)を表示するために、任意のシンボルを9行目に追加できる、この種の最初のものです。 新しいアルゴリズムに基づいて構築され、潜在的な取引の特定と確認がさらに容易になりました。これは、通貨の強さや弱さが加速しているかどうかをグラフィカルに表示し、その加速の速度を測定するためです。加速すると物事は明らかに速く進みますが、これはFX市場でも同じです。つまり、反対方向に加速している通貨をペアリングすれば、潜在的に利益を生む取引を特定
「Scalping Signal No Repaint No Lag」は、どのチャートにドラッグしても、テンプレートや他のインジケーターをロードする必要なく、必要なすべてのインジケーターを自動的にロードする市場で唯一のインジケーターです。提供された画像とまったく同じようにチャートを自動的に設定します。このインジケーターはリペイントや遅延のないシグナルを保証し、すべての通貨ペアおよび時間枠(TF)でのスキャルピング戦略に最適です。 機能 インジケーターの自動ロード :インジケーターを任意のチャートにドラッグすると、追加の必要なインジケーターがすべて自動的にロードされ、設定された好みに応じてチャートが設定されます。ただし、設定からパラメータを変更することもできます。 チャートの可視化 :日本のローソク足や特定の色を使用して、視覚化を改善するためにチャートのプロパティを調整します。背景やローソク足の色は必要に応じて変更できます。 シグナル生成 :2つの移動平均線の差およびRSIとそのEMAのクロスオーバーを使用して、買いと売りのシグナルを生成し、チャートに矢印で表示します。 トレンドの可視化
Please follow the "How To Trade" instructions exactly for best results Wycoff theory is vastly used by institutional traders but when it comes to retail traders the concept isn't well understood by most. It is even more difficult to implement in intraday & swing trading. This No REPAINT indicator helps you in analyzing the market cycles and plots buy/sell signals at the start of trending phase. It studies the market strength of bulls and bears and does a effort Vs reward matrix calculation befor
Gold Trend   - これは優れた株価テクニカル指標です。指標のアルゴリズムは、資産の値動きを分析し、ボラティリティと潜在的なエントリーゾーンを反映しています。 最高の指標シグナル: - 売りの場合 = 赤のヒストグラム + 赤のショートポインター + 同じ方向に黄色のシグナル矢印。 - 買いの場合 = 青のヒストグラム + 青のロングポインター + 同じ方向の水色のシグナル矢印。 インジケータの利点 1. このインディケータは、高い精度でシグナルを発信します。 2. 確定した矢印シグナルは、トレンドが変化したときにのみ再描画されます。 3. どのブローカーのMetaTrader 4取引プラットフォームでも取引できます。 4. あらゆる資産(通貨、金属、暗号通貨、株式、指数など)を取引できます。 5. H1タイムフレーム(中期取引)で取引するのがよい。 6. 各トレーダーがインディケータを自分用に簡単にカスタマイズできるよう、インディケータ設定で個々のパラメータ(TF、色など)を変更できます。 7. このインディケータは、トレーディングシステムの優れたメイン機能と
このインジケーターは、エリオット波動理論と組み合わせて作動し、2つの方法で使用されます: 自動モード: このモードでは、インジケーターがチャート上の全ての5つのモーティブ波を自動的に検出し、予測とポテンシャルな逆転ゾーンを提供します。また、アラートやプッシュメッセージを生成する能力も備えています。この自動機能により、エリオット波動パターンの識別と分析のプロセスが効率化されます。 手動モード: このオプションは、エリオット波動理論を手動で扱いたいトレーダー向けです。9つの段階を使用して波を描画することができます。各段階は、表示された後に描画されたラインを調整して個別に定義できます。この機能により、手動で波を描画するプロセスがより効率的になります。重要な点として、すべての描画データが将来の参照のためにプラットフォームのデータフォルダに保存されることに注意してください。 パラメータ: Name: インジケーターの名前。 Use_System_Visuals: インジケーターのテーマを有効または無効にして、取引プラットフォーム全体の外観に合わせます。 Explain_Comment: 波の番号
Advanced version of CyberZingFx Volume Plus, the ultimate MT4 indicator for traders seeking highly accurate buy and sell signals. With an additional strategy and price action dot signals that enhances its effectiveness, this indicator offers a superior trading experience for professionals and beginners alike. The CyberZingFx Volume Plus Advanced version combines the power of volume analysis and historical price data with an additional strategy, resulting in even more precise and reliable signals
Scalper Boss は、多層的なロジックフレームワークを通じて市場状況を評価し、最適なエントリーポイントとエグジットポイントを特定するために設計された先進的な分析ツールです。変化する市場環境に適応し、明確な視覚的なシグナルやトレンドラインを提供します。その主な価値は、市場のノイズをフィルタリングし、意味のある動きを捉える能力にあり、特にスキャルピングや日中取引に有用です。 Scalper Boss は利益を保証するものではありませんが、その強力な構造により、特にボラティリティが高い市場やレンジ相場において、トレーダーが市場をより深く理解する手助けをします。 インジケーターの利点 多層分析: 移動平均線の交差とトレンドラインを組み合わせ、市場を包括的に分析。 高精度: 市場レンジの分析を通じてノイズをフィルタリングし、誤ったシグナルを削減。 柔軟性: カスタマイズ可能なパラメーターにより、あらゆる金融商品や取引スタイルに適応。 使いやすさ: 矢印やトレンドラインなどの明確な視覚要素により、シグナルの解釈が簡単。 汎用性: スキャルピング、日中取引、中期取引戦略にも適応可能。 インジ
現在20%OFF! 初心者やエキスパートトレーダーのためのベストソリューション! このダッシュボードソフトウェアは、28の通貨ペアで動作しています。それは私達の主要な指標(高度な通貨の強さ28と高度な通貨インパルス)の2に基づいています。それは全体の外国為替市場の大きい概観を与えます。それは、すべての(9)時間枠で28の外国為替ペアのための高度な通貨の強さの値、通貨の動きの速度と信号を示しています。チャート上で1つのインディケータを使用して市場全体を観察し、トレンドやスキャルピングの機会をピンポイントで見つけることができたら、あなたのトレードがどのように改善されるか想像してみてください。 このインディケータには、強い通貨と弱い通貨の識別、潜在的な取引の識別と確認がより簡単になるような機能が搭載されています。このインディケータは、通貨の強さや弱さが増加しているか減少しているか、また、すべての時間枠でどのように機能しているかをグラフィカルに表示します。 新機能として、現在の市場環境の変化に適応するダイナミックなマーケットフィボナッチレベルが追加され、すでに当社のAdvanced
このインジケーターは実践的なトレードに最適な自動波動分析のインジケーターです! 場合... 注:   Tang Lun (Tang Zhong Shuo Zen) の命名規則の影響で、私は波のグレーディングに西洋の名前を使用することに慣れていません。基本的な波を ペン 、二次波のバンドを セグメント と名付けました。同時に、 セグメント にはトレンドの方向が指定されます (この命名方法は将来のノートで使用されます。最初に言っておきます)。ただし、アルゴリズムは曲がりくねった理論とはほとんど関係がないため、付けるべきではありません。これは、私の市場分析 によって要約された、絶えず変化する複雑な運用ルール を反映しています。 バンドは標準化され、人によって異なることがないよう定義されており、市場参入を厳密に分析する上で重要な役割を果たす人為的な干渉の描画方法が排除されています。 このインジケーターを使用することは、取引インターフェイスの美しさを改善することと同等であり、元の K ライン取引を放棄し、取引の新しいレベルに連れて行きます。また、宣伝の観点から顧客の認識も向上します。 イ
Bomb Bank Signal
Igor Pereira Calil
5 (1)
Bomb Bank シグナル: MetaTrader 4 の信頼度インジケーター Bomb Bank Signal は、金融市場で最も関連性の高いトレンドを特定するように設計された MetaTrader 4 の強力なインジケーターです。動きを正確に予測するツールをお探しなら、Bomb Bank が最適です。 仕組み: このインジケーターは、出来高分析、ローソク足終値、対称トレンドという 3 つの異なる方法を組み合わせて、売買の機会を検出してシグナルを送ります。 Bomb Bank は、買いの機会を特定するときは「爆弾」のようなものであり、売りシグナルを検出するときは「ドクロ」のようなものです。 ボムバンクはなぜ違うのですか? 完全な信頼性: Bomb Bank Signal は信号を削除しません。一度シグナルが発せられると、シグナルは残り続けるので、チャンスを逃すことはありません。 極めて高い精度: Bomb Bank は誤った信号を送信しません。リアルタイムで最新情報を更新し、市場の進化に合わせて調整しながら、以前のシグナルの透明性を維持します。 ライブアップデート: シ
!SPECIAL SALE! The Reversal Master is an indicator for determining the current direction of price movement and reversal points. The indicator will be useful for those who want to see the current market situation better. The indicator can be used as an add-on for ready-made trading systems, or as an independent tool, or to develop your own trading systems. The Reversal Master indicator, to determine the reversal points,  analyzes a lot of conditions since the combined analysis gives a more accura
Live Signal Bonus: when you buy or rent the indicator, you get Gold Pro Scalper   or System Trend Pro absolutely free.(unlimited) After purchase, contact me to learn more about how to get the bonus indicator that pairs perfectly with Quantum Entry for improved merging! Quantum Entry is a powerful price action trading system built on one of the most popular and widely known strategies among traders: the Breakout Strategy! This indicator produces crystal clear buy and sell signals based on break
作者のその他のプロダクト
多機能ツール 搭載機能: ロット計算機、プライスアクション、リスク/リワードレシオ、トレードマネージャー、需要供給ゾーンなどをはじめ65以上の機能。 バージョ:デモ版   |   ユーザーマニュアル   |    MT5版 このユーティリティはストラテジー テスターでは機能しません。 ここからデモ   バージョンをダウンロードして製品をテストできます。 ご不明な点や改善提案、バグの発見などございましたら、 連絡してください 。 取引プロセスを簡素化、高速化、自動化します。このダッシュボードで標準端末機能を拡張します 1. 新しい取引を開始します : ロット / リスク / RR の計算 1. Lot計算機(リスクサイズに基づく取引量計算 2. リスク計算機(ロットサイズに基づくリスク量) 3. リスク/リワードレシオ (R/R) 4. 注文のアクティベーション トリガー + Buy StopLimit / Sell StopLimit 5. 仮想 SL / TP レベル (隠しSL、TP: ブローカーには見えない) 6.  Smart SL / エントリー レベル: バーがそれを超
多機能ツール 搭載機能: ロット計算機、プライスアクション、リスク/リワードレシオ、トレードマネージャー、需要供給ゾーンなどをはじめ65以上の機能。 バージョ:デモ版   |   ユーザーマニュアル   |    MT5版 このユーティリティはストラテジー テスターでは機能しません。 ここからデモ バージョンをダウンロードして製品をテストできます。 ご不明な点や改善提案、バグの発見などございましたら、 連絡してください 。 取引プロセスを簡素化、高速化、自動化します。このダッシュボードで標準端末機能を拡張します 1. 新しい取引を開始します : ロット / リスク / RR の計算 1. Lot計算機(リスクサイズに基づく取引量計算 2. リスク計算機(ロットサイズに基づくリスク量) 3. リスク/リワードレシオ (R/R) 4. 注文のアクティベーション トリガー + Buy StopLimit / Sell StopLimit: MT4でも可  5. 仮想 SL / TP レベル (隠しSL、TP: ブローカーには見えない) 6.  Smart SL / エントリー レベル: バ
秒ごとの更新で現在の市場情報を表示します。 広がりのサイズ; スワップサイズ:短期および長期のポジションの場合; 現地時間(オプション); 私の#1アシスタント: 38+機能が含まれています| ご質問がある場合は私に連絡してください インジケータの設定では、次の設定を行うことができます: フォントサイズ; テキストの色; 位置を選択します:チャートの左/右隅; 現地時間:オン/オフ; プログラムファイルは"Indicators"ディレクトリに配置する必要があります。 私の#1アシスタント: 38+機能が含まれています| ご質問がある場合は私に連絡してください .................................
FREE
Breakeven levels: manual and automatic Using this utility , you can quickly move trades to breakeven in just 1 click : especially important in short -term trading. You can also set the automatic  SL  movement when the trade reaches a desired  profit.  Offset option is also available. My  #1 Utility : 65+ features, including this tool  |   Contact me  if you have any questions  |   MT4 version This tool consists of 2 subsections: 1. [Move SL to BE now]: manually move SL to a breakeven for the sp
Timer Countdown
Makarii Gubaydullin
5 (3)
Countdown timer till the bar closure, + % Progress status:  My   #1 Utility :   includes 65+ functions  |   Contact me  if you have any questions In the settings of the indicator, you can configure: Timeframe for Calulculation; true / false:   Higher TimeFrame option (next from the currently used: M15->M30, H4->D1...) Position: 1 = Bottom Left corner; 2 = Bottom Right corner; 3 = Top Left corner; 4 = Top Right corner; Font Size; Color; Font Style;
FREE
The indicator shows the currently forming candle of the selected time frame Multiple bars   may be   optionally   united   into a single candle: helps to see the bigger picture My   #1   Utility : 65+ features, including this indicator  |   Contact me  for any questions  |   MT4 version In the input settings, select the   timeframe  that will be used for the future bar: To the right of the current price, you will see a bar forming on the specified interval. If activated in the settings, the   Co
Spread and Swap
Makarii Gubaydullin
5 (2)
秒ごとの更新で現在の市場情報を表示します。 広がりのサイズ; スワップサイズ:短期および長期のポジションの場合; 現地時間(オプション); 私の#1アシスタント: 38+機能が含まれています| ご質問がある場合は私に連絡してください インジケータの設定では、次の設定を行うことができます: フォントサイズ; テキストの色; 位置を選択します:チャートの左/右隅; 現地時間:オン/オフ; プログラムファイルは"Indicators"ディレクトリに配置する必要があります。 私の#1アシスタント: 38+機能が含まれています| ご質問がある場合は私に連絡してください .................................
FREE
Automatic Breakeven levels Using   this   utility ,   y ou can activate the automatic SL movement, when the trade reaches a desired profit.  Especially   important   for a   short -term   traders. Offset option is also available: some profit may be protected. My  #1 Utility : 65+ features, including this tool  |   Contact me  if you have any questions  |   MT4 version The process of activating the automatic breakeven function: 1.   Select the Symbol or Trade   for which the Auto BE function wil
Countdown timer till the bar closure, + % Progress status:  My   #1 Utility :   includes 65+ functions  |   Contact me  if you have any questions In the settings of the indicator, you can configure: Timeframe for Calulculation; true / false: Higher TimeFrame option (next from the currently used: M15->M30, H4->D1...) Position: 1 = Bottom Left corner; 2 = Bottom Right corner; 3 = Top Left corner; 4 = Top Right corner; Font Size; Color; Font Style;
FREE
Quickly find the lot size  directly in the terminal , to comply with risk management. My   #1 Utility : includes 65+ functions  |   Contact me  if you have any questions it works on any trading instruments: Forex, Stocks, Futures, Indices, CFD, Bonds, Cryptocurrencies; interface minimization function; flexibility of use; money management; It is especially useful for short-term traders, when they need to act  quickly . For calculation it is necessary to specify 2 parameters: The size of the risk
The indicator displays the most important Price Action Patterns that indicate a potential reversal / continuation of the trend. My   #1 Utility : includes 65+ functions  |   Contact me  if you have any questions Avaliable Patterns: Pin bar; Engulfing; Inside bar (Harami); Morning star; Evening star; Dark Cloud Cover; Piercing Line; Features: You can   select patterns   to display and disable unnecessary patterns; Notifications : alerts in the terminal, Email and Push-notifications (to the mobil
The indicator displays the levels that are extremes for the specified time frames. Resistance level is the maximum price of the last closed bar; Support level is the minimum price of the last closed bar; My   #1 Utility : includes 65+ functions  |   Contact me  if you have any questions 2 operating modes: Real bodies:  Open and Close prices will be used; Extremes:  High and Low prices will be used; This indicator: Helps to see potential reversal levels; Patterns formed near the levels have mor
Automatically plots Fibo levels, based on the High & Low prices from the specified time frame Multiple bars may be united: e.g. you can get a Fibo based on the 10-days Highs and Lows My   #1 Utility : 65+ features, including this indicator  |   Contact me  for any questions  |  MT5 version Helps to see potential reversal levels; Patterns formed at the Fibo levels tend to be stronger; Significantly reduces the time spent on manual  plotting ; Settings: Timeframe to calculate the base High & Low p
The indicator shows the operating time of the world exchanges. Help you to see which markets are currently most active. My   #1 Utility : includes 65+ functions  |   Contact me  if you have any questions Helps to select the most volatile instruments at the moment; Especially useful for an intraday traders; 1) When using on time frames 1H and below: the lines will correspond to the actual location of the bars on the chart, and when moving the chart, the lines of the trading sessions will move a
The indicator displays the   specified Risk Level   on the chart, for long and short positions. My   #1 Utility : includes 65+ functions  |   Contact me  if you have any questions It may be useful when setting the Stop Loss level, the value of which is visible on the right price axis. To calculate the level of risk, a   Fixed  / or   Last used   lot size is used. Imput Settings: Last traded lot:  set " true " to make the calculation for your last used   trading lot; Lot Size: set the value of t
Finds bars that exceed the specified size My   #1 Utility : includes 65+ functions  |   Contact me  if you have any questions 2 operating modes: Real body:  the difference between the   open and close   prices will be used; Extremes:  the difference between the   maximum and minimum   prices will be used; This Indicator: Convenient for   filter patterns   in a period of low volatility; Indicates the   beginning of a trend ; Helps to see the most   significant bars ; Can be used when trading  
Shows the direction of the bars on all major timeframes. My #1 Utility : 65+ features, including this indicator     |     Version for MT5 The meaning of the visual signals ( squares): Red : Close price is  lower  than the Open price: Close < Open;  Green : Close price is  higher  than the Open price: Close > Open; Blue : Close price is  equal  to the Open price: Close = Open; You can set the Shift of the calculated bar, relative to the current bar: Shift = 0: the direction of the currenttly o
Informer for calculating the results of open trades. My   #1 Utility : includes 65+ functions  |   Contact me  if you have any questions The information panel groups open orders into 2 categories: Buys Sells For each category, the symbol and the current number of pips are displayed. The total result for all open trades is shown below. Notifications can be enabled or disabled by simply clicking on the button: When the notification is enabled, you will know when the profit on any symbol has excee
Informer for tracking daily trading results. My   #1 Utility : includes 65+ functions  |   Contact me  if you have any questions In the upper part of the panel, you set the daily profit target (in pips): Manually entering a value; Using the + and - buttons (the change step can be configured in the settings); The dashboard then groups trades into 2 categories: Current floating result; Summing up closed trades; The final result is displayed at the bottom: achievement or non-achievement of your da
Displays the appearance of a gap on the chart (when the closing price of the previous bar differs from the opening price of the new bar). My   #1 Utility:  includes 65+ functions  |   Contact me  if you have any questions In the initial settings you can configure: The size of the gap (in points): only gaps that exceed this value will be displayed. Arrow color : separate for up and down gaps. When you hover the mouse over the gap arrows on the chart, their size will be displayed ; I recommend ch
Market information and detailed statistics: analysis of volatility and price bars. My   #1 Utility : includes 65+ functions  |   Contact me  if you have any questions Specify any currency pair/trading instrument to get information: Market information: Current spread; Swap for long positions (buys); Swap for short positions (sells); Select a time frame and number of periods to analyze price changes: Average volatility; Maximum volatility; Minimum volatility; Maximum price; Minimum price; Number
Monitor your favorite Symbols My   #1 Utility:  includes 65+ functions, including this tool  |   Contact me  if you have any questions This tool opens in a separate window: it can be moved (drag anywhere), and minimized [v]. You can adjust the Watchlist on the panel: Click [edit list] to add / remove the Symbols from the Watchlist. Calculated value: it may either be the last [closed bar], or the current [floating bar]. Select the [timeframe] for calculation. There are 2 types of the value sorti
The indicator helps you analyze 3 different Time Intervals on a single screen to see the overall price action. My   #1 Utility : includes 65+ functions  |   Contact me  if you have any questions In the initial settings you can configure: TimeFrame 1; TimeFrame 2; TimeFrame 3; The number of bars to be shown; Colors of bullish and bearish bars; My other products: Indicators: 14 in  1
Detailed statistics of your trading for the selected period My   #1 Utility : includes 65+ functions  |   Contact me  if you have any questions Statistics display modes: For the  selected   currency pair/trading instrument Statistics for  all trades   (" ALL ") You can select the period for which you want to get statistics: 1 day 1 week 1 month 2   months 3   months 6   months 1 year 2 years All trading history Displayed information:  Gross profit Gross loss Total profit/loss Number of trades
Utility for setting notifications when a given price level is reached. My   #1 Utility : includes 65+ functions  |   Contact me  if you have any questions The alert can be set in three ways: Manual entry of the price level; Setting the price change: in percent / in pips / in market points; By moving the level with the mouse: there is also a magnet function, when activated, the level will snap to the nearest OHLC values; Optionally, you can enable / disable each type of alert: Notifications in t
Management of active and pending orders: automatic breakeven, TP/SL changes, partial / full closing, visual display of levels on the chart My   #1 Utility : includes 54+ functions  |   Contact me  if you have any questions Ex4  file must be located in the "Experts" directory! Auto Trading   must be activated ! 1) Main window: to manage orders, you can set a specific symbol [Symbol], or select all symbols [ALL] Close all active positions [ALL] Close all profitable trades [profits] Close all loosi
Detailed statistics of your trading for the selected period My   #1 Utility : includes 65+ functions  |   Contact me  if you have any questions The utility includes 2 separate tools: Trade Statistics WeekDays Analyzer Statistics display modes: For the selected  currency pair/trading instrument Statistics for all trades   (" ALL ") You can select the period for which you want to get statistics: 1 day 1 week 1 month 2   months 3   months 6   months 1 year 2 years All trading history 1. Trade Stat
The indicator shows the currently forming candle of the selected time frame Multiple bars may be optionally united into a single candle: helps to see the bigger picture My   #1 Utility : 65+ features, including this indicator  |   Contact me  for any questions  |   MT5 version In the input settings, select the timeframe  that will be used for the future bar: To the right of the current price, you will see a bar forming on the specified interval. If activated in the settings, the Countdown to the
Profit/loss statistics for each day of the week on which the trade was opened My   #1 Utility : includes 65+ functions  |   Contact me  if you have any questions Statistics display modes: For the    selected   currency pair/trading instrument Statistics for    all trades   (" ALL ") You can select the period for which you want to get statistics: 1 day 1 week 1 month 2   months 3   months 6   months 1 year 2 years All trading history Displayed information:  You will see statistics for each day of
Trend dashboard: multi timeframe indicator, shows you the summary of the current trend This tool  is based on the 3 major indicators: RSI,  Stochastic and Commodity Channel Index. The   alerts   option   will help  you   not   to   miss   the   beginning   of the   trend. My  #1 Utility : includes 65+ features  |   Contact me  if you have any questions  |   MT5 version A variety of options will allow you to customize the indicator according to your needs. Settings: Calculated bar: either the cu
フィルタ:
CasiousD
819
CasiousD 2021.06.12 03:59 
 

Great indicator. Very useful features and capabilities, all tied into one single indicator. Even better is the developer!!! There were various issues with the indicator on my computer. Developer reached out privately, asked for details, listened to everything I said, and addressed all issues with subsequent updates to the indicator. Great customer service and very much appreciated. Thank you!!!

Makarii Gubaydullin
16559
開発者からの返信 Makarii Gubaydullin 2021.06.12 09:58
Thank you so much for your feedback, I appreciate it!
レビューに返信
バージョン 2.11 2021.06.18
The update contains some bug fixes.
[P.S. Thank you for your feedback, it helps me to improve the product]
バージョン 2.0 2021.06.18
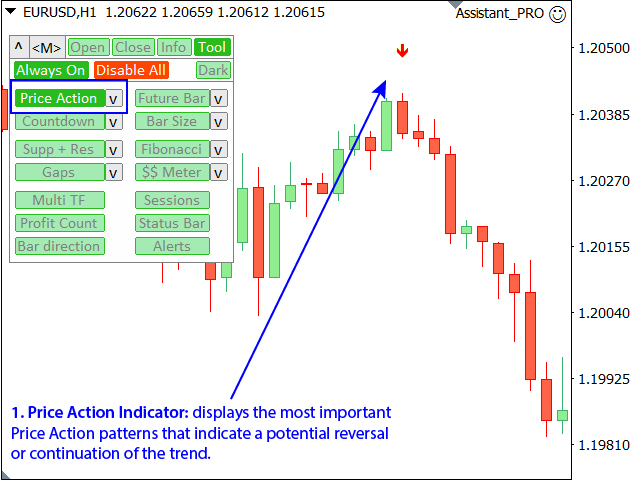
Price Action: Added the ability to select the color of the arrows on the chart;

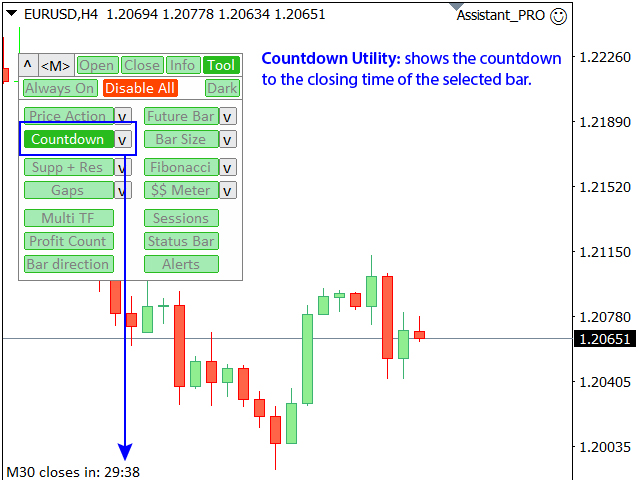
Countdown: Added the option to select the current timeframe (it will change automatically when the chart changes);

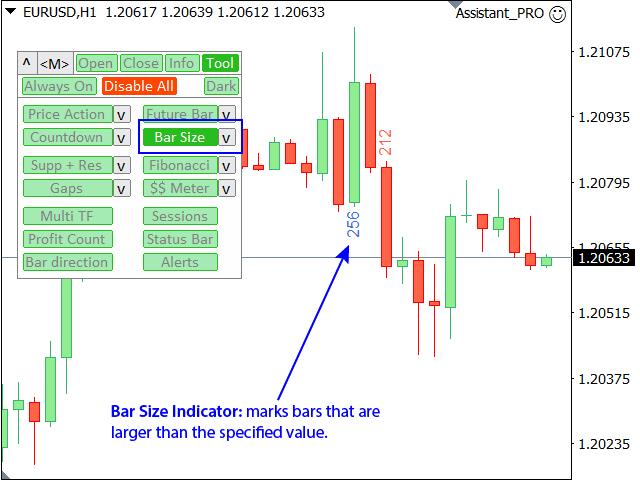
Bar Size: Added the ability to select the calculation method (open-close or high-low prices); added the ability to select the color of the size values on the chart; added the function of alerts about new bars; now you can select the size type: pips/points/percentages;

Fibo levels: Added the option to select the current timeframe (it will change automatically when the chart changes);

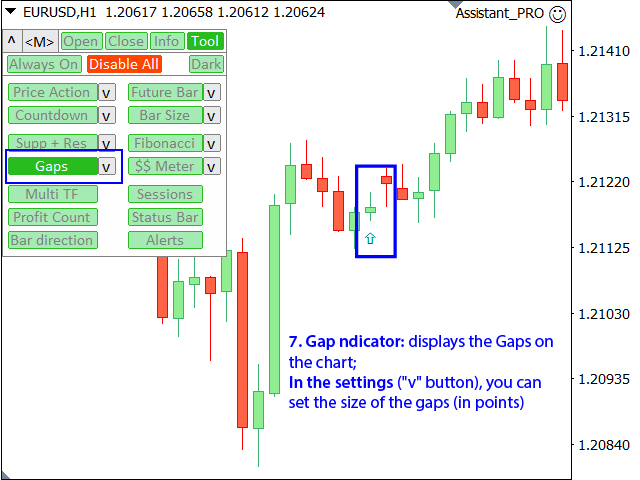
Gaps: Added the function of alerts about new Gaps; now you can select the size type: pips/points/percentages;

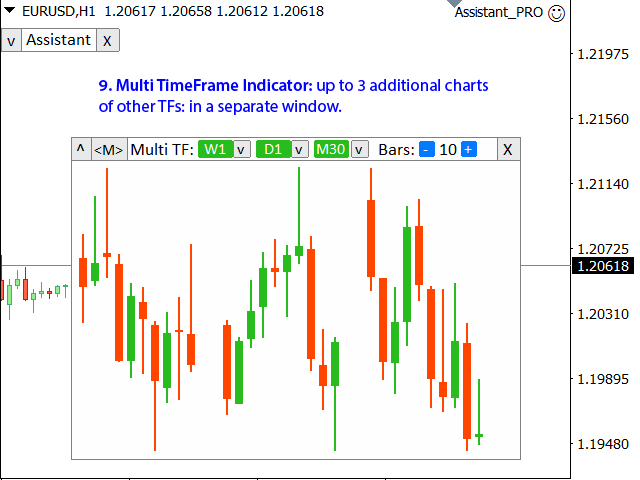
Multi TF: Added a separator between multiple timeframes;

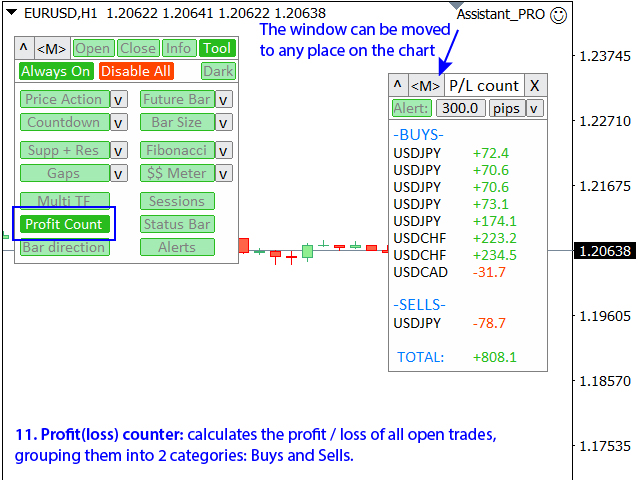
Profit Count: Added the option to calculate in the deposit currency;

Fixed bugs and improved program performance; improved visualization of some objects;
Added the ability to select the font size for objects on the chart;
バージョン 1.40 2021.06.10
Added automatic font size adjustment: now the interface should be displayed correctly on different types of monitors.
If the font is still set incorrectly, you can set the font size manually: the 1st parameter in the inputs.
バージョン 1.31 2021.06.07
Internal Improvements
バージョン 1.30 2021.06.07
Fixed a repositioning bug when changing active terminal windows.
[P.S.: I would be grateful for your feedback: send me a private message if you find any other bug or if you have any suggestions for improving the program.]
バージョン 1.20 2021.05.19
Improvements to the visual display of text, so that the interface now looks better on different types of displays.
If you have any suggestions for improving the program - please send me a direct message.
バージョン 1.12 2021.05.19
Bug fixed
バージョン 1.11 2021.05.19
1. Visual improvements;
2. Fixed the error of resetting values to default values;