XOATRHIST 5
- インディケータ
- Ainur Sharipov
- バージョン: 1.11
- アップデート済み: 11 6月 2020
- アクティベーション: 5
Version for MetaTrader 5.
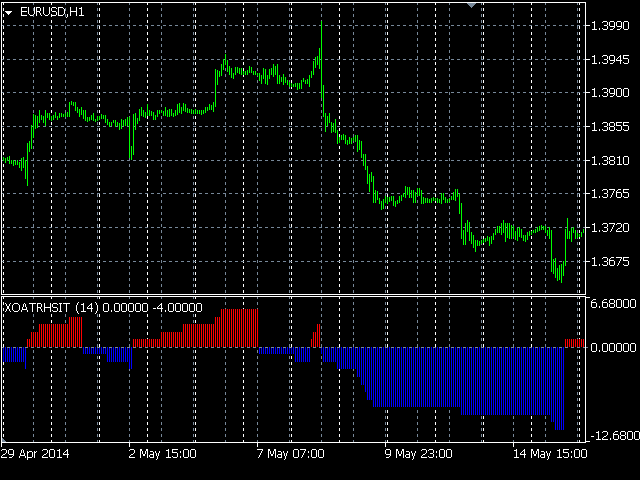
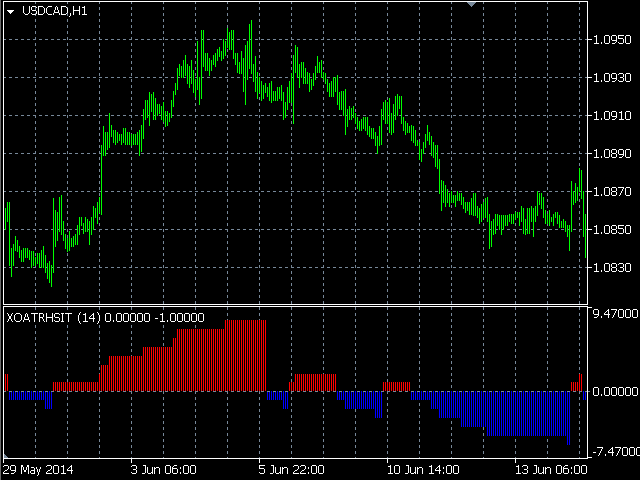
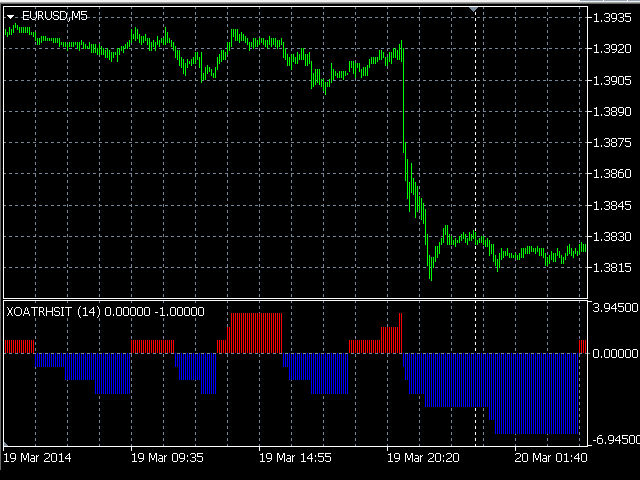
The indicator is based on point and figure chart, but their period is equal to ATR indicator values.
Displays in the form of steps. Steps above zero indicate an uptrend. Below zero on a downtrend.
Parameters:
- ATRPeriod - ATR period for calculation of steps.
Note: The indicator uses closes price, thus it is recommended to consider completed bars.
Log: | 2020 June 11 - repaint indicator, please update this! | 2020 June 12 - incredible responsive from Mr Ainur, the indicator has been updated. So the repaint issue is closed. If there is any essential issue I will come here again to give some feedback. Good luck Mr Ainur! | I will give 5 stars if the actual bar shape doesn't need to refresh the chart to view it.