• 概要
  • レビュー (1)
  • コメント

RadarDivergo

1
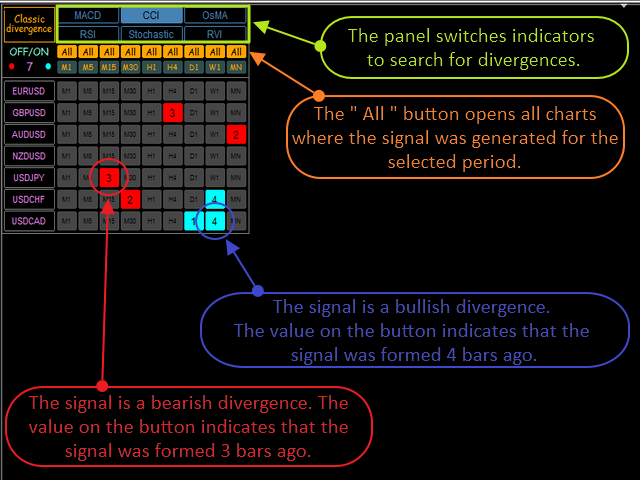
Индикатор ищет дивергенции по индикаторам: MACD, RSI,CCI,Stochastic,OsMA,RVI. По клику на сигнальную кнопку осуществляется переход на график с
сигналом. Для каждого индикатора применяется свой шаблон. Цифры на сигнальных кнопках указывают расстояние в барах от сигнала. Прокрутка
(scrolling) панели осуществляется клавишами "UP" "DOWN" на клавиатуре.


Входные параметры

Lists Of Currencies To Search For Divergences - Список торговых инструментов.
General Setting - Общие настройки панели.
Template Settings - Настройки имен шаблонов для каждого индикатора.
Fractal Search Settings - Настройка поиска вершин фракталов(кол-во баров слева и справа от фрактала).
Indicator Settings - Настройки индикаторов для поиска дивергенций.
おすすめのプロダクト
OVERVIEW The Vector Candle Zones Render indicator automatically renders boxes for vector candle zones that are yet to be recovered. The indicator is an implementation of an existing PVA candles indicator. Combine it with PVSRA and MarketMakerMethod strategy. FEATURES Software: MetaTrader4 - MT4 - 600+ build Timeframes: Multi-Timeframe Markets: Forex/Cryptos/Energies/Bonds/Metals/Indices/Futures/Commodities Customizable style parameters: Change Color style Chan
Channel indicator based on the principles of mathematical statistics. It uses neural networks to simplify a lot of complex calculations, which makes the indicator fast, even for weak computers. How it works The indicator is based on the moving average, the period of which you can set. The indicator analyzes price deviations from the moving average line for the last 1440 or 2880 bars, and each line indicates a certain probability of a price reverse depending on the selected settings: Standard,
Description A colored universal multicurrency/multi-symbol indicator ZigZag to be drawn in a separate window below the main financial instrument. The indicator may be used with any broker, irrespective of the name of the financial instrument since it is necessary to manually enter the name as an input parameter. If you enter a non-existent or incorrect name of a financial instrument, you will receive an error message that this financial instrument is unknown (does not exist).  The indicator can
MT5版  | Valable ZigZagインジケーター |   FAQ エリオット波動理論 は、価格チャート上の波の視覚的なモデルに基づいて、金融市場のプロセスを解釈するものです。この理論によれば、現在市場で優勢なトレンドは、上昇と下降のどちらであるかを正確に知ることができます。 Valable ZigZag インディケーター は、 市場の波動構造 を表示し、現在の時間枠で現在のメイントレンドの方向を示します。便利なことに、 Trend Monitor VZ インジケーターは、取引する通貨ペアの全リストについて、すべての時間枠のチャート上にトレンド方向を表示します。 1 つのチャートですべての商品の市場状態の全体像を把握し、正しい取引判断を下すことができます ! Valable ZigZag インジケーターは 非常に安定しており 、古典的な ZigZag のように頻繁に方向転換してトレーダーを混乱させることはありません。これは、インジケーターの波のプロットにフラクタルを使用することで実現されています。 Valable ZigZag インジケーターは、何よりもまずトレンドインジケー
Directional Volatility & Volume Oscillator - Unleash Your Trading Potential Welcome to a new era of trading excellence with the "Directional Volatility & Volume Oscillator." This innovative indicator is engineered to provide you with essential insights into market volatility and volume, empowering you to make well-informed trading decisions. Basic Details : Indicator Type : Directional Volatility & Volume Oscillator Key Metrics : Real-time volatility and volume insights for precise trading analy
Are you a trend trader tired of noise, spikes and whipsaws?  The  Royal Ace Signal Bar  indicator tracks the market trend with an unmatched reliability, by ignoring sudden fluctuations and market noise around the mean price. It allows you to be steady when everyone else is shaky.  Amazingly easy to trade The indicator needs no optimization at all It implements a multi-timeframe dashboard The indicator is non-repainting Anatomy of the Indicator The  Royal Ace Signal Bar  indicator displays a co
Description A colored channel indicator Price Channel to be drawn on the main chart of a financial symbol. It can color bullish and bearish moods based on the middle line of the indicator, as well as change the color of the upper and lower lines of the channel. Purpose The indicator can be used for manual or automated trading in an Expert Advisor. Values of indicator buffer of the double type can be used for automated trading:  The middle line of the indicator - buffer 4. The upper line of the
The indicator displays the usual Moving Average with input parameters: maPeriod_1; maMethod_1; maAppPrice_1. Then it calculates and displays MA on MA1 with input parameters: maPeriod_2; maMethod_2. Then it calculates and displays MA on MA2 with input parameters: maPeriod_3; maMethod_3. If AlertsEnabled = true the Indicator will show the Alert (message window) with a text like this: "Price going Down on ", Symbol(), " - ", Period(), " min", " price = ", Bid; If eMailEnabled = true the Indicator w
MQLTrend
Mohammad Reza Aghaei
This tool helps you to control the situation at other times and include them in your trades when analyzing the market  This tool scans the market and reports the movement of the market at different times With the help of this tool, you can prevent many wrong analyzes With the help of this tool, you can have an overview of the market in the shortest time and save your time
FREE
SmartMass
Roberto Alvarez
5 (2)
SMARTMASS INDICATOR This indicator is different from all known volume indicators. It has a significant distinction; it is an algorithm that relates price movement to volume, attempting to find proportionality and efficient movement while filtering out noise and other movements that are more random and do not follow a trend or reversal. Ultimately, it reveals the true strength of the movement, indicating whether it has genuine support from bulls or bears or if it's merely a high-volume movement
Royal Ace Signal 3 MA The  Royal Ace Signal 3 MA  indicator tracks the market trend with combine 3 MA.  Amazingly easy to trade The indicator needs no optimization at all It implements a multi-timeframe dashboard The indicator is non-repainting Anatomy of the Indicator The  Royal Ace Signal 3 MA  indicator displays a colored arrow. If the arrow is gold you should be looking for long trades, and if the arrow is red, you should be looking for short trades. Use this indicator in H1, H4 timeframe
The High and Low Points indicator is designed to calculate potential order points. The main feature of this indicator is to specify the points that the price can not exceed for a long time. The market always wants to pass points that can not pass. It is necessary to place an order waiting for this point indicated by this indicator. Is an indicator that constitutes many EA strategies. Designed for manual trading. Transaction Strategies High point buy stop order Low point sell stop order For exa
Bears CD HTB  (Bears Convergence/Divergence High Top Bottom) is a universal analytical bears convergence/divergence indicator between a financial instrument and any of the twenty two standard indicators included in МetaTrader 4 package. The indicator is the second out of the two possible versions (HBT and HTB) of the bearish convergence/divergence origins. Due to its multiple use feature, the indicator allows you to find convergences/divergences between the price and various standard indicators
Description Heiken Ashi Multicurrency  is a colored well-known multicurrency/multy-symbol indicator. It shows a financial instrument as a smoothed candlestick chart in a separate window below the chart of the main financial symbol. The indicator may be used with any broker, irrespective of the name of the financial instrument since it is necessary to manually enter the name as an input parameter. If you enter a non-existent or incorrect name of a financial instrument, you will receive an error m
!! FLASH SALE !!   Over 80% off !!     For ONE week only. Now only $47 - normally $297! >>>      Ends on 30 June 2023 - Don't miss it! Buy and Sell Signals Directly Onto Your Charts.  It couldn't be EZ-er! Aslo Gives Alerts – On Your MT4 To Your Phone To Your Email. Does not repaint! This couldn't be EZ-er to use - just drag it onto your chart (any timeframe, any pair) set the time of day you want signals and where you want alerts, and wait for the signals. Spreads from 0.1pip RAW/ECN Acc
The indicator Box Chart is a very useful analysis tool that allows you to know the value of the range in points. The range is written in a label and also it is draw in a rectangle. This indicator works on multi timeframe and you can upload more indicators on same chart to analyze more time frames ranges. The analysis of the range is done following W. G. Gann school. The observation of the range on little time frame returns some good information of trend or reversal. Box Chart is a simple indicat
MicroMini FFMV Dashboard+CSM This is a custom indicator created to give Traders a full view of what is going on in the market. It uses a real time data to access the market and display every bit of information needed to make successful trading. To add value to the trading operation, Currency Strength Meter is added to it in order to consolidate the effective work of this indicator. THIS IS A MicroMini size of the FULL FOREX MARKET VIEW DASHBOARD INDICATOR with CSM added. This is for those who
This indicator is suitable for trading on the pair  and many more. There is also an interactive panel for quickly changing settings. The indicator itself uses universal calculations of additional accuracy, but so far they are optimized for some currency pairs. Many settings can be configured on the main menu. He displays his calculations on the graph in the form of icons. There are two types of icons. In the tester, it works fine by default in the settings. You can specify a color for its icons
MT5 Version Kill Zones Kill Zones allows you to insert up to 3 time zones in the chart. The visual representation of the Kill Zones in the chart together with an alert and notification system helps you to ignore fake trading setups occurring outside the Kill Zones or specific trading sessions. Using Kill Zones in your trading will help you filter higher probability trading setups. You should select time ranges where the market usually reacts with high volatility. Based on EST time zone, followi
Description A colored multicurrency/multisymbol channel indicator Window Price Channel to be drawn on separate chart window of a financial symbol. It can color bullish and bearish candlesticks and moods based on the middle line of the indicator, as well as change the color of the upper and lower lines of the channel. Purpose The indicator can be used for manual or automated trading in an Expert Advisor. Values of indicator buffer of the double type can be used for automated trading: The middle
This is the linear regression indicator for basic indicators included in the standard package of the MetaTrader 4 terminal. It is used for the analysis of price movements and market mood. The market mood is judged by the slope of the linear regression and price being below or above this line. Regression line breakthrough by the indicator line may serve as a market entry signal. There is possibility of setting the color for bullish and bearish sentiments of the basic indicators as well as plottin
The Display ADX System indicator for the MetaTrader 4 trading platform ( see description (in Russian) ) is compactly sized for a chart window, while displaying ADX indicator results for all time frames in a single window. Parameters for each time frame are set separately. Font size, corner and color can be set according to your preferences. By default, colors of time frame names are as follows: no trend - white, bullish trend - green, bearish trend - red. If the ADX is rising on the last three b
MSN Osc AM
Andriy Matviyevs'kyy
The presented indicator is a reworked version of the Moving Speed ​​Normalized indicator, authored by Roman Kiverin . The indicator provides two types of signals: 1. The histogram crosses the zero value; 2. Change of direction by the signal line. To use it effectively, it is necessary to take into account the long-term trend and open a position only in its direction. It is recommended to use signal confirmation. A signal is considered confirmed if the current price has overcome the maximum (for
FREE
The Advanced Bands Squeeze indicator is a custom indicator based on the classic Bollinger Bands as created by John Bollinger. The Bollinger Band Squeeze occurs when volatility falls to low levels and the Bollinger Bands narrow. This low volatility level is called a “Squeeze”.  According to John Bollinger, periods of low volatility are often followed by periods of high volatility, where prices tend to move a lot in either direction. Therefore, a volatility contraction or narrowing of the bands
!! FLASH SALE !!   Over 80% off !!     For ONE week only. Now only $47 - normally $297! >>>      Ends on 30 June 2023 - Don't miss it! Marks Market Imbalance / Fair Value Gaps / Improper Price Action On The Chart. As traders continue to search for the best trading indicators to guide their investments, the   I mbalance   / I mproper   P rice   A ction   / F air   V alue   G ap   I ndicator has become increasingly popular. This indicator helps to identify opportunities   for taking profit . Th
The SPV Body indicator displays the average analysis of the intersection of adjacent bars. The indicator can easily detect unusual market movements which can be used as a filter. For clarity, poke the graphs to the very beginning of the history when the bars were incomplete, and the indicator will easily display this anamaly. A very effective system for building various filters and confirmations of market entry, to exclude anomalies from trading. It also fixes cyclicity, it turns out that the in
Smart Help
Pavel Krysanov
3.67 (3)
The 'Smart Help' indicator is an excellent assistant for beginners and experienced traders. It consists of 3 parts: The first part provides entry and exit signals in the form of arrows. The up arrow is a signal of an uptrend, the down arrow indicates a downward trend. The second part shows the direction and strength of the current trend. The third part provides information on the currency pair state. The current price is indicated at the top. Below it are: the daily Low and High, the point dista
Speed Master
Svyatoslav Kucher
3.5 (2)
Speed Master  - трендовый индикатор, сигналы которого отображаются в виде гистограммы, и нескольких видов стрелок на ценовом графике. Показания индикатора основаны на идентичных расчетах индикатора  Speed Trend -  https://www.mql5.com/ru/market/product/36524#!tab=tab_p_overview ,  за исключением того, что данный индикатор рассчитывает вместо одного, три указанных периода на текущем таймфрейме, и на их основе отображает сигналы в направлении от старшего периода к меньшему. Speed Master  - подходи
MagicExcel will allow you to extrapolate, from your trades, reports split down by Expert Advisor. The generated reports allow you to quickly compare statistics of trades data from different Expert Advisors, different symbols and also the behavior of an Expert Advisor against different symbols. Additionally, if selected, a report will be created that shows the behavior of the Expert Advisor over time. This is a very useful tool for a trader who works with many Expert Advisors at the same time. R
DPPD(Dynamic Price Percent Deviation)は、「安く買って高く売る」というルールに従うシンプルでありながら効果的な指標です。 インジケーターは、電子メール、アラート、およびMQL IDプッシュ通知を送信できます。また、個別の個人通知を任意の偏差レベルに設定する可能性もあります。 個別の通知には、個別のコメントを追加できます。 なぜDPPDは動的なのですか?静的な点からの偏差は測定されないためです。偏差は、所定の平均からの価格偏差としてパーセントで測定されます。 あらゆる時間枠の推奨設定は200日移動平均です。これは、一般的なコンセンサスによると、大きな変動と傾向の線ですが、他の設定も機能する可能性があり、適切に使用すれば非常に効果的です。 インディケータはいつでもトレーダーに価格が与えられた平均よりどれだけ低いか高いかを知らせます。 インディケータはすべての時間枠で機能し、任意のタイプの価格と任意の移動平均方法を使用できます。 インジケーターのレベルはそれぞれ10%偏差に設定されており、極端な偏差を簡単に特定できます。一般的に、最良の売買機会は10%か
このプロダクトを購入した人は以下も購入しています
Gann Made Easy は、ミスター・ギャンの理論を使用した取引の最良の原則に基づいた、プロフェッショナルで使いやすい外国為替取引システムです。 W・D・ガン。このインジケーターは、ストップロスとテイクプロフィットレベルを含む正確な買いと売りのシグナルを提供します。 PUSH通知を利用して外出先でも取引可能です。 購入後はご連絡ください!私の取引のヒントと素晴らしいボーナスインジケーターを無料で共有します! おそらく、ギャンの取引手法についてはすでに何度も聞いたことがあるでしょう。通常、ギャンの理論は初心者のトレーダーだけでなく、すでにある程度の取引経験がある人にとっても非常に複雑なものです。なぜなら、ギャンの取引手法は理論的にはそれほど簡単に適用できるものではないからです。私はその知識を磨き、最良の原則を私の外国為替インジケーターに組み込むために数年を費やしました。 このインジケーターは非常に簡単に適用できます。必要なのは、それをチャートに添付し、簡単な取引推奨事項に従うだけです。このインジケーターは常に市場分析の仕事を行い、取引の機会を探します。適切なエントリーポイントを検出
An exclusive indicator that utilizes an innovative algorithm to swiftly and accurately determine the market trend. The indicator automatically calculates opening, closing, and profit levels, providing detailed trading statistics. With these features, you can choose the most appropriate trading instrument for the current market conditions. Additionally, you can easily integrate your own arrow indicators into Scalper Inside Pro to quickly evaluate their statistics and profitability. Scalper Inside
現在20%OFF! 初心者やエキスパートトレーダーのためのベストソリューション! このダッシュボードソフトウェアは、28の通貨ペアで動作しています。それは私達の主要な指標(高度な通貨の強さ28と高度な通貨インパルス)の2に基づいています。それは全体の外国為替市場の大きい概観を与えます。それは、すべての(9)時間枠で28の外国為替ペアのための高度な通貨の強さの値、通貨の動きの速度と信号を示しています。チャート上で1つのインディケータを使用して市場全体を観察し、トレンドやスキャルピングの機会をピンポイントで見つけることができたら、あなたのトレードがどのように改善されるか想像してみてください。 このインディケータには、強い通貨と弱い通貨の識別、潜在的な取引の識別と確認がより簡単になるような機能が搭載されています。このインディケータは、通貨の強さや弱さが増加しているか減少しているか、また、すべての時間枠でどのように機能しているかをグラフィカルに表示します。 新機能として、現在の市場環境の変化に適応するダイナミックなマーケットフィボナッチレベルが追加され、すでに当社のAdvan
Reversal First Impulse levels (RFI)    INSTRUCTIONS        RUS       -       ENG              R ecommended to use with an indicator   -   TPSpro  TREND PRO -  Version MT5 A key element in trading is zones or levels from which decisions to buy or sell a trading instrument are made. Despite attempts by major players to conceal their presence in the market, they inevitably leave traces. Our task was to learn how to identify these traces and interpret them correctly. Main functions: Displaying activ
The AT Forex Indicator MT4 is a sophisticated trading tool designed to provide traders with a comprehensive analysis of multiple currency pairs. This   powerful indicator   simplifies the complex nature of the forex market, making it accessible for both novice and experienced traders. AT Forex Indicator uses   advanced algorithms   to detect trends, patterns and is an essential tool for traders aiming to enhance their forex trading performance. With its robust features, ease of use, and reliabl
TPSpro TRENDPRO  - is a trend indicator that automatically analyzes the market and provides information about the trend and each of its changes, as well as giving signals for entering trades without redrawing! The indicator uses each candle, analyzing them separately. referring to different impulses - up or down impulse. Exact entry points into transactions for currencies, crypto, metals, stocks, indices!  -  Version MT5               DETAILED DESCRIPTION                R ecommended to use with
まず第一に、この取引ツールはノンリペイント、ノンリドロー、ノンラグの指標であり、プロの取引に理想的ですことを強調する価値があります。 オンラインコース、ユーザーマニュアル、デモ。 スマートプライスアクションコンセプトインジケーターは、新米から経験豊富なトレーダーまで、非常 に強力なツールです。Inner Circle Trader AnalysisやSmart Money Concepts Trading Strategiesなど、20以上の有用な指標を1つに組み合わせています。このインジケーターはスマートマネーコンセプトに焦点を当て、大手機関の取引方法を提供し、彼らの動きを予測するのに役立ちます。 特に、流動性分析に優れており、機関がどのように取引しているかを理解しやすくしています。市場のトレンドを予測し、価格の動きを慎重に分析するのに優れています。機関の戦略とトレードを合わせることで、市場の動向についてより正確な予測ができます。このインジケーターは多目的であり、市場構造を分析し、重要な注文ブロックを特定し、さまざまなパターンを認識するのに優れています。 このインジケー
mql5と Telegramの モーニング・ブリーフィングで、詳細とスクリーンショットを含む毎日のマーケット・アップデートをご覧 ください! FX Power MT4 NGは 、長年の人気を誇る通貨強度計FX Powerの次世代モデルです。 この次世代ストレングスメーターは何を提供するのでしょうか?初代FXパワーの魅力すべて プラス GOLD/XAUの強さ分析 より正確な計算結果 個別に設定可能な分析期間 カスタマイズ可能な計算上限値により、さらに優れたパフォーマンスを実現 もっと見たい人のための特別なマルチインスタンス設定 すべてのチャートでお好みの色を無限に設定可能 数え切れないほどの通知オプションにより、重要なことを見逃すことはありません。 Windows 11とmacOSのスタイルで角を丸くした新しいデザイン 魔法のように動くインジケーターパネル FXパワーの主な機能 すべての主要通貨の強さの完全な履歴 すべての時間枠における通貨の強さの履歴 すべてのブローカーとチャートで同一の計算結果 100%信頼できるリアルタイム計算 -> リペイントなし ドロップダウン・リストから
通貨強さウィザードは、取引を成功させるためのオールインワン ソリューションを提供する非常に強力な指標です。このインジケーターは、複数の時間枠のすべての通貨のデータを使用して、このまたはその外国為替ペアのパワーを計算します。このデータは、使いやすい通貨インデックスと通貨パワーラインの形式で表され、特定の通貨のパワーを確認するために使用できます。 必要なのは、取引したいチャートにインジケーターを接続することだけです。インジケーターは、取引する通貨の実際の強さを示します。このインジケーターは、トレンドに合わせて取引するときに有利に利用できる売買高の圧力の極値も示します。このインジケーターには、フィボナッチに基づく可能なターゲットも表示されます。 このインジケーターは、PUSH 通知を含むあらゆるタイプのアラートを提供します。 購入後ご連絡下さい。私の取引のヒントをあなたと共有し、素晴らしいボーナスインジケーターを無料で提供します! 幸せで有益な取引をお祈りします。
市場の2つの基本原則に基づく日中戦略。 このアルゴリズムは、追加のフィルターを使用したボリュームと価格の波の分析に基づいています。インディケータのインテリジェントアルゴリズムは、2つの市場要因が1つに結合した場合にのみシグナルを出します。インディケータは、より高い時間枠のデータを使用して、M1チャート上の特定の範囲の波を計算します。そして波を確認するために、インジケーターはボリュームによる分析を使用します。 このインディケータはレディトレーディングシステムです。トレーダーが必要とするのは、信号に従うことだけです。また、インジケーターはあなた自身の取引システムの基礎になることができます。取引はミニッツチャートでのみ行われます。 インジケーターがMTFの原則を使用しているという事実にもかかわらず、インジケーターのアルゴリズムは可能な限り安定しています。 購入後、必ず私に書いてください!私の取引設定と推奨事項をあなたと共有します!
Indicator : RealValueIndicator Description : RealValueIndicator is a powerful tool designed specifically for trading on the EURUSD pair. This indicator analyzes all EUR and USD pairs, calculates their real currency strength values, and displays them as a single realistic value to give you a head start on price. This indicator will tell you moves before they happen if you use it right. RealValueIndicator allows you to get a quick and accurate overview of the EURUSD currency pair tops and bottoms,
Trend Punch
Mohamed Hassan
5 (16)
Manual guide:   Click here WEEK SALE PROMO:   $59 ONLY!  -- Next price is  $120 .  This indicator is unstoppable when combined with our other indicator called  Support & Resistance . After purchase, send us a message and you will get it   for  FREE as a BONUS! I like to use Trend Punch on XAUUSD on the M1 timeframe & higher ones!  Introducing Trend Punch , the revolutionary forex trend indicator that will transform the way you trade! Trend Punch is uniquely designed to provide pre
まず第一に、この取引インジケーターは再描画されず、再描画されず、遅延しないことを強調する価値があります。これにより、手動取引とロボット取引の両方に理想的なものになります。 ユーザーマニュアル:設定、入力、戦略。 アトミックアナリストは、価格の強さとモメンタムを利用して市場でより良いエッジを見つけるためのPA価格アクションインジケーターです。ノイズや誤ったシグナルを除去し、取引ポテンシャルを高めるための高度なフィルターを備えています。複雑なインジケーターの複数のレイヤーを使用して、アトミックアナリストはチャートをスキャンし、複雑な数学的計算をシンプルなシグナルと色に変換します。これにより、どのような初心者トレーダーでも理解して使用し、一貫した取引の決定を行うことができます。 「アトミックアナリスト」は、新規および経験豊富なトレーダー向けにカスタマイズされた包括的な取引ソリューションです。プレミアムインジケーターとトップノッチの機能を1つの取引戦略に組み合わせ、すべてのタイプのトレーダーにとって汎用性のある選択肢にします。 デイリートレーディングとスキャルピング戦略:高
現在26%オフ 初心者やエキスパートトレーダーに最適なソリューション! このインジケーターは、独自の機能と新しい計算式を取り入れた、ユニークで高品質、かつ手頃な価格のトレーディングツールです。たった1枚のチャートで28の為替ペアの通貨強度を読み取ることができます。新しいトレンドやスキャルピングチャンスの引き金となるポイントを正確に特定することができるので、あなたのトレードがどのように改善されるか想像してみてください。 ユーザーマニュアルはこちら  https://www.mql5.com/en/blogs/post/697384 これが最初の1本、オリジナルだ! 価値のないクローンを買わないでください。 特別な サブウィンドウの矢印で強い通貨の勢いを表示 GAPがあなたのトレードを導く! 基準通貨や気配値が売られすぎ・買われすぎのゾーン(外相フィボナッチレベル)にあるとき、個別チャートのメインウィンドウに警告表示。 通貨がレンジの外側から反落した場合、プルバック/リバーサルのアラート。 クロスパターンの特別なアラート 複数の時間枠を選択可能で、トレンドを素早く
ご紹介   クォンタム トレンド スナイパー インジケーターは 、トレンド反転を特定して取引する方法を変革する画期的な MQL5 インジケーターです。 13年以上の取引経験を持つ経験豊富なトレーダーのチームによって開発されました。     クォンタムトレンドスナイパーインジケーター   は、非常に高い精度でトレンドの反転を識別する革新的な方法で、あなたのトレーディングの旅を新たな高みに押し上げるように設計されています。 ***Quantum Trend Sniper Indicatorを購入すると、Quantum Breakout Indicatorを無料で入手できます!*** クォンタム ブレイクアウト インジケーターは、トレンドの反転を特定するとアラートを発し、矢印を示し、3 つのテイクプロフィットレベルを提案します。 初心者トレーダーにもプロのトレーダーにも適しています。 量子EAチャネル:       ここをクリック MT5のバージョン:       ここをクリック 推奨事項: 期間: すべての時間枠。最良の結果を得るには、
Advanced Supply Demand
Bernhard Schweigert
4.92 (313)
現在33%オフ 初心者にもエキスパートトレーダーにも最適なソリューション このインジケーターは独自の機能と新しい公式を多数内蔵しており、ユニークで高品質かつ手頃な取引ツールです。このアップデートでは、2つの時間枠ゾーンを表示できるようになります。より長いTFだけでなく、チャートTFとより長いTF(ネストゾーンを表示)の両方を表示できます。すべてのSupply Demandトレーダーの皆さんのお気に召すはずです。:) 重要情報の公開 Advanced Supply Demandの可能性を最大化するには、 https://www.mql5.com/ja/blogs/post/720245 にアクセスしてください。   エントリーまたはターゲットの正確なトリガーポイントを正確に特定できれば取引がどのように改善されるか想像してみてください。新しい基盤となるアルゴリズムに基づいて構築されているため、買い手と売り手の間の潜在的な不均衡をさらに簡単に特定できます。これは、最も強い需要と供給のゾーンと、過去のパフォーマンス(古いゾーンを表示)がグラフィカルに表現されるためです。これらの機能は、最適
TrendMaestro
Stefano Frisetti
5 (3)
note: this indicator is for METATRADER4, if you want the version for METATRADER5 this is the link:  https://www.mql5.com/it/market/product/108106 TRENDMAESTRO ver 2.4 TRENDMAESTRO recognizes a new TREND in the bud, he never makes mistakes. The certainty of identifying a new TREND is priceless. DESCRIPTION TRENDMAESTRO identifies a new TREND in the bud, this indicator examines the volatility, volumes and momentum to identify the moment in which there is an explosion of one or more of these data a
JULY OFFER 80% OFF next price for unlimited version will be 17000$. This is the only time you can get this institutional and professional indicator at this price for unlimited version. Don't dare to miss this. The tool I am about to introduce to you you can't compare it with other tools due to its strategy and accuracy level in predicting the next price directional movement . This tool is designed for serious traders who have decided to make a difference through trading. Be the next person to wi
ご紹介     Quantum Breakout PRO は 、ブレイクアウト ゾーンの取引方法を変革する画期的な MQL5 インジケーターです。 13年以上の取引経験を持つ経験豊富なトレーダーのチームによって開発された Quantum Breakout PROは 、革新的でダイナミックなブレイクアウトゾーン戦略により、あなたの取引の旅を新たな高みに押し上げるように設計されています。 クォンタム ブレイクアウト インジケーターは、5 つの利益ターゲット ゾーンを備えたブレイクアウト ゾーン上のシグナル矢印と、ブレイクアウト ボックスに基づいたストップロスの提案を提供します。 初心者トレーダーにもプロのトレーダーにも適しています。 量子EAチャネル:       ここをクリック MT5バージョン:   ここをクリック 重要!購入後、インストールマニュアルを受け取るためにプライベートメッセージを送ってください。 推奨事項: 時間枠: M15 通貨ペア: GBPJPY、EURJPY、USDJPY、NZDUSD、XAUUSD アカウントの種類: ECN、Raw、また
Enigmera
Ivan Stefanov
5 (4)
エニグメラ:市場の中核 https://www.enigmera.com はじめに このインディケータと取引システムは、金融市場に対する驚くべきアプローチです。ENIGMERAは、フラクタルサイクルを使用して、サポートとレジスタンスレベルを正確に計算します。本格的な蓄積局面を示し、方向性と目標を示します。 トレンド中でも調整中でも機能するシステムです。 どのように作動するのか? ENIGMERAは、支持線・抵抗線、目標線、乖離線の3つのラインで構成されています。このシステムは、過去のデータを現在と未来に外挿する典型的な市場指標とは異なり、現在の完全な画像を提供します。支持線上にある場合、それは本当の支持を意味し、抵抗線上にある場合、それは本当の抵抗を意味する。ある水準が破られた場合、それはトレンドの変化を意味する。再描画はしない。 市場は常に進化しているため、ENIGMERAはその評価ツールを適応させ、定期的に戦略を修正しています。  これにより、すべてのシナリオが徹底的に評価されることが保証されます。この市場指標の独自性は、その能力を見れば明らかです。  ENIGM
Cycle Sniper
Elmira Memish
4.41 (37)
NEW YEAR SALE PRICE FOR LIMITED TIME!!! Please contact us after your purchase and we will send you the complimentary indicators to complete the system Cycle Sniper is not a holy grail but when you use it in a system which is explained in the videos, you will feel the difference. If you are not willing to focus on the charts designed with Cycle Sniper and other free tools we provide, we recommend not buying this indicator. We recommend watching the videos about the indiactor and system before pu
TrendDecoder Premium
Christophe Pa Trouillas
5 (6)
レンジと次の動きを特定    |  トレンドの最も早いシグナルと強さを得る   |  反転の前に明確な出口を得る   |  価格がテストするフィボ・レベルを見つける。 非リペイント、非遅延インディケータ - マニュアルおよび自動売買に最適 - すべての資産、すべての時間単位に対応 期間限定キャンペーン   >> 50%OFF 購入後、 推奨セッティングについては、このチャンネルで私に連絡してください。 MT5 バージョン: ここをクリック BladeSCALPER   と   PowerZONES   を使った完全な方法を入手する どのようなものですか? TrendDECODERは、トレンド監視をシンプルかつ簡単にするための複数のイノベーションを集約したものです。 Projective TrendLine (投影トレンドライン) - 今後のトレンドのスピードリファレンス。 RealTime TrendLine vs. Projective TrendLine (リアルタイムトレンドライン vs. Projective TrendLine) - 市場が同じ方
現在31%オフ! 初心者やエキスパートトレーダーに最適なソリューション! このインジケータは、独自の機能と秘密の数式を組み込んだ、ユニークで高品質かつ手頃な価格のトレーディングツールです。たった1枚のチャートで28の通貨ペアのアラートを表示します。新しいトレンドやスキャルピングチャンスの引き金となるポイントを正確に把握することができるので、あなたのトレードがどのように改善されるか想像してみてください! 新しい基本的なアルゴリズムに基づいて構築されているため、潜在的な取引の特定と確認がより簡単になります。これは、通貨の強さや弱さが加速しているかどうかをグラフィカルに表示し、その加速のスピードを測定するためです。加速すると物事は明らかに速く進みますが、これはFX市場でも同じです。つまり、反対方向に加速している通貨をペアにすれば、利益を生む可能性のある取引を特定することができるのです。 通貨の勢いを示す縦の線と矢印は、あなたの取引の指針となるでしょう。 ダイナミックマーケットフィボナッチ23レベルはアラートトリガーとして使用され、市場の動きに適応します。もしインパルスが黄色
FX Volume
Daniel Stein
4.61 (36)
mql5と Telegramの モーニング・ブリーフィングで、詳細とスクリーンショットを含む毎日のマーケット・アップデートをご覧 ください! FX Volumeは、ブローカーの視点から市場のセンチメントをリアルに洞察する、最初で唯一の出来高インジケーターです。 ブローカーのような機関投資家が外国為替市場でどのようなポジションをとっているか、COTレポートよりもはるかに速く、素晴らしい洞察を提供します。 この情報をチャート上で直接見ることは、あなたの取引にとって真のゲームチェンジャーであり、画期的なソリューションです。 以下のようなユニークなマーケットデータ洞察から利益を得てください。 比率は 、通貨のロングポジションとショートポジションの比率をパーセントで表示します。 比率の変化は 、選択した期間内のロング比率とその変化率を表示します。 Volumes Totalは 、通貨の取引量(ロングとショート)の合計をロット単位で表示します。 Volumes Long :全通貨のロングポジションの取引量を表示します。 Volumes(ショート )は、全通貨のショートポジションの取引量を表示
TakePropips Donchian Trend Pro
Eric John Pajarillaga Aldana
4.61 (18)
TakePropips Donchian Trend Pro   (MT4) は、ドンチャン チャネルを使用してトレンドの方向を自動的に検出し、エントリーとエグジットの取引シグナルを提供する強力で効果的なツールです! この多機能インジケーターには、トレンド スキャナー、取引シグナル、統計パネル、スクリーナー、取引セッション、およびアラート履歴ダッシュボードが含まれます。取引シグナルを提供し、チャートを分析する時間を節約するように設計されています! ユーザー マニュアルとインストール ガイドは、ブログ投稿 (   https://www.mql5.com/en/blogs/post/751368   ) からダウンロードできます。 今日は 50% オフ! 98ドルから49ドルに値下げ! このインジケーターは、ストラテジー テスターでテストできます (ビジュアル モードを有効にします)。 詳細については、説明の下にあるビデオ チュートリアルも利用できます。 ご不明な点やサポートが必要な場合は、私に連絡してください。 TakePropips Donchian Trend Pro イン
ICT, SMC, SMART MONEY CONCEPTS, SMART MONEY, Smart Money Concept, Support and Resistance, Trend Analysis, Price Action, Market Structure, Order Blocks, BOS/CHoCH,   Breaker Blocks ,  Momentum Shift,   Supply&Demand Zone/Order Blocks , Strong Imbalance, HH/LL/HL/LH,    Fair Value Gap, FVG,  Premium  &   Discount   Zones, Fibonacci Retracement, OTE, Buy Side Liquidity, Sell Side Liquidity, BSL/SSL Taken, Equal Highs & Lows, MTF Dashboard, Multiple Time Frame, BigBar, HTF OB, HTF Market Structure, 
これはMT4のインジケーターで、再描画なしで取引に参入するための正確なシグナルを提供します。 外国為替、暗号通貨、金属、株式、インデックスなど、あらゆる金融資産に適用できます。かなり正確な見積もりを提供し、取引を開始して終了するのに最適な時期を教えてくれます。1つのシグナルを処理しただけでインジケーターの元が取れた例の 動画 (6:22)をご覧ください。Entry PointsPro インジケーターの助けを借りたほとんどのトレーダーの最初の1週間の結果が改善しています。 Telegramグループ に登録してください。Entry Points Proインジケーターのメリットは次の通りです。 再描画のないエントリーシグナル 再描画されるインジケーターでは一度表示されたシグナルが削除されて大きな金銭的損失につながることがありますが、これと異なり、表示されて確認されたシグナルは消えることがありません。 エラーなしの取引開始 インジケーターアルゴリズムによって取引を開始する(資産を売買する)理想的な瞬間を見つけることができます。それを使用するすべてのトレーダーの成功率が向上します。
Legacy of Gann
Pavel Zamoshnikov
4.85 (13)
The indicator very accurately determines the levels of the possible end of the trend and profit fixing. The method of determining levels is based on the ideas of W.D.Gann, using an algorithm developed by his follower Kirill Borovsky. Extremely high reliability of reaching levels (according to K. Borovsky  - 80-90%) Indispensable for any trading strategy – every trader needs to determine the exit point from the market! Precisely determines targets on any timeframes and any instruments (forex, met
このインディケータは、当社の2つの製品 Advanced Currency IMPULSE with ALERT  +   Currency Strength Exotics . のスーパーコンビネーションです。 このインジケーターは全ての時間枠で作動し、8つの主要通貨と1つのシンボルの強弱のインパルスをグラフで表示します。 このインジケータは、金、エキゾチックペア、商品、インデックス、先物など、あらゆるシンボルの通貨強度の加速度を表示することに特化されています。金、銀、原油、DAX、US30、MXN、TRY、CNHなどの通貨強度の加速度(インパルスまたは速度)を表示するために、任意のシンボルを9行目に追加できる、この種の最初のものです。 新しいアルゴリズムに基づいて構築され、潜在的な取引の特定と確認がさらに容易になりました。これは、通貨の強さや弱さが加速しているかどうかをグラフィカルに表示し、その加速の速度を測定するためです。加速すると物事は明らかに速く進みますが、これはFX市場でも同じです。つまり、反対方向に加速している通貨をペアリングすれば、潜在的に利益を生む取
The Volume by Price Indicator for MetaTrader 4 features Volume Profile and Market Profile TPO (Time Price Opportunity). Volume and TPO histogram bar and line charts. Volume Footprint charts. TPO letter and block marker collapsed and split structure charts. Session filtering and grouping. Static, dynamic and flexible range segmentation and compositing methods with relative and absolute visualizations. Graphical layering, positioning and styling options to suit the user's analytic and aesthetic n
作者のその他のプロダクト
Linker
Roman Lipatov
5 (1)
"LINKER" is an indicator that links any number of windows of the charts it is running on. A synchronized crosshair is also available, toggled by the (Ctrl) key or the (L) button. The visibility of the trade levels can be toggled on each chart separately using the (Shift) key or the (V) button. The buttons and the crosshair have customizable settings and colors. For instance, you need to analyze a trading instrument on different timeframes, for example, on H1, H4 and D1. Doing this in a single ch
This panel is designed for quick visual search for the price action patterns on several instruments simultaneously. It is possible to add and remove instruments. Clicking the signal button allows you to quickly move to the chart with the identified pattern and timeframe. The panel searches for 8 candlestick patterns: PIN-BAR, EXTERNAL BAR, INSIDE BAR, DOJI, LEVEL, HIGH/LOW OF N BAR, FAKEY, ONE-WAY N BAR. Any of the patterns can be disabled by clicking its title. It can also search in history (by
This panel is designed for quick visual search for the price action patterns on several instruments simultaneously. It is possible to add and remove instruments. Clicking the signal button allows you to quickly move to the chart with the identified pattern and timeframe. The panel searches for 8 candlestick patterns: PIN-BAR, EXTERNAL BAR, INSIDE BAR, DOJI, LEVEL, HIGH/LOW OF N BAR, FAKEY, ONE-WAY N BAR. Any of the patterns or the periods can be disabled by clicking its title. It can also search
The indicator helps you trade following the VSA (Volume Spread Analysis) and PRICE ACTION methods, as well as study these methods from a perspective. The indicator searches for VSA and PRICE ACTION patterns considering the current trend. It is possible to view the patterns of the higher timeframe on the current timeframe chart. The custom mode allows you to find your patterns based on VSA method. Also, there is a volume histogram that automatically configures the width and visual horizontal leve
The panel works as a filter, finding patterns based on the Volume Spread Analysis technique. Search is carried out for selected trading instruments and all available timeframes. It is possible to add and remove instruments. Clicking the signal button allows you to quickly move to the chart with the identified pattern and timeframe. It can also search in history (by previous bars) with the buttons "<<" and ">>". The panel can be scrolled using the "UP" and "DOWN" keys. Input parameters Basic Se
Панель предназначена для быстрого визуального нахождения и отображения пин-баров по всем периодам и на любых выбранных валютных парах одновременно. Цвет сигнальных кнопок, указывает на направление пин-бара. По клику на сигнальную кнопку, осуществляется открытие графика с данным паттерном. Отключить не используемые периоды, можно кликом по его заголовку. Имеется поиск в истории (по предыдущим барам). Прокрутка (scrolling) панели, осуществляется клавишами "UP" "DOWN" на клавиатуре. Имеется Push-ув
Панель предназначена для быстрого визуального нахождения и отображения внутренних баров по всем периодам и на любых выбранных валютных парах одновременно. Цвет сигнальных кнопок, указывает на направление паттерна. По клику на сигнальную кнопку, осуществляется открытие графика с данным паттерном. Отключить не используемые периоды, можно кликом по его заголовку. Имеется поиск в истории (по предыдущим барам). Прокрутка (scrolling) панели, осуществляется клавишами "UP" "DOWN" на клавиатуре. Имеется
Панель предназначена для быстрого визуального нахождения и отображения внешних баров по всем периодам и на любых выбранных валютных парах одновременно. Цвет сигнальных кнопок, указывает на направление паттерна. По клику на сигнальную кнопку, осуществляется открытие графика с данным паттерном. Отключить не используемые периоды, можно кликом по его заголовку. Имеется поиск в истории (по предыдущим барам). Прокрутка (scrolling) панели, осуществляется клавишами "UP" "DOWN" на клавиатуре. Имеется Pus
Данная утилита предоставляет возможность работать с ордерами, переключатся по периодам и менять шаблон графика используя клавиши клавиатуры. Быстрое открытие и закрытие ордеров, установка и удаление отложенных приказов пригодится как скальперам, так и трейдерам торгующих на новостях. Смена периода или шаблона в одно нажатие клавиши, упростит анализ графиков. Также предусмотрено закрытие части позиции. Возможность назначения любых клавиш и различные настройки ордеров, поможет собрать торговый
Ни для кого не секрет, что для того чтобы, заработать на финансовых рынках необходимо движение цены инструмента. И чем движение сильнее тем больше возможностей предоставляется для торговли трейдеру. Для поиска сильных движений цены и был разработан PulseScanner. Панель предназначена для быстрого визуального нахождения и отображения сильных движений цены по всем периодам и на любых выбранных валютных парах одновременно. Индикатор имеет несколько режимов поиска и визуального отображения сигналов.
Fakey
Roman Lipatov
5 (2)
Панель предназначена для быстрого визуального нахождения и отображения ложных пробоев по всем периодам и на любых выбранных валютных парах одновременно . Цвет сигнальных кнопок , указывает на направление возможного движения . По клику на сигнальную кнопку , осуществляется открытие графика с данным паттерном . Отключить не используемые периоды , можно кликом по его заголовку . Кнопка "All" открывает графики всех сигналов по данному периоду . Имеется поиск в истории ( по предыдущим барам ). Прокру
Данная панель упростит работу тем, кто использует в своей торговле горизонтальные уровни. Панель дает возможность быстро переключатся по инструментам, при этом в несколько кликов устанавливать уровни на графиках и взаимодействовать с ними. Имеется гибкая настройка оповещения. Одно из преимуществ данного продукта, показывать вид пробития уровня, это ложный пробой или закрепление за уровнем. Настройки Market_Watch - При (true) выводит инструменты из списка панели "Обзор рынка", при (false) инстр
Данный индикатор находит рыночные ситуации по типу "ложный пробой", "сложный ложный пробой" и "пробой уровня". Настройки SettingListMarket - В данном разделе гибко настраивается список торговых инструментов и фильтров. ListOrMarketOverview - При false список инструментов используется из List_1...List_5, при true инструменты из обзора рынка. Forex - включает в список Forex инструменты. CFD - включает в список CFD инструменты. Futures - включает в список Futures инструменты. CFDOnIndexes - вк
Индикатор производит поиск различных паттернов и сортировку рыночной информации. Полученную информацию фильтрует и выводит на экран, обновляя ее с заданной периодичностью. Имеется возможность сохранять собственные списки инструментов. Имеет сортировку по: названию инструмента; типу инструмента; по диапазону значений от N до M; выделенным в ручную маркерам; Важно!!! Индикатор спроектирован так, чтоб была возможность добавлять новые паттерны и значения для сортировки. Если вам необход
Now manual trading will be fun! This indicator is a high-quality and affordable trading solution. The indicator does not redraw,but works in real time. It provides a complete off-the-shelf system. The system visually indicates on the chart the beginning of opening positions, their further support and optimal closing. The indicator also has a notification about trading actions: "VOICE NOTIFICATION", "VISUAL NOTIFICATION", "ALERT" and "PUSH NOTIFICATION". You can either follow the si
EA Magnet
Roman Lipatov
5 (2)
The result is visible in the first hours of operation! The bot opens a grid of orders with a minimum lot. And it fixes a small profit, but it does it very often. Thus, the profitable zones are always close to the current price.The Expert Advisor has a trading panel. With it, you can open positions that will be picked up by the Expert Advisor and taken into account in trading. The built-in switchable filter ensures trading in the direction of the trend. Use a $ 1,000 depo
I use only time-tested algorithms! The principle of operation of the Expert Advisor is to search for a global trend and open deals on a local pullback. There is both a fixed and an auto lot.TralingStop helps to squeeze the maximum out of the price movement. The Expert Advisor has a trading panel. With its help, you can open positions that will be picked up by the Expert Advisor and taken into account in trading.The Expert Advisor has a minimal list of settings, which makes
The indicator determines the trend and its direction. At the same time, it shows the oversold and overbought zones. Thus, it determines the most profitable places to open a position. The indicator can be used as a filter and complement to any strategy. It can also be used as an independent tool.    Advantages The indicator does not redraw the values. Works on all available tools. Works on all periods. It has a minimum of settings. The ability to use it as a primary and auxiliary indicato
"LINKER" is an indicator that links any number of windows of the charts it is running on. A synchronized crosshair is also available, toggled by the (Ctrl) key or the (L) button. The visibility of the trade levels can be toggled on each chart separately using the (Shift) key or the (V) button. The buttons and the crosshair have customizable settings and colors. For instance, you need to analyze a trading instrument on different timeframes, for example, on H1, H4 and D1. Doing this in a single ch
Панель предназначена для быстрого визуального нахождения и отображения пин-баров по всем периодам и на любых выбранных валютных парах одновременно. Цвет сигнальных кнопок, указывает на направление пин-бара. По клику на сигнальную кнопку, осуществляется открытие графика с данным паттерном. Отключить не используемые периоды, можно кликом по его заголовку. Имеется поиск в истории (по предыдущим барам). Прокрутка (scrolling) панели, осуществляется клавишами "UP" "DOWN" на клавиатуре. Имеется Push-ув
Панель предназначена для быстрого визуального нахождения и отображения внутренних баров по всем периодам и на любых выбранных валютных парах одновременно. Цвет сигнальных кнопок, указывает на направление паттерна. По клику на сигнальную кнопку, осуществляется открытие графика с данным паттерном. Отключить не используемые периоды, можно кликом по его заголовку. Имеется поиск в истории (по предыдущим барам). Прокрутка (scrolling) панели, осуществляется клавишами "UP" "DOWN" на клавиатуре. Имеется
Панель предназначена для быстрого визуального нахождения и отображения внешних баров по всем периодам и на любых выбранных валютных парах одновременно. Цвет сигнальных кнопок, указывает на направление паттерна. По клику на сигнальную кнопку, осуществляется открытие графика с данным паттерном. Отключить не используемые периоды, можно кликом по его заголовку. Имеется поиск в истории (по предыдущим барам). Прокрутка (scrolling) панели, осуществляется клавишами "UP" "DOWN" на клавиатуре. Имеется Pus
Эта панель предназначена для быстрого визуального поиска паттернов "price action" по нескольким торговым инструментам одновременно. Есть возможность добавлять и удалять торговые инструменты. По клику на сигнальную кнопку осуществляется быстрый переход на график с данным паттерном и таймфреймом. Панель ищет 8 свечных паттернов: PIN-BAR, EXTERNAL BAR, INSIDE BAR, DOJI, LEVEL, HIGH/LOW OF N BAR, FAKEY, ONE-WAY N BAR. Отключение любого из паттернов осуществляется кликом по его заголовку. Также имеет
The result is visible in the first hours of operation! The bot opens a grid of orders with a minimum lot. And it fixes a small profit, but it does it very often. Thus, the profitable zones are always close to the current price.The Expert Advisor has a trading panel. With it, you can open positions that will be picked up by the Expert Advisor and taken into account in trading. The built-in switchable filter ensures trading in the direction of the trend. Use a $ 1,000 depo
フィルタ:
Nicolas Dobrovsky
749
Nicolas Dobrovsky 2021.09.03 11:35 
 

1-No alert. 2-Divergence scans after the oscillator breaks. The signals keep disappearing and reloading. You need to add settings to the close bar. 3-You cannot turn off scanning of any oscillator. It constantly scans them all, thus slowing down MT4. The dashboard has potential, but a lot of features are missing. I do not recommend buying at the moment.

レビューに返信