AlterAlert
- インディケータ
- Dariel Iserne Carrera
- バージョン: 1.0
- アクティベーション: 20
Trading is about waiting for the right time.
This indicator was created to know what is happening on our charts without having to cover the screen with indicators. In addition, it has several types of alerts that allow us to dedicate our time to other things until something interesting happens.
You can use multiple alarms at the same time. It is not a problem.
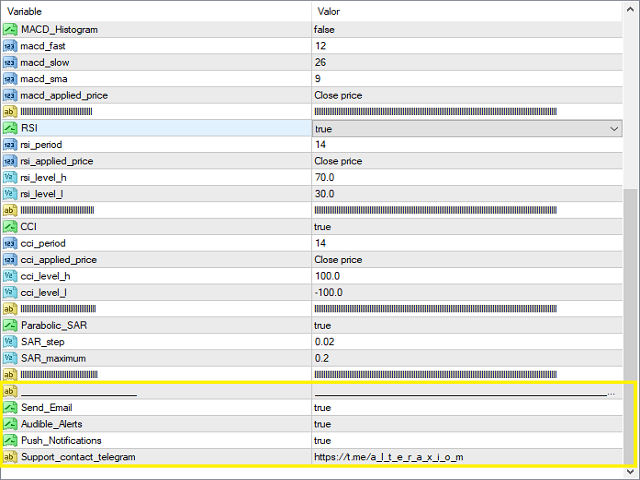
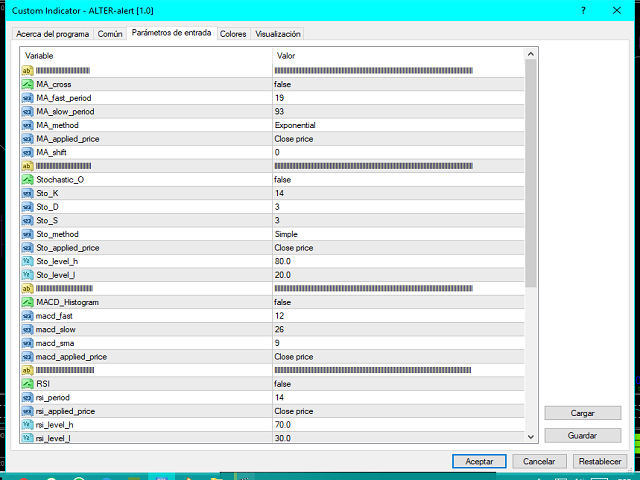
By default AlterAlert offers us alerts when the following indicators give us a signal:
- Moving average (MA crosses)
- Stochastic Oscillator
- MACD
- RSI
- CCI
- Parabolic SAR
But you can send me a message or comment to include others. I will include as many as necessary.
I wanted this indicator to be cheaper but this is the minimum price allowed by the platform. So I'll make up for it by increasing the number of possible updates.
Your opinion is important to develop the best products. Let me know what tool you want to have ...