FFx RSI Dashboard MTF ALERTER
- インディケータ
- Eric Venturi-Bloxs
- バージョン: 1.3
- アップデート済み: 16 6月 2021
- アクティベーション: 5
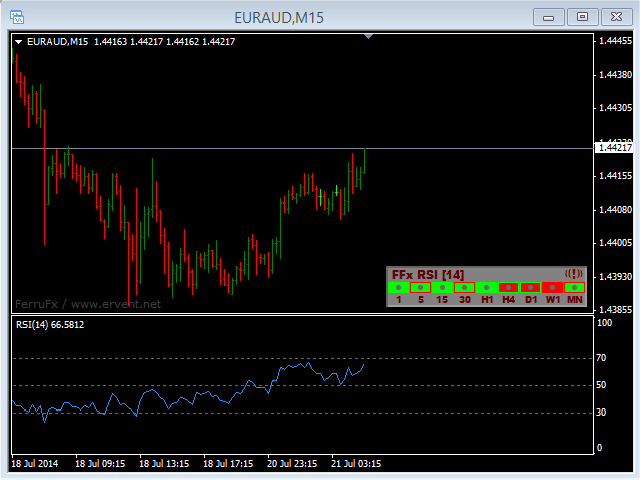
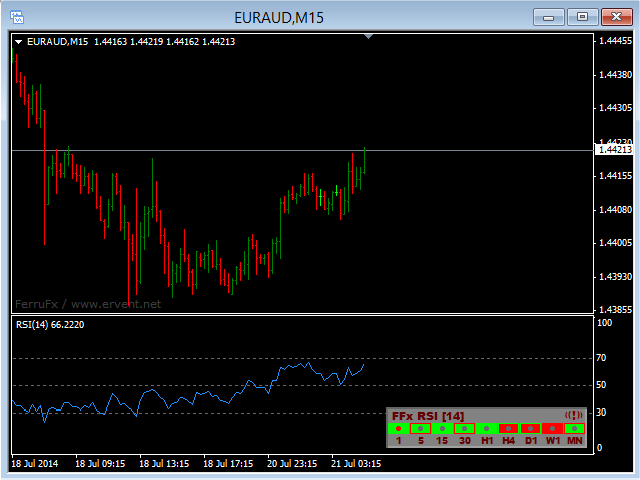
The FFx Dashboard MTF alerter will show you on a single chart all the timeframes (M1 to Monthly) with their own status for the indicator.
2 Alert Options:
- Single timeframe: each selected timeframe alert separately when a signal occurs
- Multi timeframes: all selected timeframes must agree for an alert to be triggered
Both options have an input to select the
timeframes to be used for the alert(s).
How to understand the status:
- Green/Red square: RSI above/below 50 line
- Green square + Red border: RSI above 50 but pointing down
- Red square + Green border: RSI below 50 but pointing up
- Green/Red dot: RSI in Overbought/Oversold zone
Options available in the FFx Dashboard Alerter:
- Select the timeframes to trigger the alerts
- Alert pop up/sound/email/push
- Activate/deactivate the alert directly on the chart
- Position on the chart
- ... and of course all usual settings of the standard indicator
How to set alert:
In the parameters pop up: select the alert you want and the alert mode (pop up and/or sound and/or email and/or push notification)
Then On chart: simple click on the ((!)) icon. It will change color signaling that it changed its status. Red to Green means it is now activated … Green to Red means that it is now deactivated.

I am a real Fan of FFx tools and its a pleasure to communicate with Ferru... you feel never alone.. RSI DASHboard works great and shows where real strengh is. even when adjusted to all TF... around 15 very good and strong entry signals per day..