Statistics of price movements
- インディケータ
- Anatolie Micriucov
- バージョン: 2.0
- アップデート済み: 7 8月 2020
- アクティベーション: 5
How to find out where to expect a price reversal with a probability of 80% - 90%?
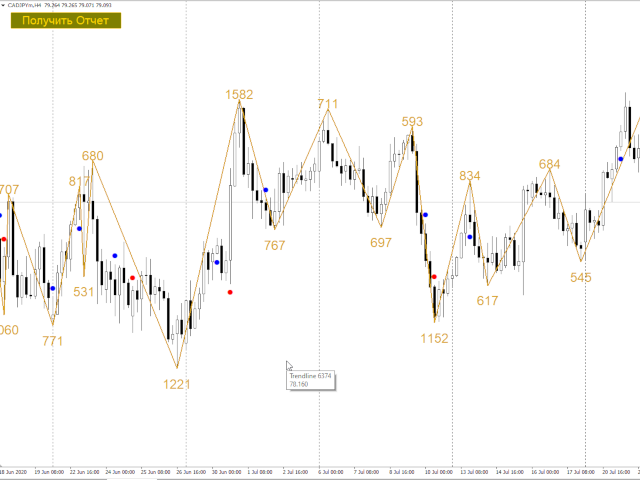
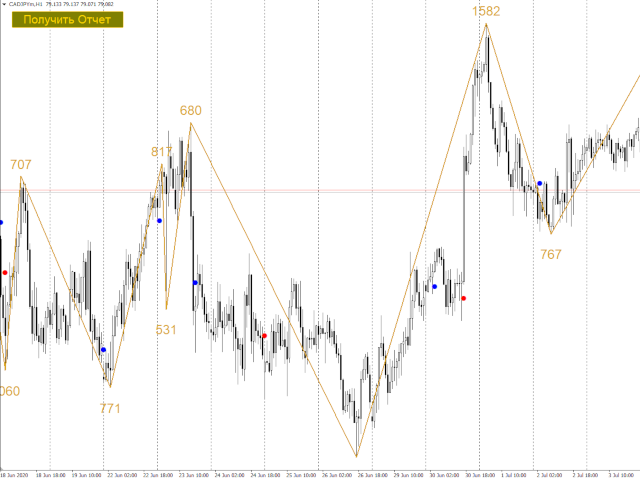
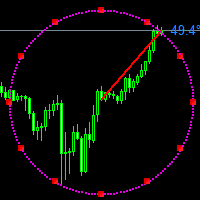
The "Statistics of Price Movements" indicator collects statistics of significant price movements, skipping all small pullbacks, for a certain period of time and displays them in
Excel file.
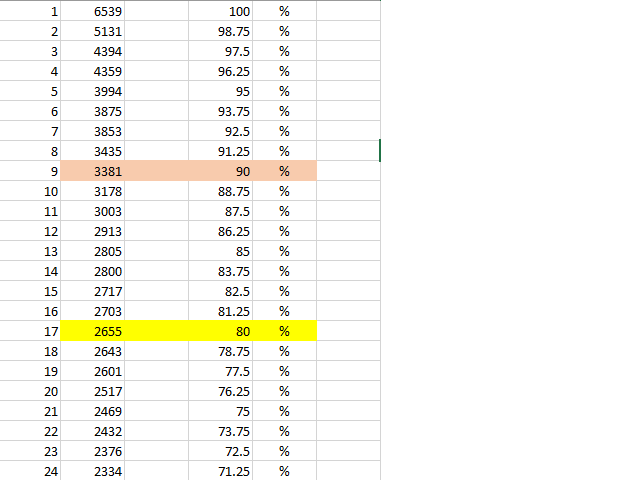
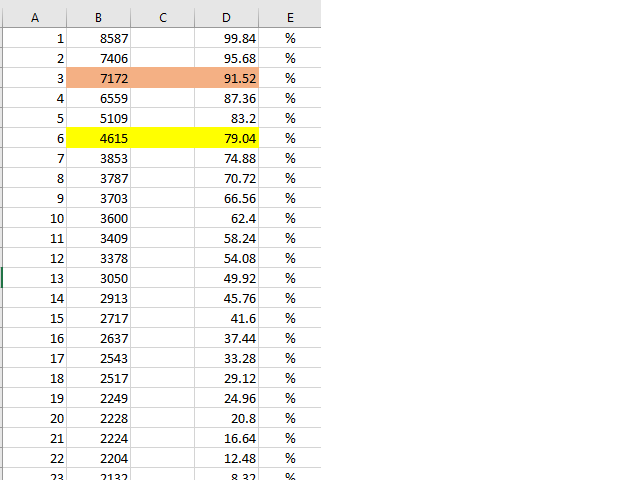
Sort the data in ascending order and get statistics of price reversals in 80%, 85%, 90%, 95% of all cases! (for example, in 2 years!)
After the reversal, the price will move from 1000 pips or more!
So...
Open the daily chart of the instrument. We set the indicator and set to watch the history for 2 years (for example. You can also 3, 4 years).
Set the Constant of the movement in pips (1000, 1500 or 2000 pips) and OK.
Click the "Get Report" button and open the Excel file.
Report files are saved along the path: "Open Data Folder \ MQL4 \ Files \ Statistic \ EURUSD_D1.csv",
Sort your data from great to small.
Divide 100% by the number of movements (1st column) and find out the percentage of one movement.
The resulting value is multiplied by an ordinal number. An example is below in the video.
We get the probability in which out of 100 percent there is a significant movement.
Thus, you can subtract a price reversal with a probability of 80 - 90 percent!
Thus, we have learned the motion value at 80% - This will be Level 1, and we enter the movement into level 2 with a 90% probability!
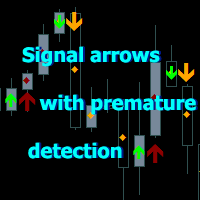
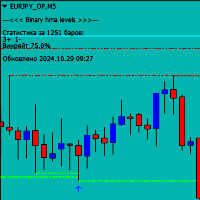
When the price reaches the 1st level, a dot will appear under (above) the price bar and there will be an alert! So it is with the 2nd level!
And it's all just math and numbers!
Trade with a probability of 80-90% !!!
