Geleg Faktor
- インディケータ
- Dariel Iserne Carrera
- バージョン: 2.3
- アップデート済み: 4 12月 2021
- アクティベーション: 10
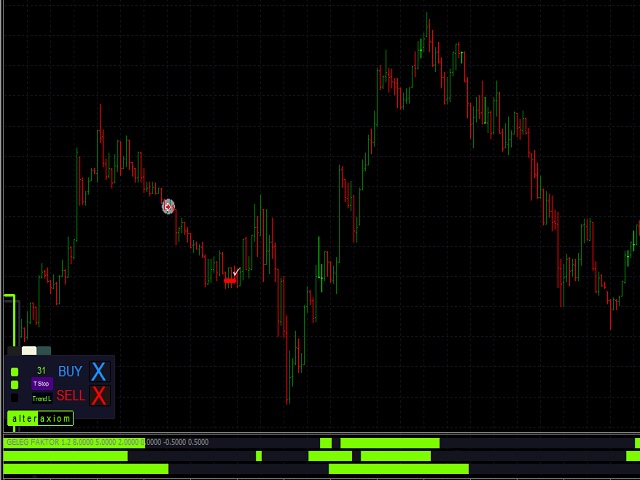
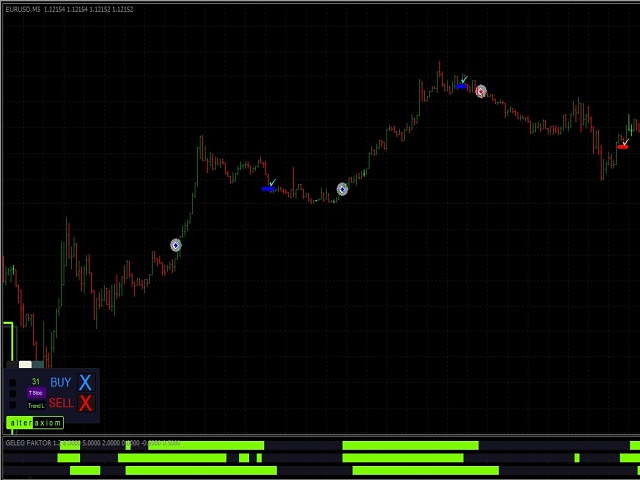
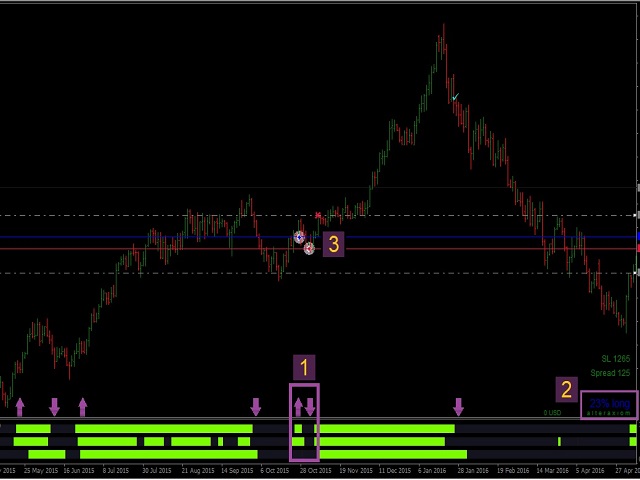
In the third screenshot (Daylight Mode) I have marked 7 elements that we are going to explain step by step.
1 ✅ Three buttons.
a) Night Mode
b) Daylight Mode
c) Fixed scale / Adjusted scale
2 ✅ Four buttons.
a) Draw a buy arrow, buy line and the corresponding Stop Loss based on ATR.
b) Close the previously drawn buy and drows a check mark.
c) Draw a sell arrow, sell line and the corresponding Stop Loss based on ATR.
d) Close the previously drawn sell and drows a check mark.
3 ✅ Three buttons
a) It simply shows the spread.
b) Updates the Stop Loss previously drawn and relocates them with the corresponding current value. They are selected by default. To delete them just press delete.
c) Draw several trend lines. They are selected by default. To delete them just press delete.
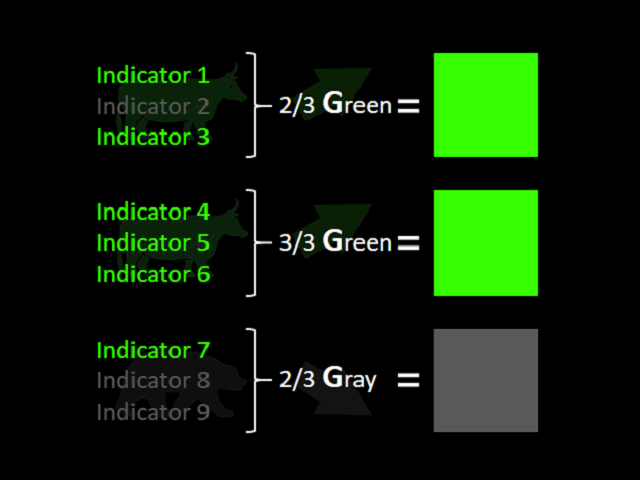
4 ✅ 5 dynamic elements that change according to the direction and strength of the market.
5 ✅ Necessary condition to open SELL.
6 ✅ Necessary condition to open BUY.
7 ✅ Same as 5.
As you can see, two bars are enough to open the next trade.
You can close the trade when the ATR trailing stop takes you out or wait for the next opposite signal.