Ultimum Signal
- インディケータ
- Filip Maurice Daelman
- バージョン: 3.0
- アップデート済み: 29 7月 2020
- アクティベーション: 10
Ultimum Signal Indicator contains the most powerful buy,sell and exit signals. They can all be be separately turned on/off, so you decide what to display on the chart !
This is my ultimum inidicator that is a no-nonsense, no delay, no repaint indicator !
Signals :
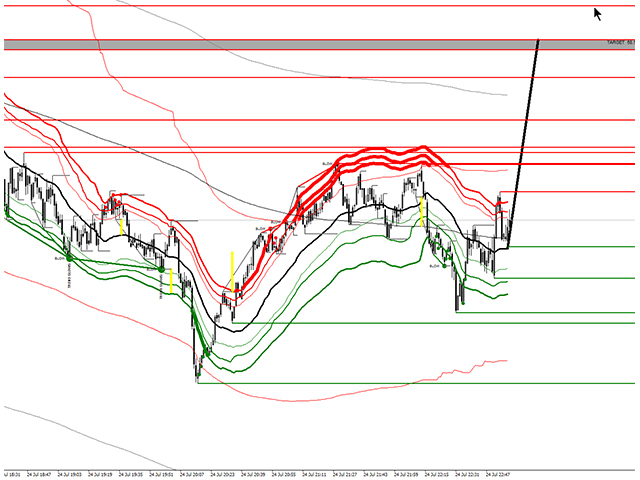
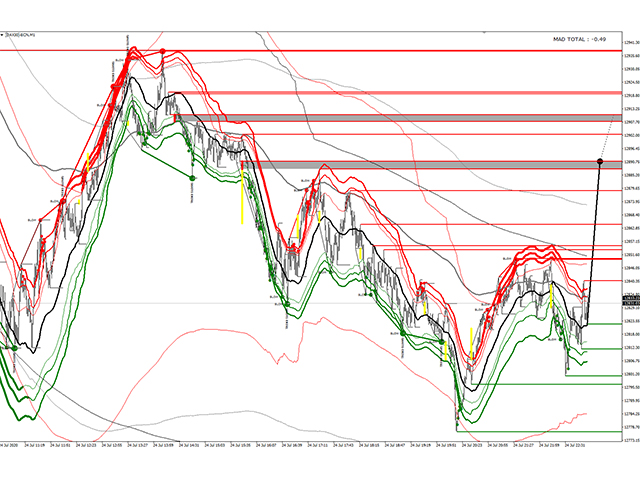
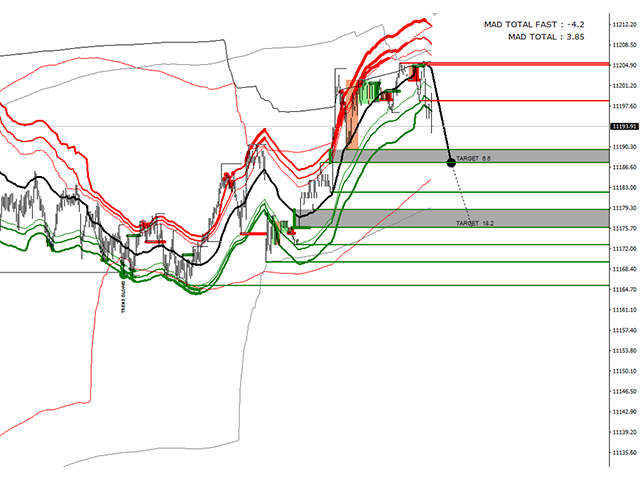
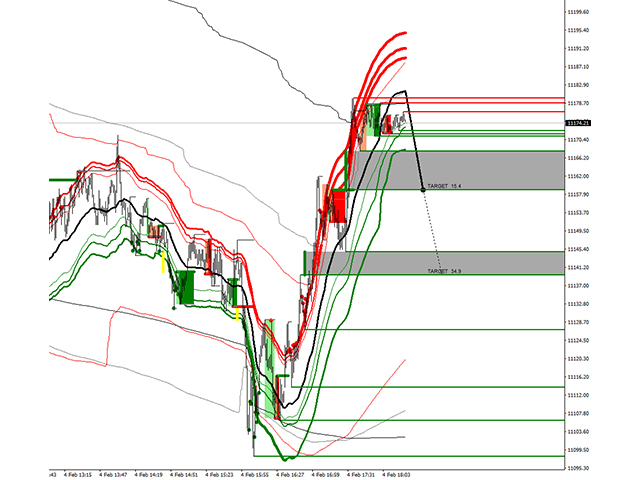
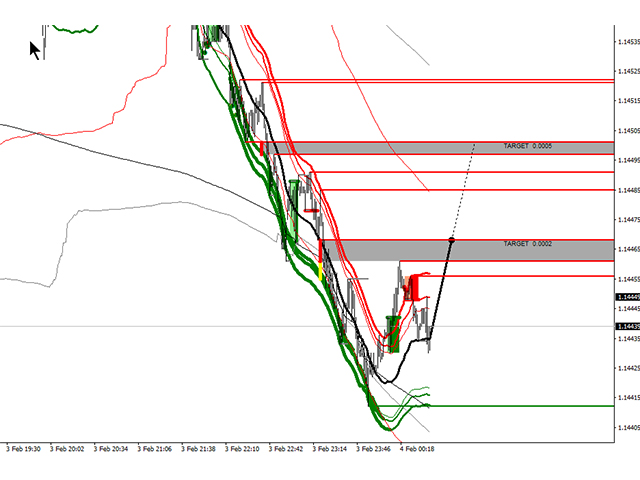
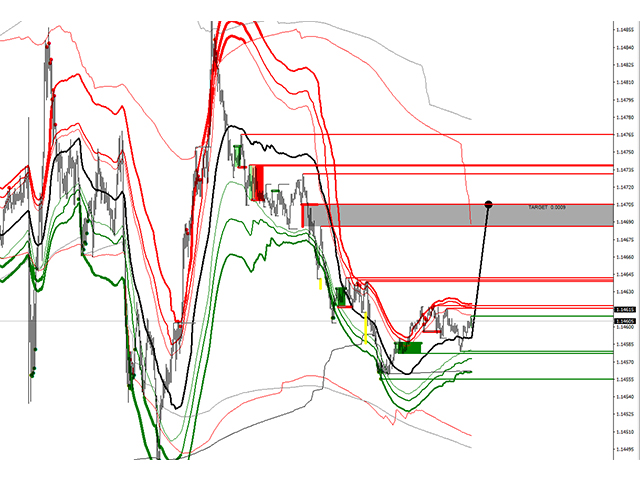
Target price levels :- Liquidity Pools (Liquidity voids, major supply/demand zones, and price discrepancies)
- Liquidity Pools Forecast Projection
- Reversal Blocks
- Pinbar groups
- Trend and mastertrend slowdowns (indicating reversals)
- Overbought/Oversold with DynamicMoving Average Band (5 MA bands)
The Moving average bands (envelop) are dynamically calculated based on the number of hits in the past. This value is set as 'hitcount' in the settings.
The envelop is set so that the "hitcount" matches for the given period !
For the MA50 there are 3 bands displayed : hitcount, hitcount x 2 and hitcount x 3
Liquidity is an important aspect in the market, especially for institutional investors, as they need lots of liquidity to enter or exit the market.
Therefore, institutional traders focus more on demand/supply metrics than to the traditional technical analysis tools and techniques.
Levels that have been hit will stay on the chart as gray lines. This way you can see how these levels attract price action as a magnet.
The indicator works on any instrument or any timeframe.
There is a demo version of this indicator available to use in Strategy tester. Please reduce the backbars to less than 200 for testing or make sure your backtest data goes far enough in the past. This gives however not the best idea of the capacity of the indicator. For full service backbars should be at least at 2500 to 5000 .
The default settings work for all periods and intruments dynamically. Contact me for set file for other instruments if necessary.
You will immediately notice the use and the effectiveness of this indicator.
Thanks for sharing, if you are happy please leave a positive review and a comment.
Don't hesitate to contact me for support, setting files, issues or in case you are not happy, or if it is not working with your broker/instrument.
IMPORTANT : Some calculations are based on the default Zig Zag indicator, which should be present in the root indicators folder.