Linear Regression Trend MQL5
- インディケータ
- Nery Adrian Gay
- バージョン: 1.1
- アップデート済み: 25 7月 2020
- アクティベーション: 5
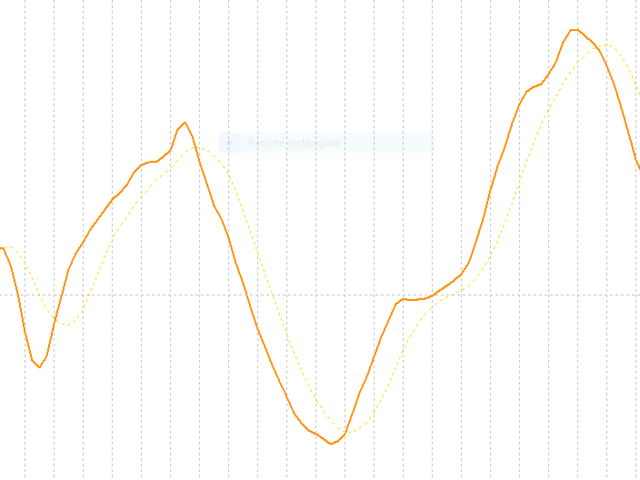
線形回帰の勾配値の表現。スロープ値の変化(価格の加速/減速)を視覚的に判断するための参照プロットがあります。
パラメーター
•Periods:線形回帰を計算する期間の数
•PeriodsReference:メインプロットの値の移動平均を計算するための期間数
•Displacement:水平軸上の変位
•AppliedPrice:計算が行われる価格
•MainPlot:メインプロットの表示
•ReferencePlot:参照プロットの表示
使用のための提案
•現在の価格傾向を簡単に表示できます。 MainPlotがゼロより大きい場合、傾向は正であり、ゼロより小さい場合は負です。
•勾配の変化(価格の加速/減速)を簡単に視覚化できます。 MainPlotがReferencePlotを上回っている場合、価格は加速しており、下回っている場合、価格は減速しています。
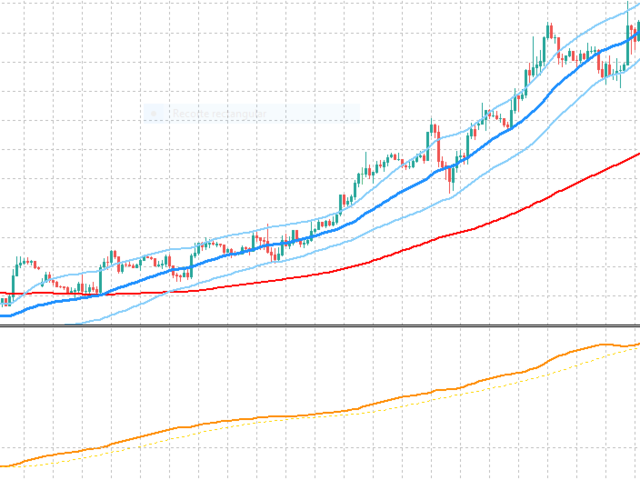
•スイング取引または高速取引に最適です。
•取引の主な方向を決定するのに理想的(購入/販売)。
•値領域(サポート、レジスタンス)に関する直接的な情報を提供しないため、移動平均や線形回帰バンドなどの価格インジケーターと組み合わせるとよいでしょう。
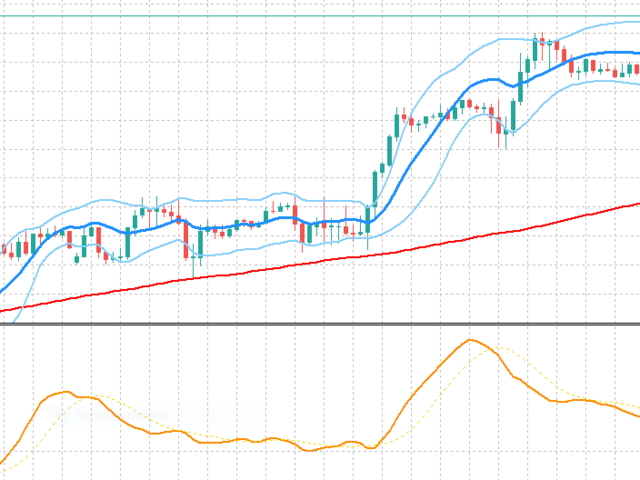
•MainPlotがゼロと交差したときに、市場の反応ゾーン(サポート、レジスタンス)に関する間接的な情報を提供します(交差期間を価格領域と比較して、市場が反応したバリューゾーンを決定する必要があります)。
覚えておいてください!!!…
•インジケーターは単なるツールであり、特効薬はありません。警告を盲目的に信じないでください。
•取引スタイルに固執し、戦略を準備し、それと一致し、必要に応じて改善を適用します。
•ツールと代替案をよく研究し、お金を管理することを忘れないでください。
•トレンドの方向を特定し、必要に応じて別の方法で確認し、リスクを定義し、バリューエリア(サポートとレジスタンス)を特定し、市場がこれらのバリューエリアにどのように反応するか(価格アクション)を確認し、忘れないでください基本的な分析を行うことは常に多くのことを助けます。
パラメーター
•Periods:線形回帰を計算する期間の数
•PeriodsReference:メインプロットの値の移動平均を計算するための期間数
•Displacement:水平軸上の変位
•AppliedPrice:計算が行われる価格
•MainPlot:メインプロットの表示
•ReferencePlot:参照プロットの表示
使用のための提案
•現在の価格傾向を簡単に表示できます。 MainPlotがゼロより大きい場合、傾向は正であり、ゼロより小さい場合は負です。
•勾配の変化(価格の加速/減速)を簡単に視覚化できます。 MainPlotがReferencePlotを上回っている場合、価格は加速しており、下回っている場合、価格は減速しています。
•スイング取引または高速取引に最適です。
•取引の主な方向を決定するのに理想的(購入/販売)。
•値領域(サポート、レジスタンス)に関する直接的な情報を提供しないため、移動平均や線形回帰バンドなどの価格インジケーターと組み合わせるとよいでしょう。
•MainPlotがゼロと交差したときに、市場の反応ゾーン(サポート、レジスタンス)に関する間接的な情報を提供します(交差期間を価格領域と比較して、市場が反応したバリューゾーンを決定する必要があります)。
覚えておいてください!!!…
•インジケーターは単なるツールであり、特効薬はありません。警告を盲目的に信じないでください。
•取引スタイルに固執し、戦略を準備し、それと一致し、必要に応じて改善を適用します。
•ツールと代替案をよく研究し、お金を管理することを忘れないでください。
•トレンドの方向を特定し、必要に応じて別の方法で確認し、リスクを定義し、バリューエリア(サポートとレジスタンス)を特定し、市場がこれらのバリューエリアにどのように反応するか(価格アクション)を確認し、忘れないでください基本的な分析を行うことは常に多くのことを助けます。